The document discusses common-size financial statements, which express all items in a statement as a percentage of a common item. Specifically:
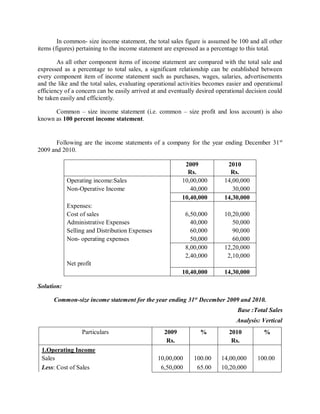
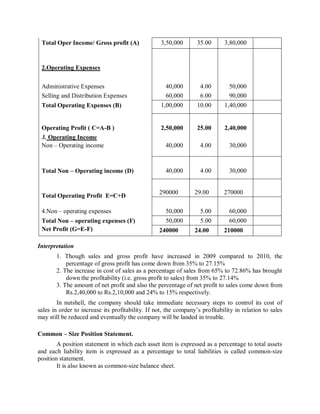
- In a common-size income statement, total sales is set at 100% and all other items are shown as a percentage of sales.
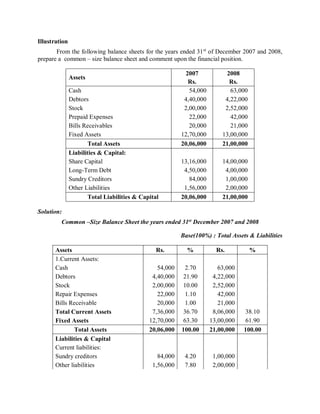
- In a common-size balance sheet, total assets is set at 100% and asset items are shown as a percentage of total assets, while liabilities items are shown as a percentage of total liabilities.
- Two examples are provided to illustrate how to construct common-size income statements and balance sheets from raw financial data, and analyze the percentages to evaluate a company's performance over time.