Downloaded 508 times


![171CHAPTER 4
FEEDING PROGRAMS FOR LAYING HENS
SECTION 4.2
Feed and energy intake
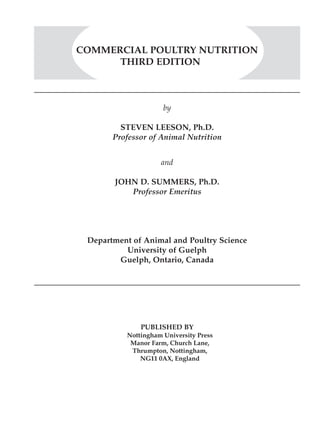
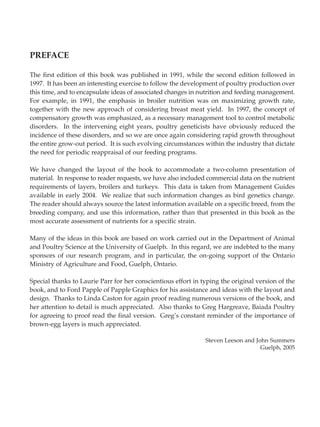
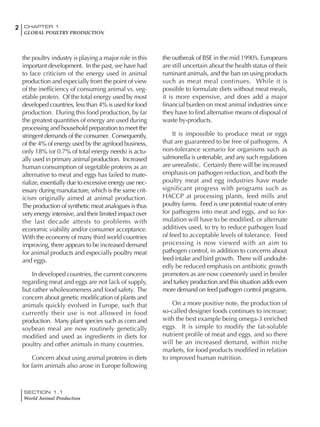
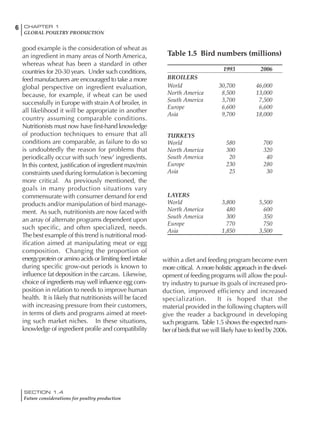
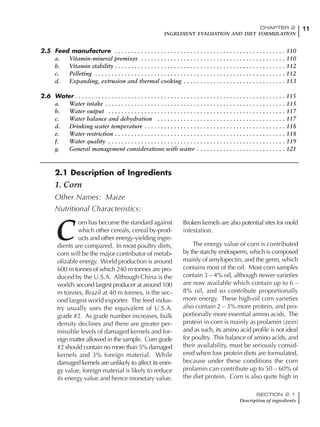
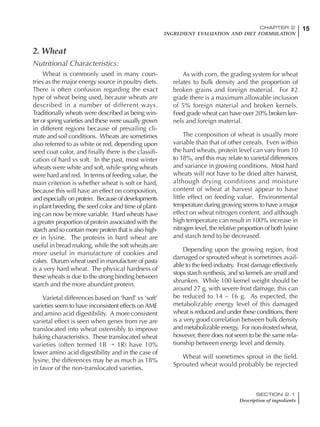
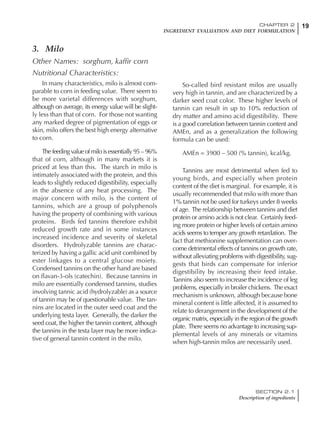
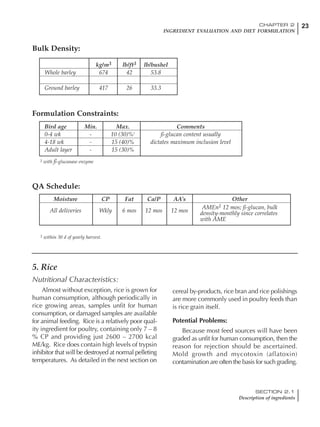
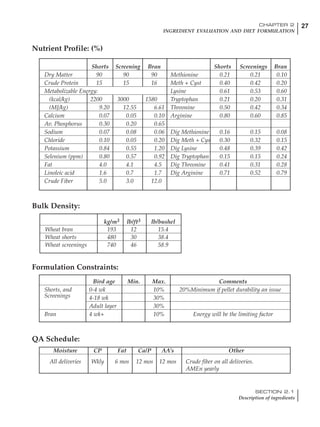
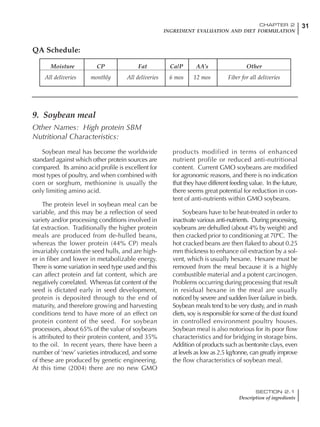
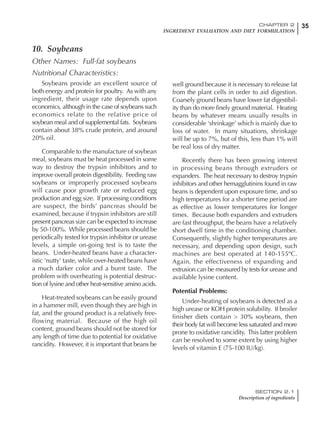
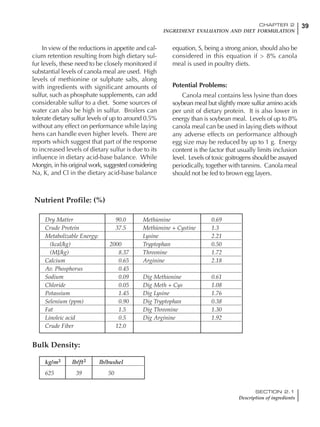
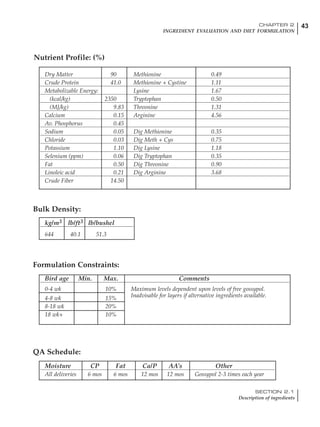
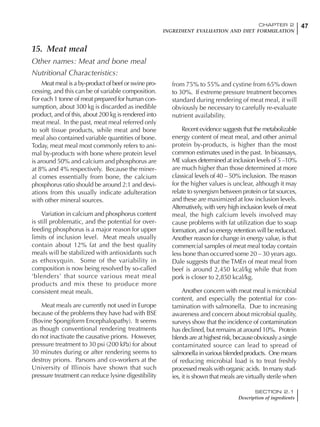
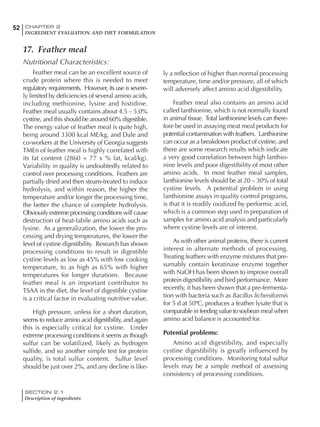
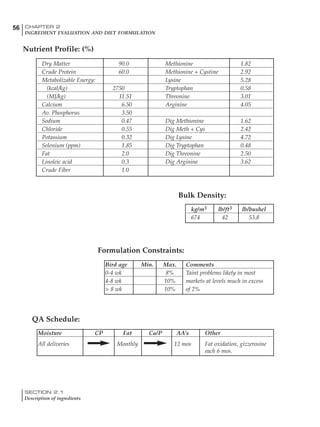
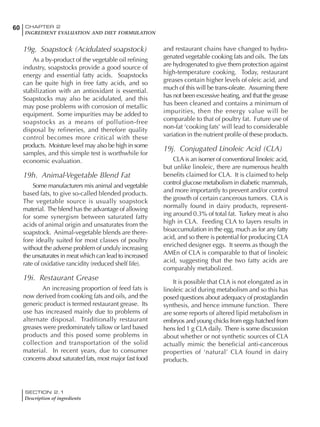
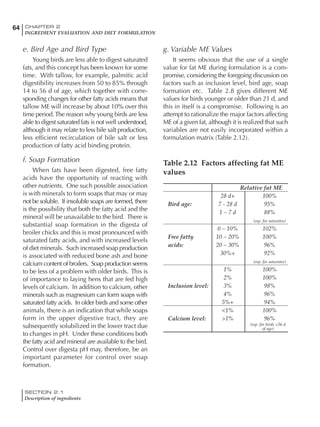
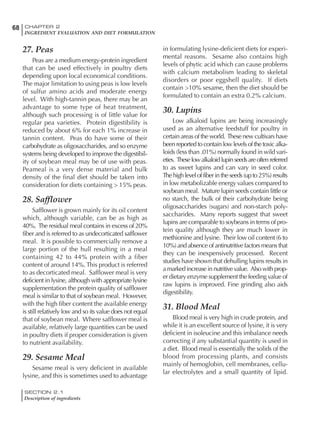
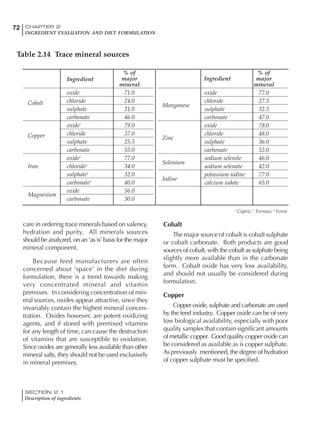
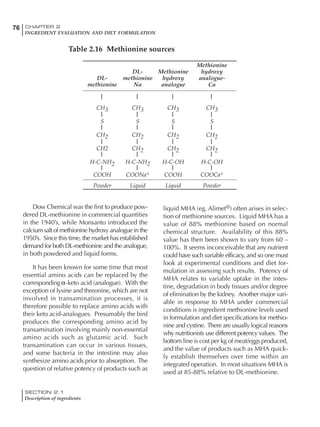
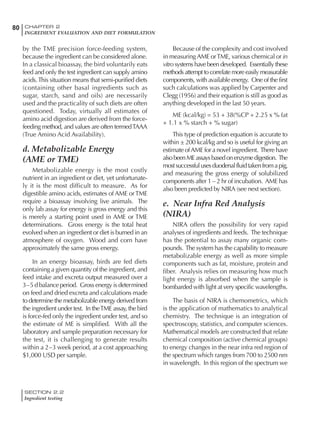
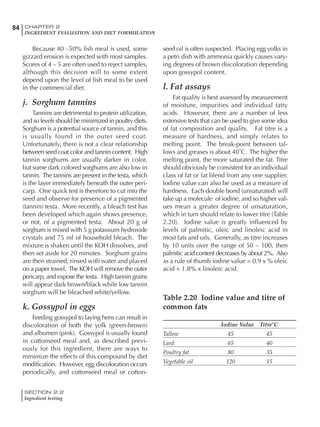
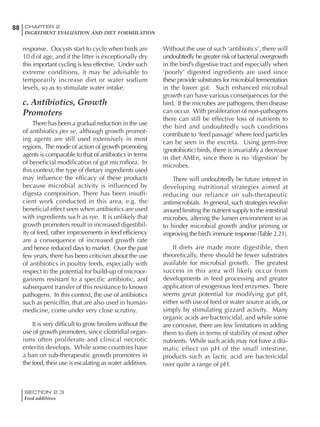
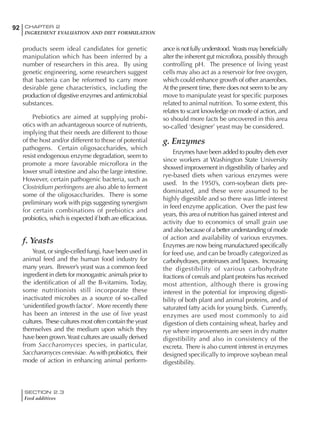
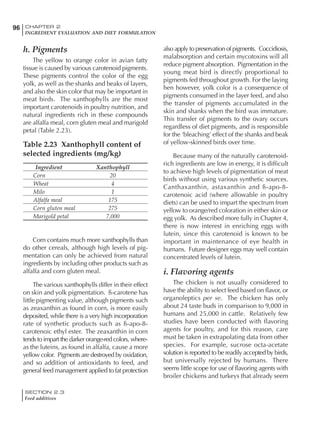
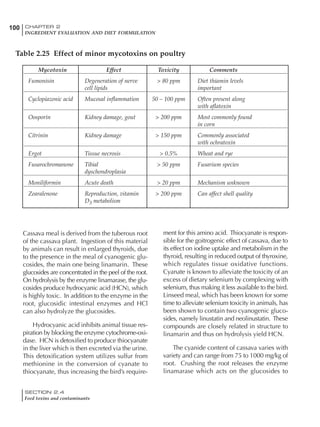
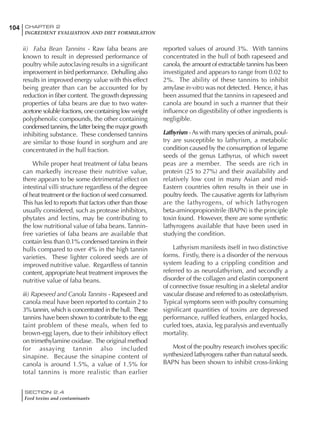
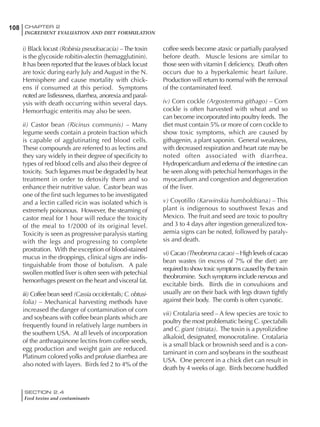
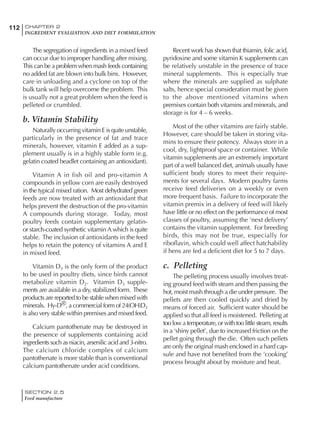
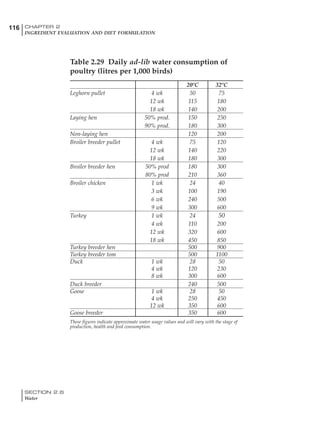
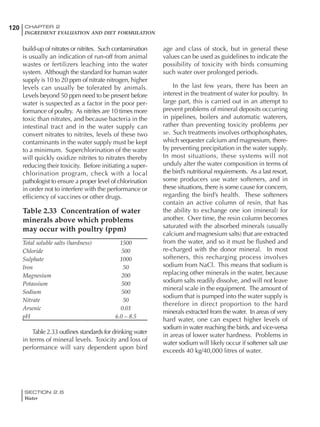
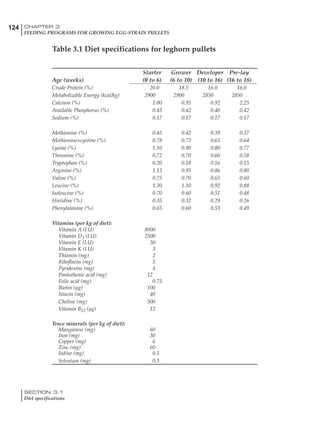
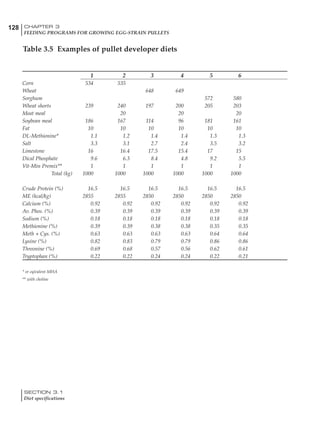
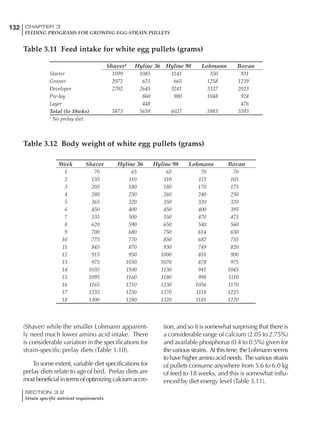
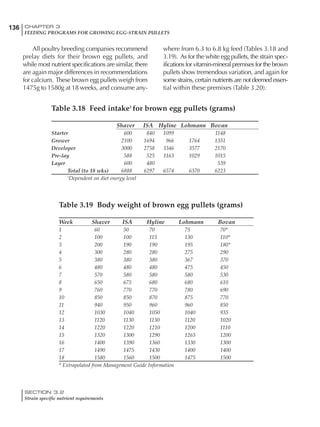
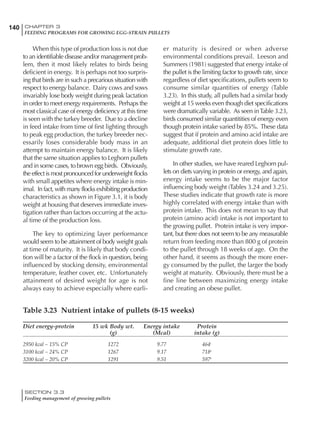
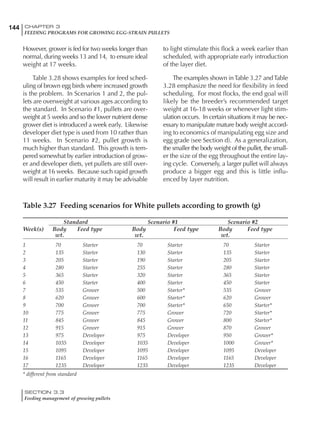
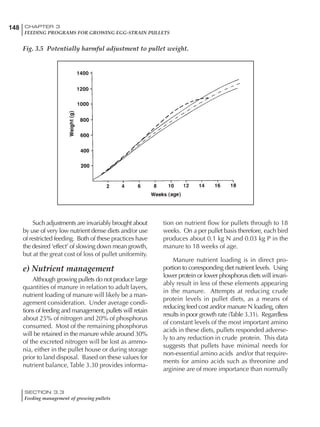
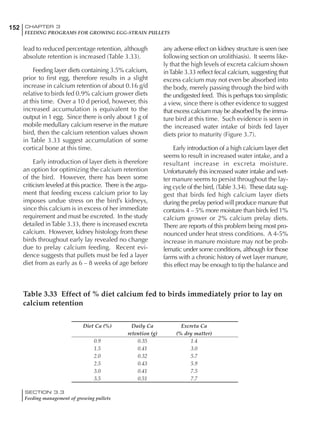
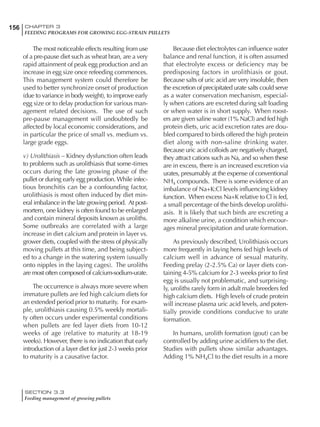
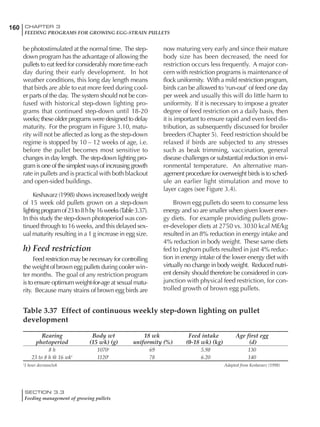
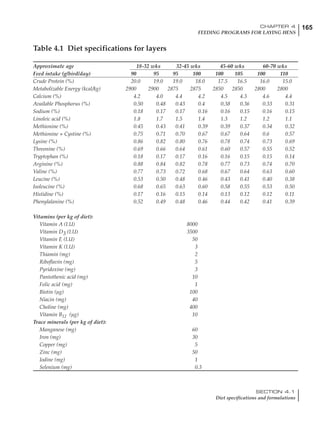
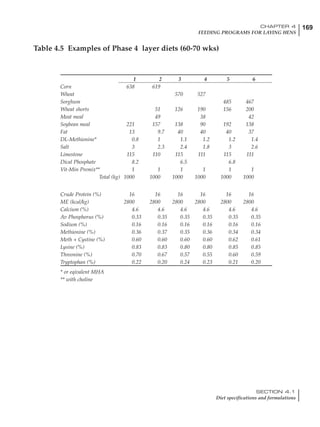
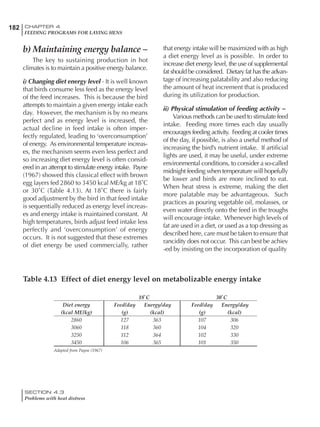
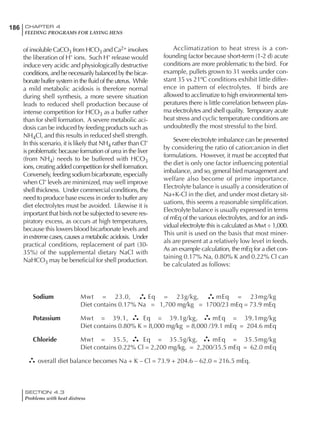
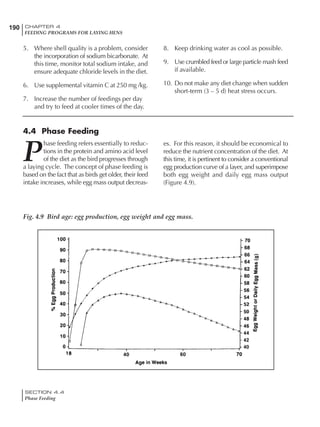
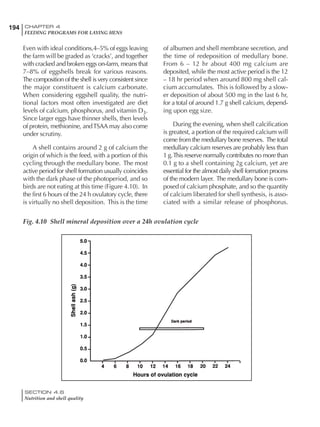
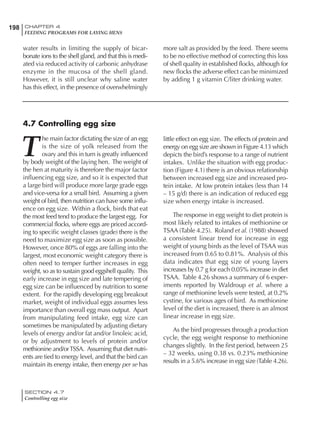
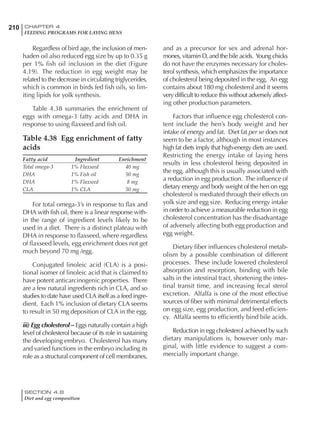
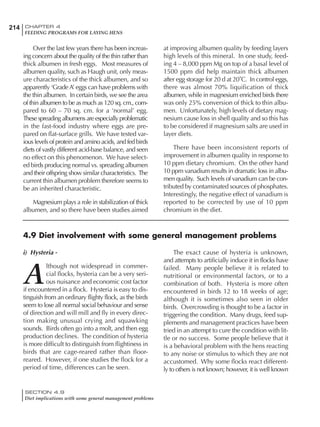
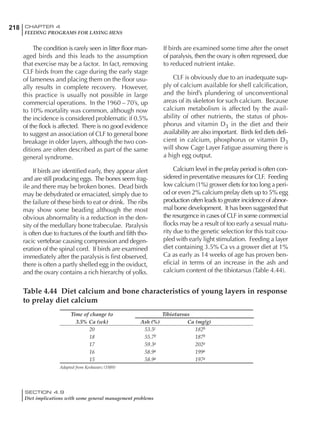
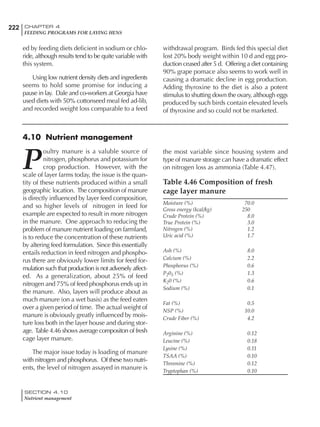
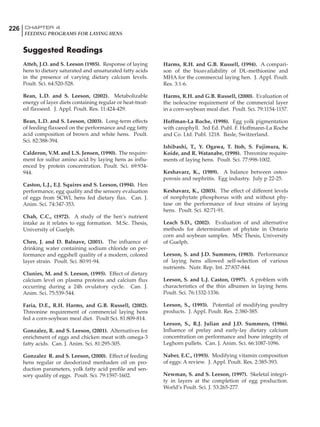
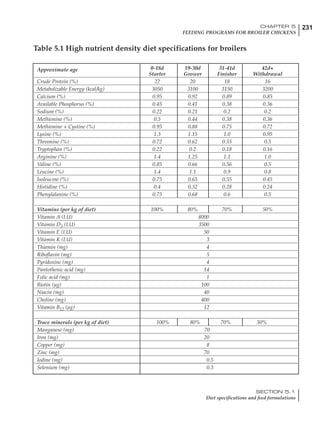
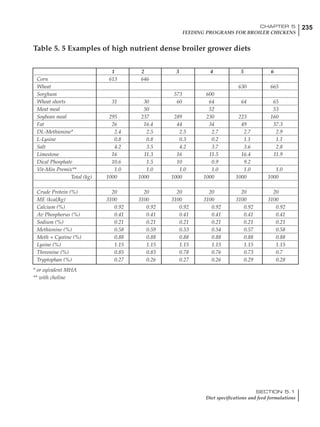
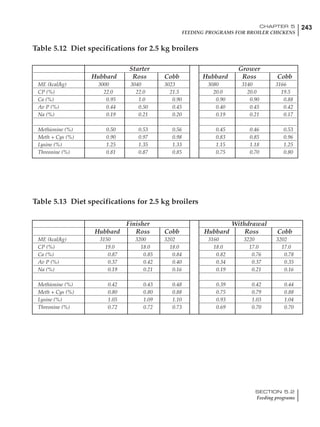
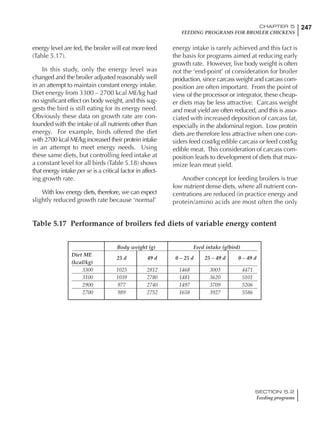
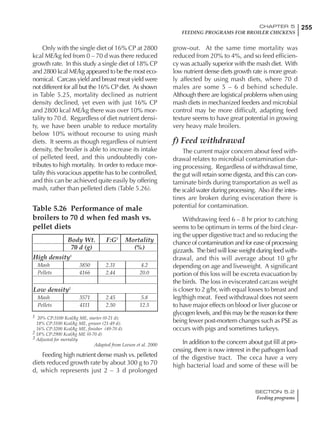
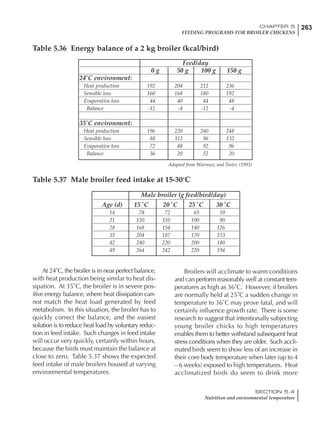
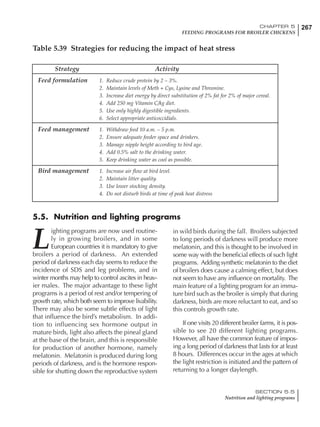
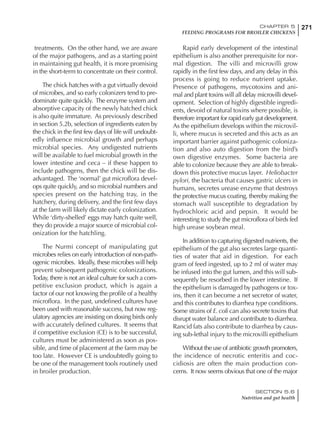
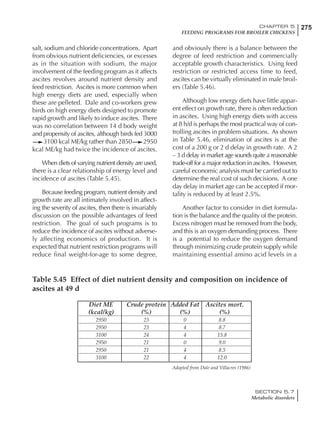
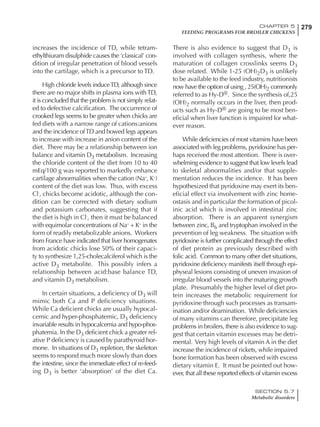
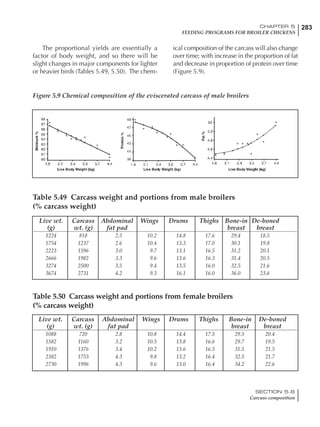
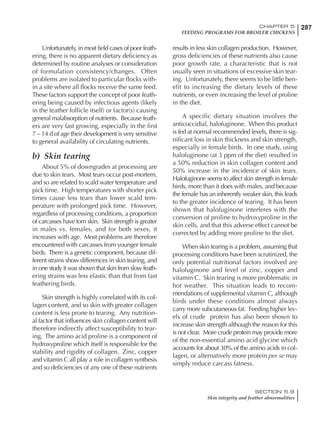
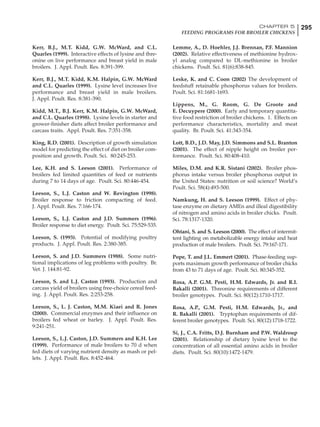
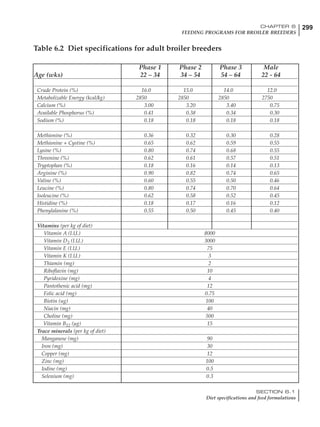
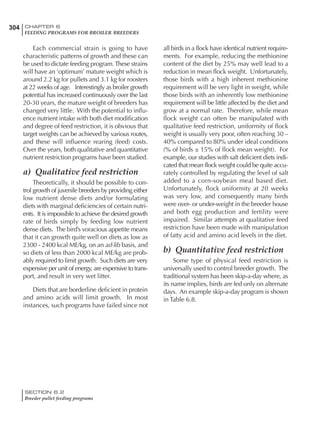
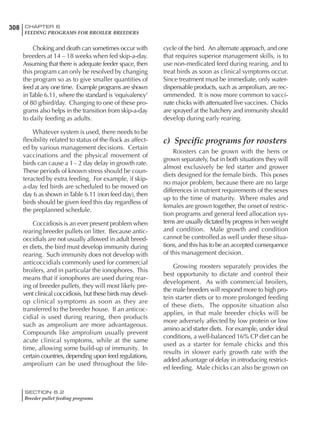
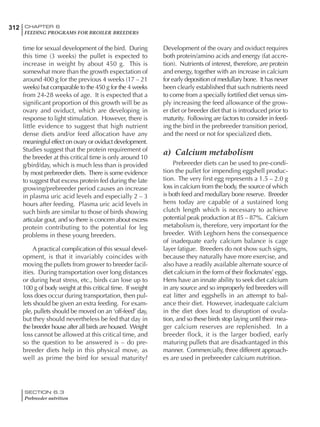
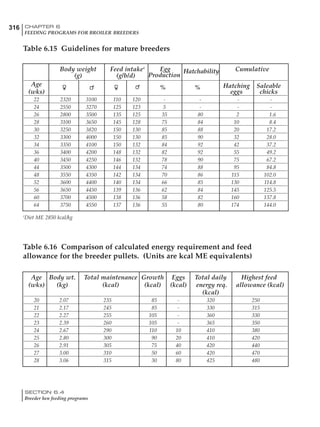
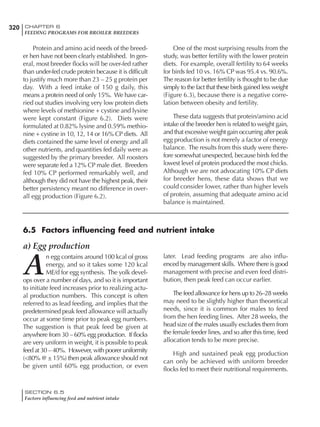
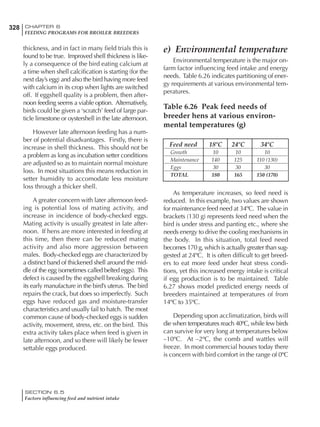
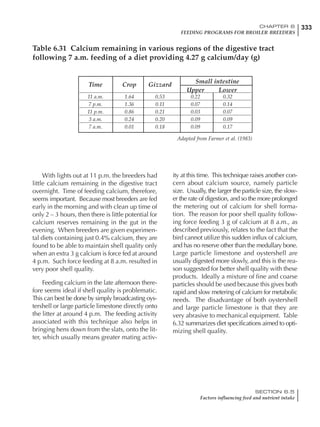
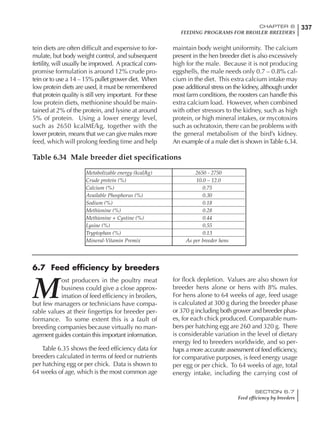
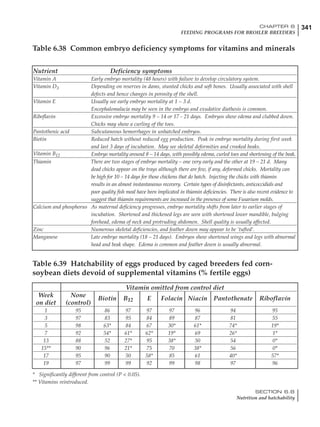
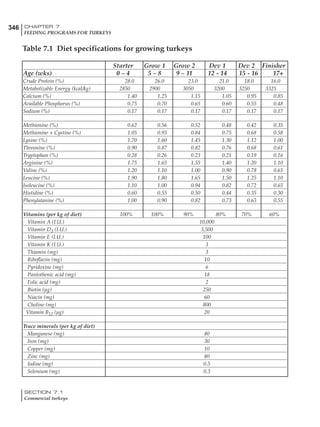
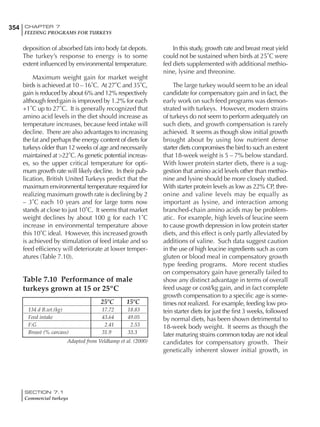
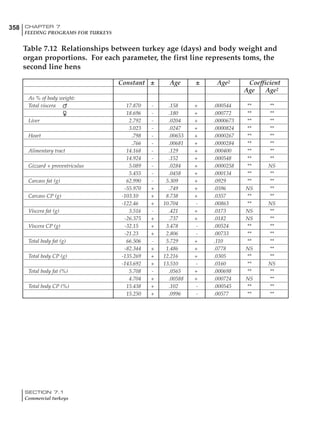
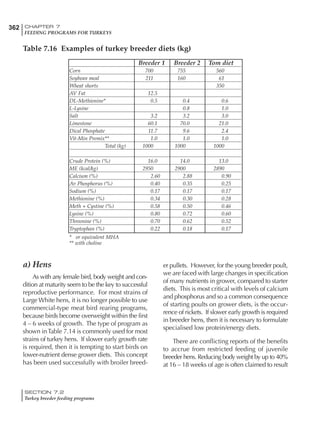
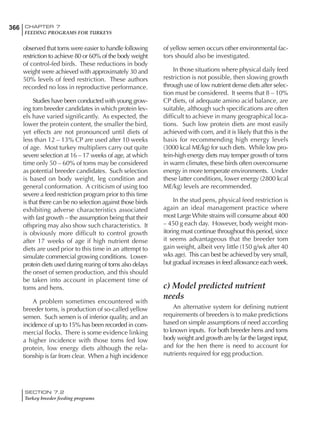
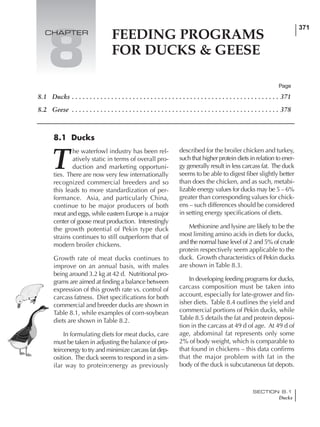
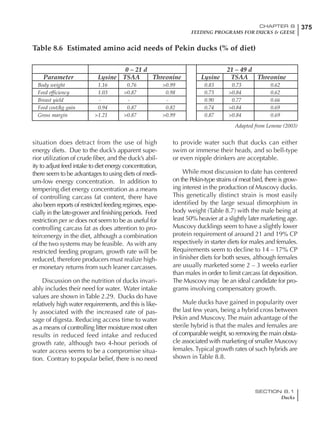
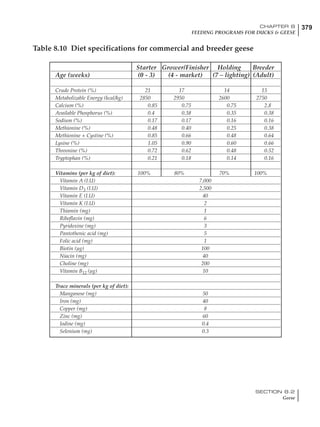
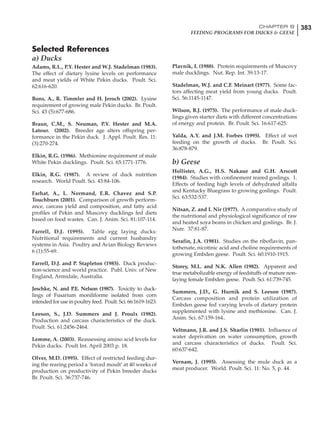
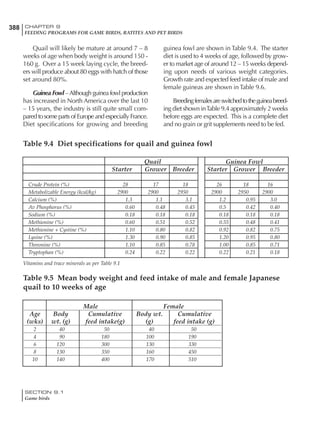
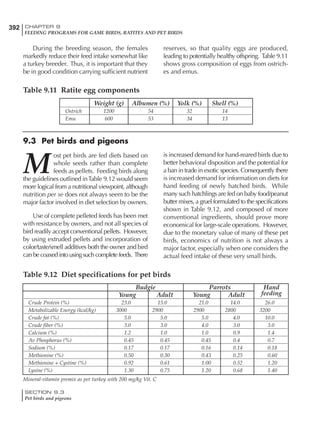
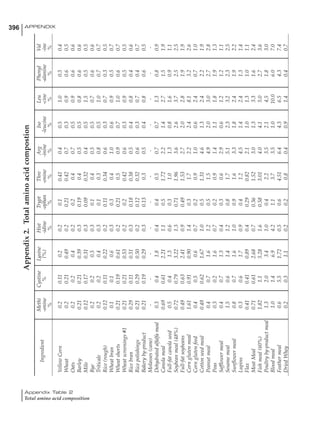
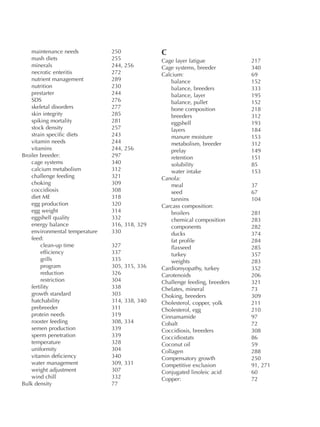
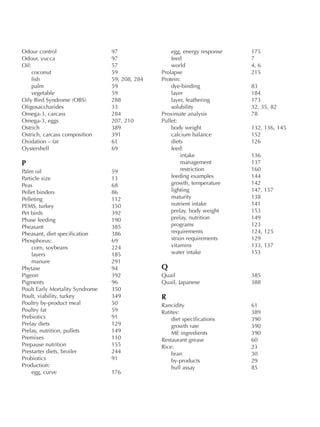
Table 4.6 Daily nutrient needs for Leghorn birds.
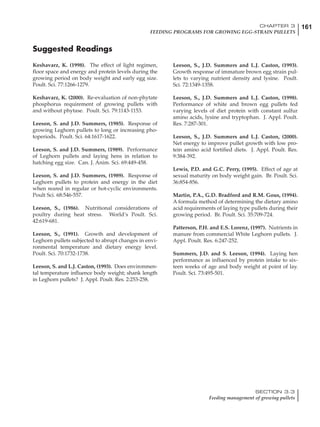
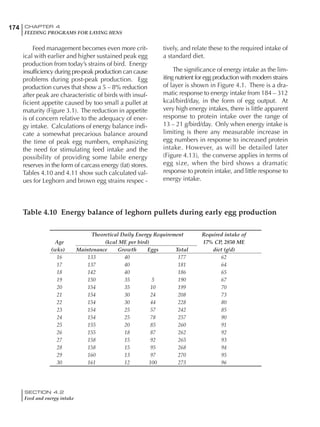
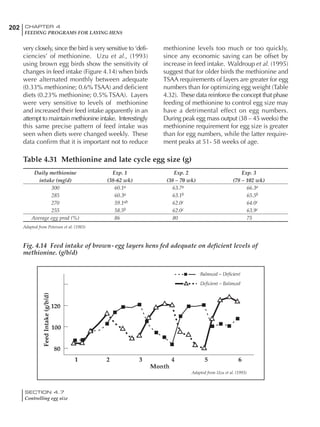
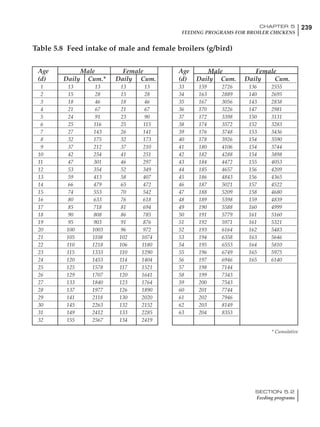
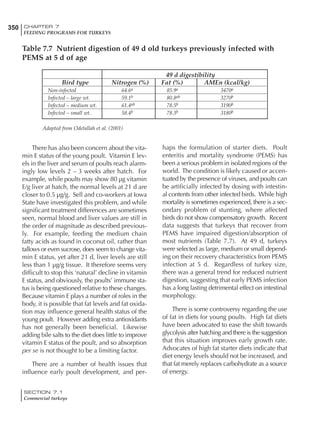
Table 4.7 Feed intake of Leghorns as influenced by body weight, egg
production, egg weight and environmental temperature1
Body weight Egg production Egg weight Temperature
Body wt Intake Egg production Intake Egg wt Intake ºC Intake
(g) (g/d) (%) (g/d) (g) (g/d) (g/d)
1200 92.7 98 100.5 50 90.8 10 102.2
1250 94.9 94 98.8 55 94.0 15 102.1
1300 97.1 90 97.1 60 97.1 20 97.1
1350 99.3 86 95.4 65 100.3 25 92.1
1400 101.5 82 93.8 70 103.4 30 87.1
23g 1 g 2.4% 1 g 1.6 g 1 g 1ºC 1 g
1 Assumes 1300 g body weight, 90% egg production, 60 g egg weight and 20 C as the standard, with diet at 2850 kcal/kg
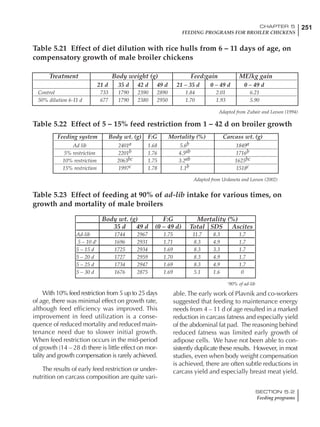
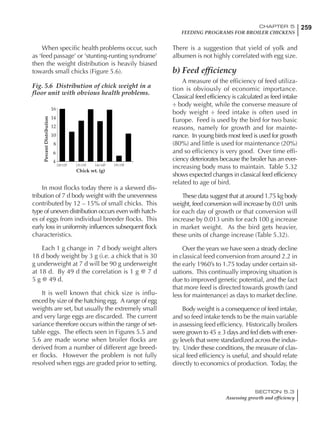
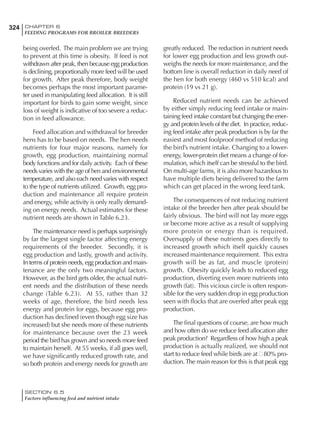
At any given time, it is necessary to adjust diet
specifications according to the actual feed intake
of the flock. Within a single strain it is possible
to see a ± 15 g variance in feed intake at any age
related to stage of maturity, egg mass, body
size and most importantly, environmental tem-
perature.
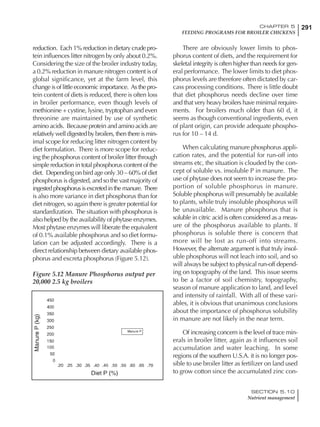
It is possible to predict energy needs, and hence
feed intake, based on knowledge of the major
variables. The equation most commonly used
is described below. Using this equation, Table
4.7 was developed with variable inputs of body
weight, egg production, egg weight and envi-
ronmental temperature. Feed intake was calculated
assuming a diet energy level of 2850 kcal ME/kg.
Energy (kcal ME/bird/day) = [Body weight (kg)] [170 – 2.2 x ºC]
+ [2 x Egg mass/d (g)]
+ [5 x Daily weight gain (g)]
Age (wks)
18 – 32 32 – 45 45 – 60 60 – 70
Protein (g) 20 18.5 17.5 16
Metabolizable energy (kcal) 260 290 285 280
Calcium (g) 4.0 4.2 4.4 4.6
Av. Phosphorus (mg) 550 450 380 330
Methionine (mg) 500 430 390 340
TSAA (mg) 830 740 670 600
Lysine (mg) 950 840 780 730](https://image.slidesharecdn.com/commercialpoultrynutrition-130530001831-phpapp02/85/Commercial-poultry-nutritio-178-320.jpg)


![330 CHAPTER 6
FEEDING PROGRAMS FOR BROILER BREEDERS
SECTION 6.5
Factors influencing feed and nutrient intake
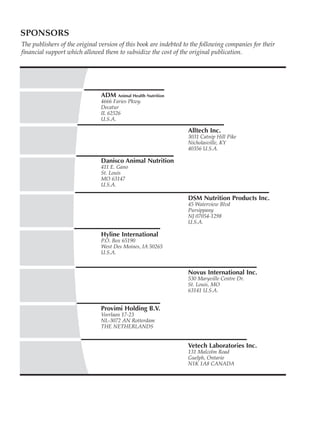
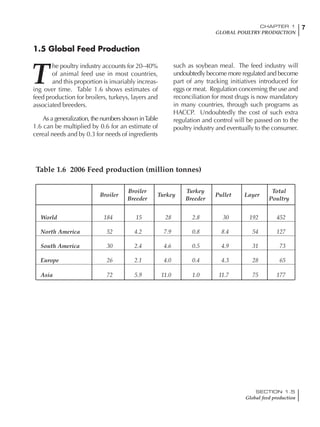
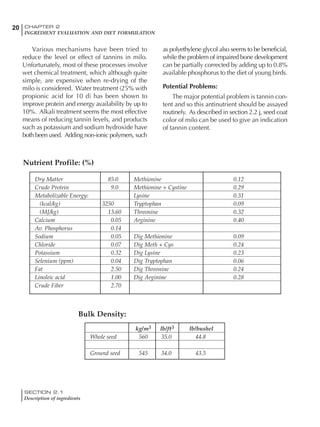
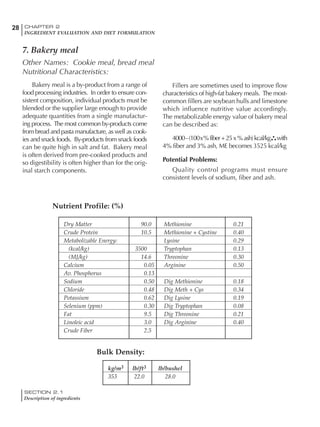
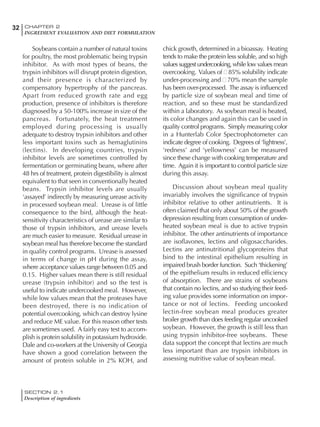
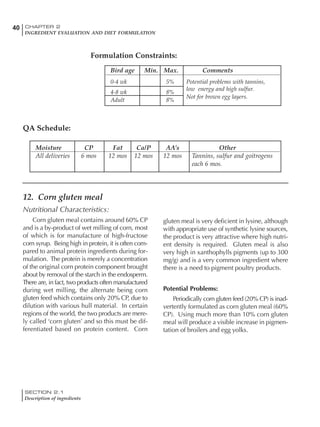
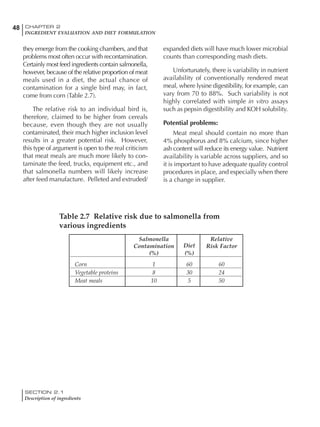
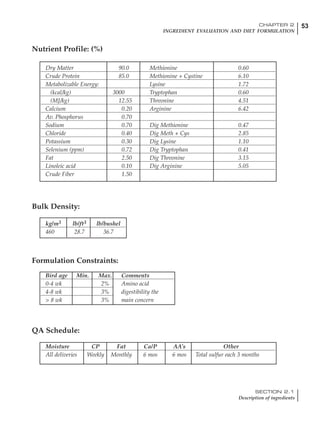
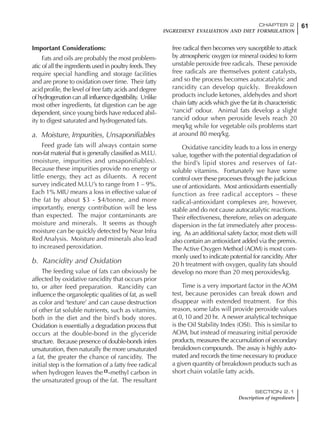
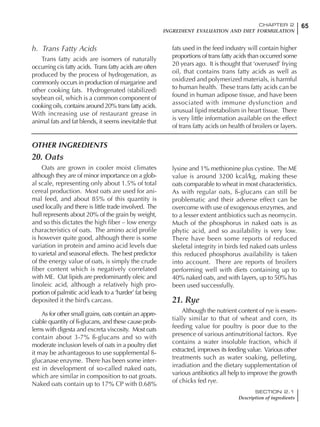
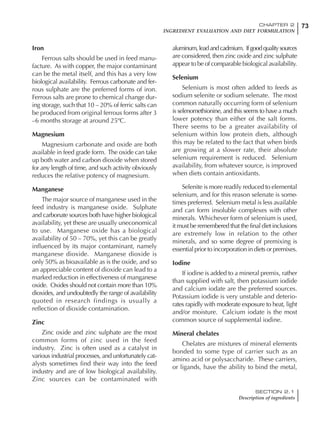
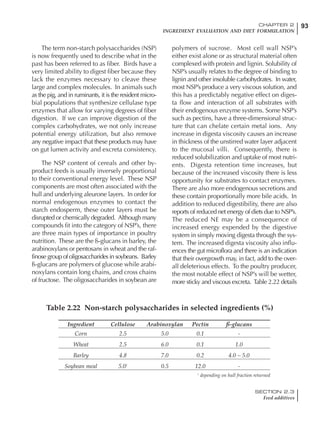
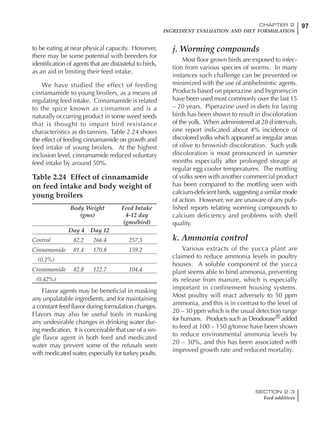
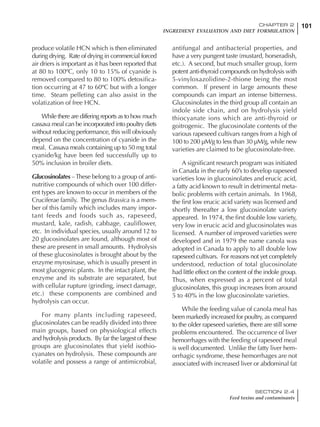
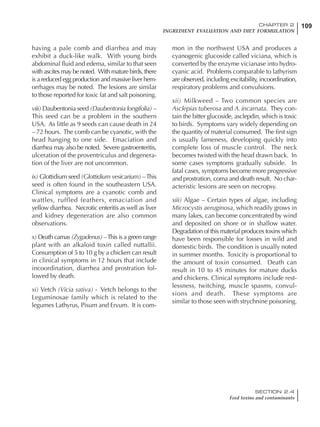
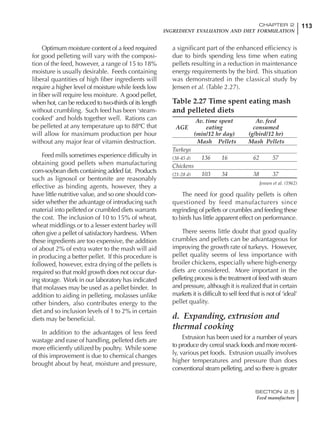
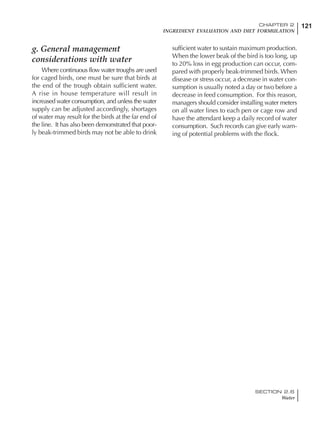
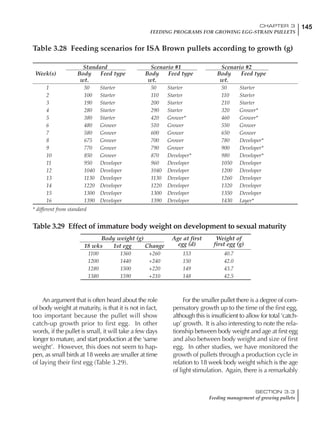
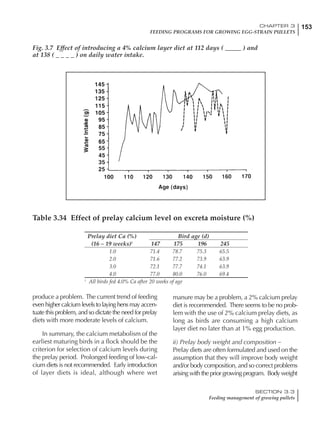
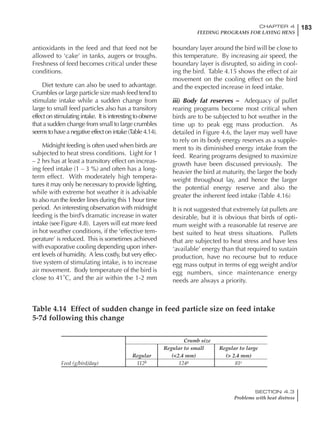
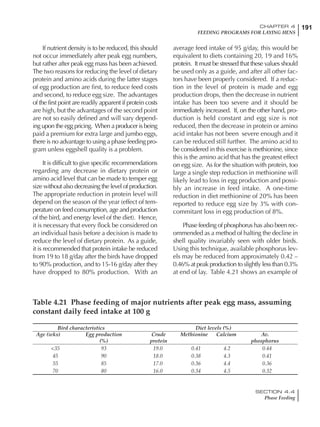
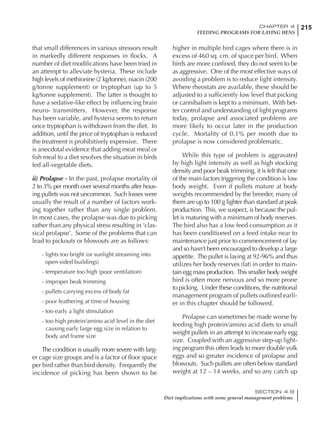
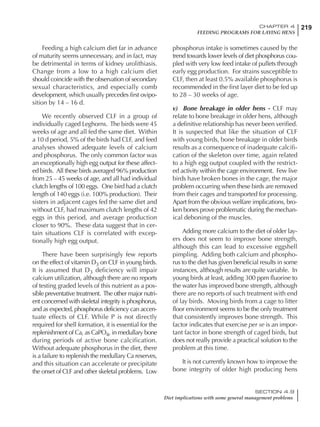
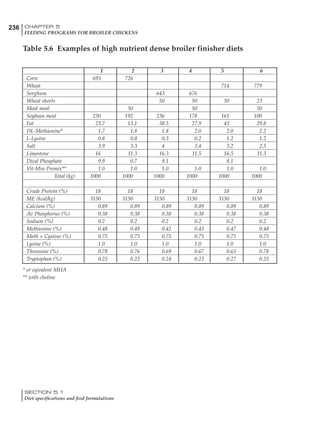
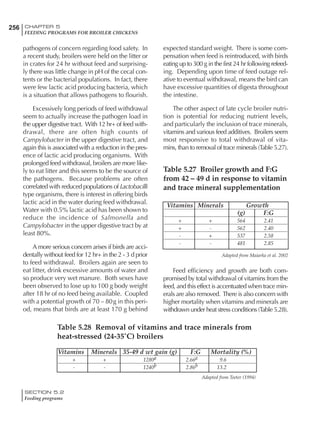
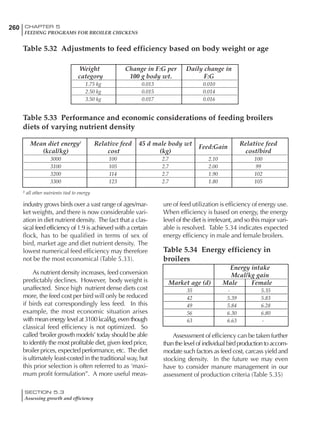
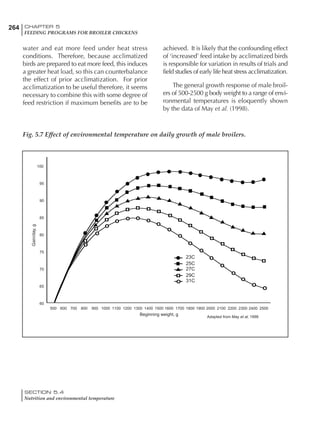
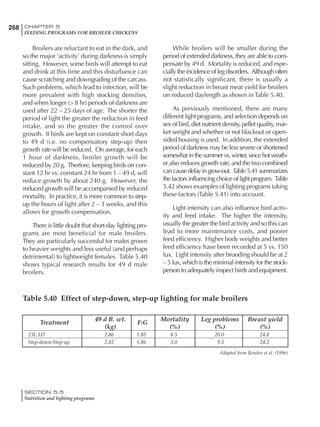
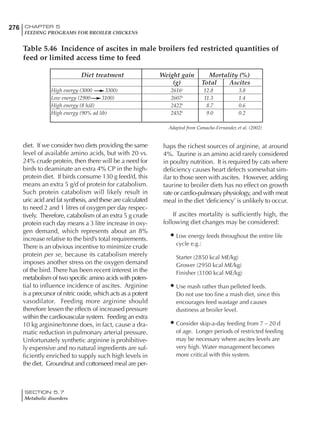
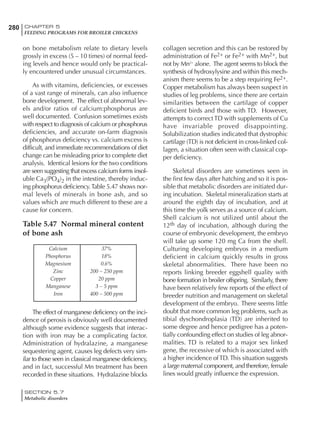
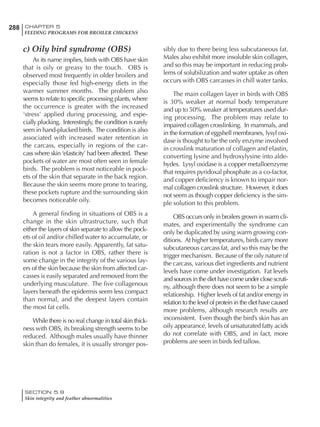
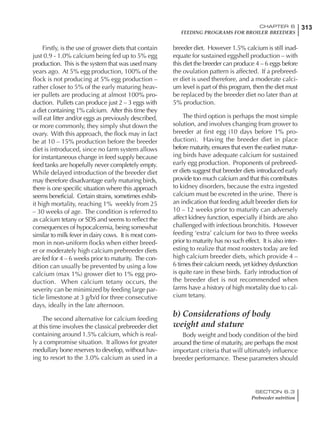
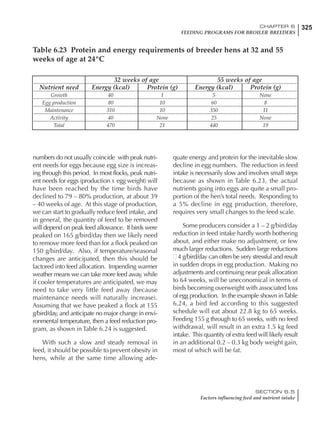
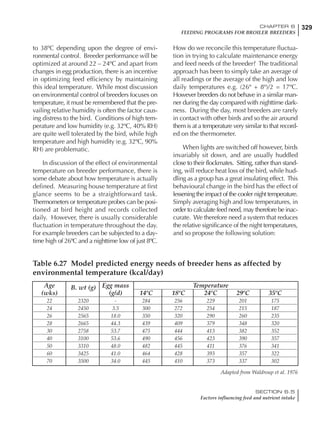
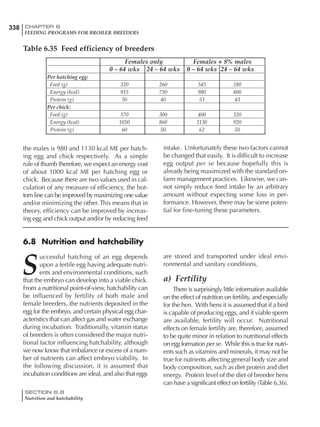
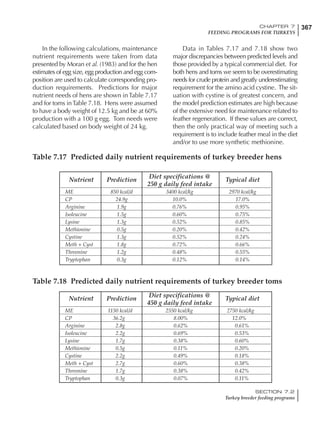
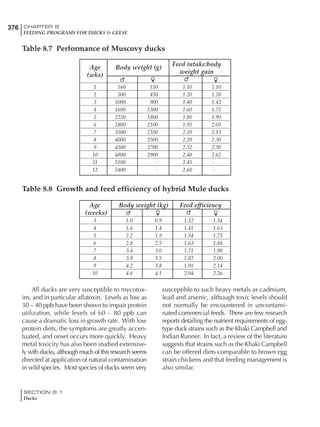
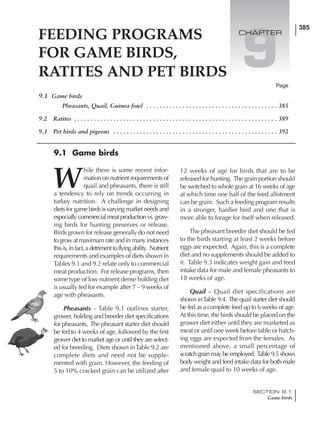
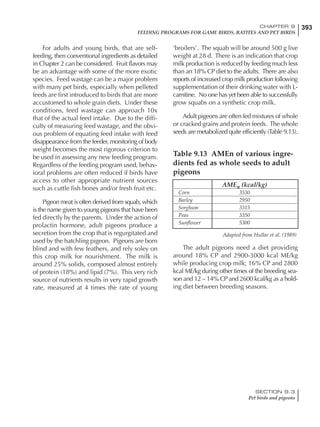
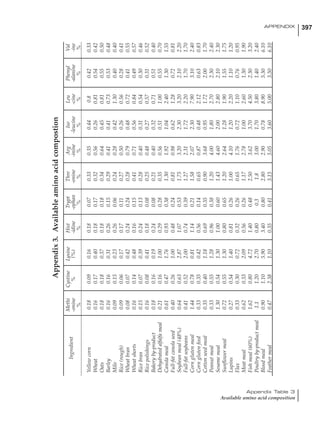
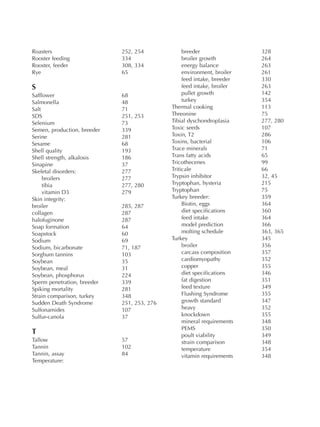
Effective temperature =[ (daytime high temper-
ature x 2) + (nighttime low temperature)]/3
For the above example, the calculation becomes:
[(26 x 2) + 8]/3 = 20ºC
The ‘effective’ temperature becomes 20ºC
rather than 17ºC as calculated by the tradition-
al method. The nighttime low of 8ºC is given less
emphasis because birds get an insulative effect
from sitting and huddling. These birds therefore
need less ‘extra’ heat in order to keep warm than
is predicted from simple thermometer meas-
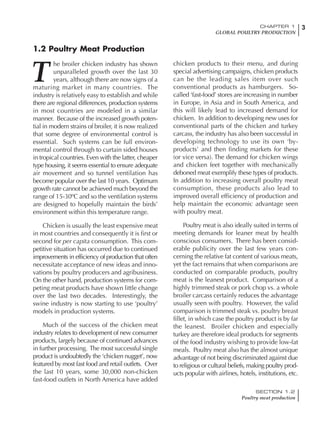
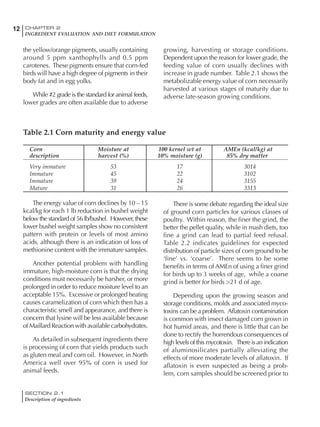
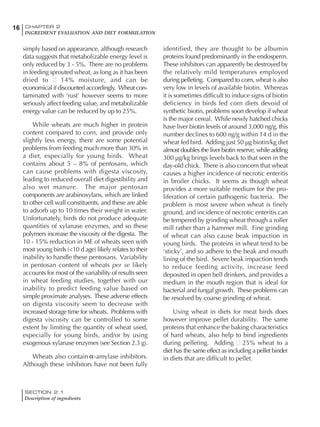
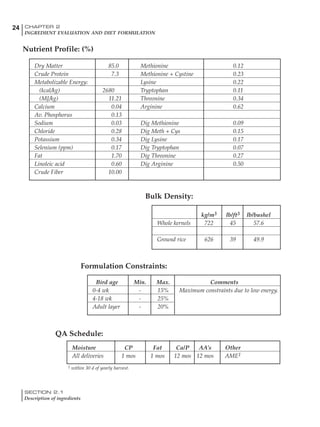
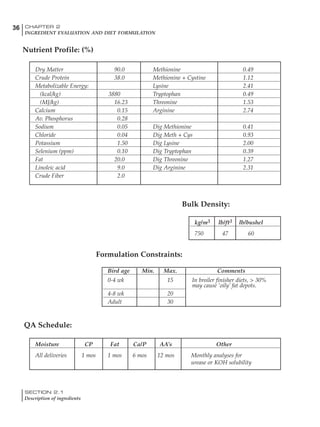
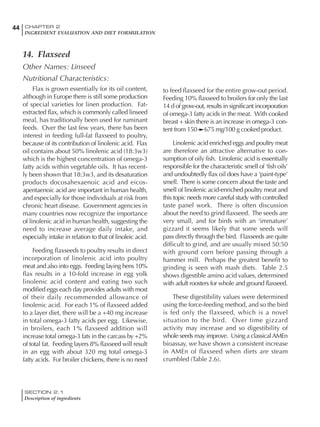
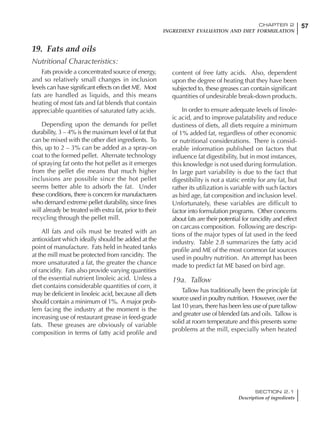
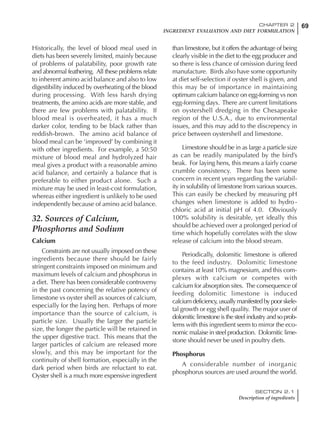
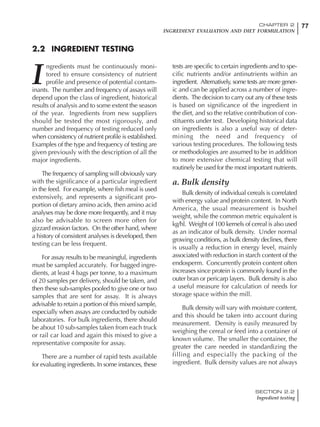
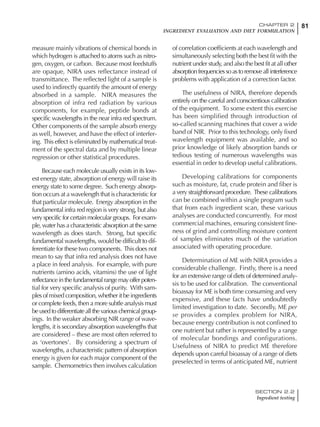
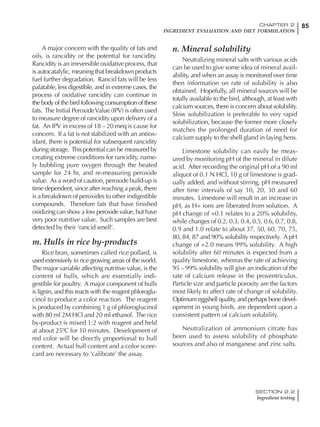
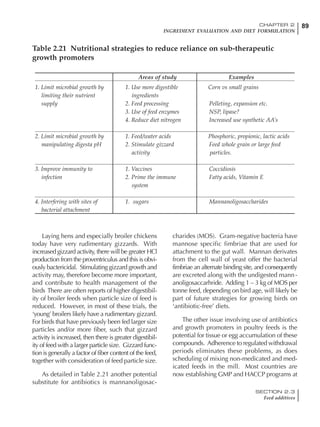
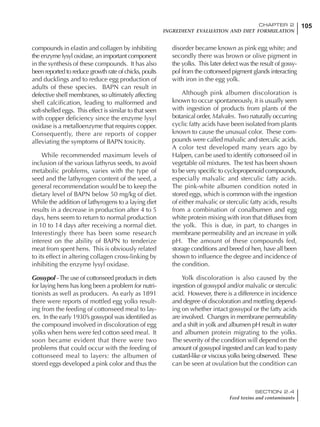
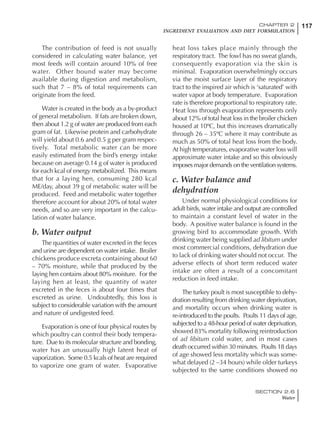
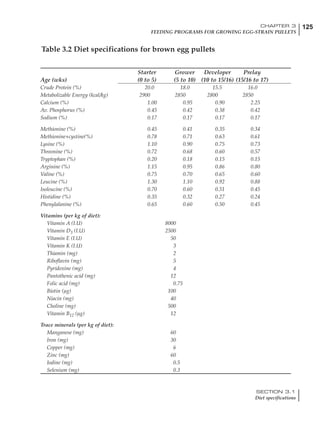
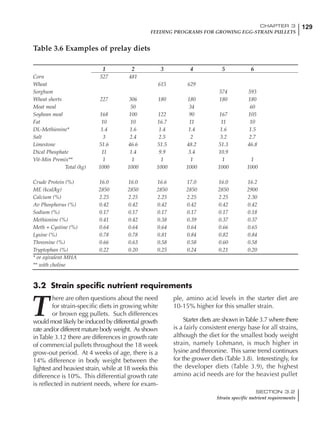
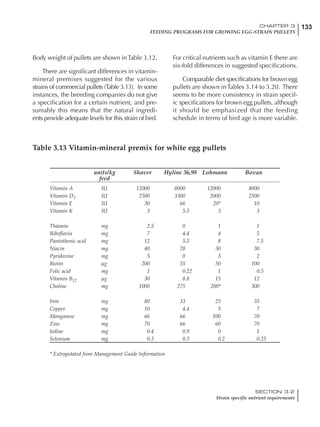
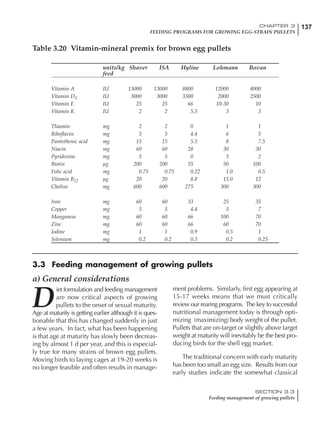
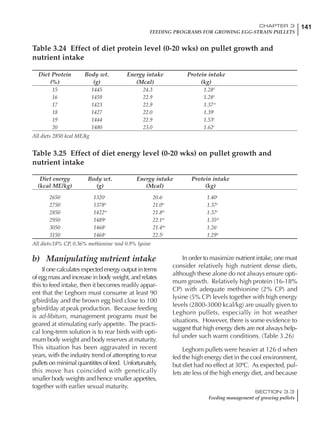
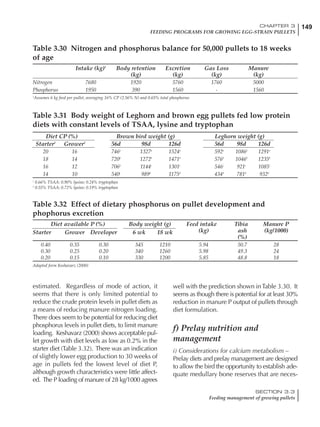
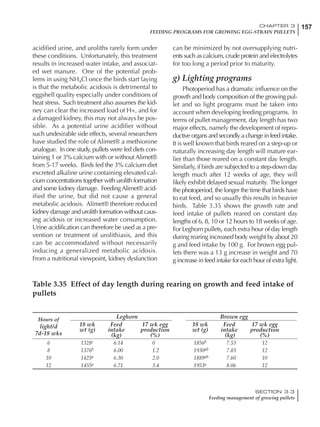
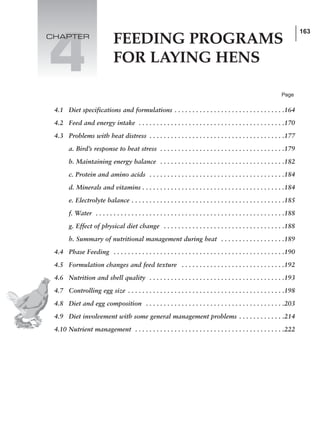
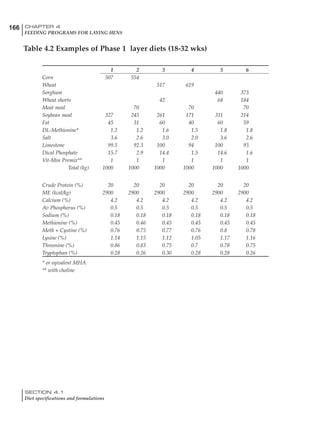
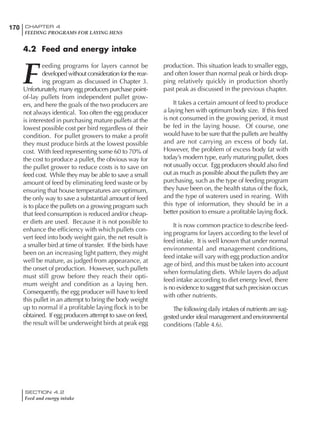
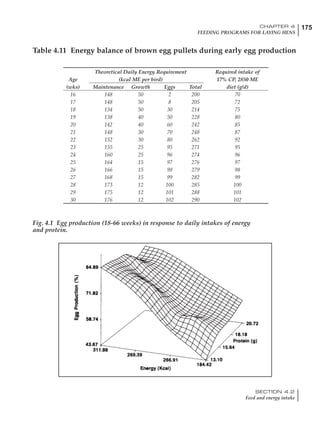
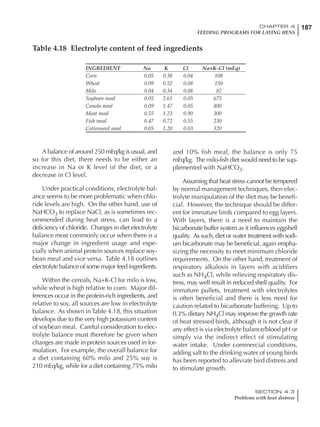
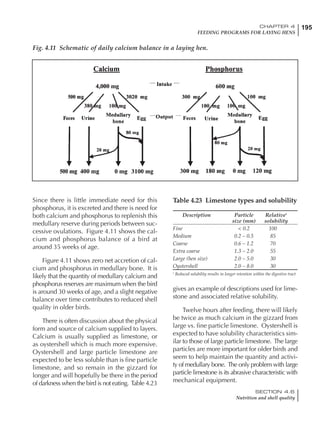
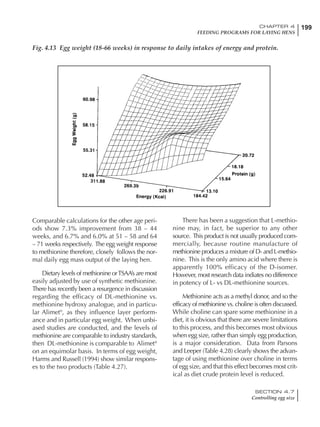
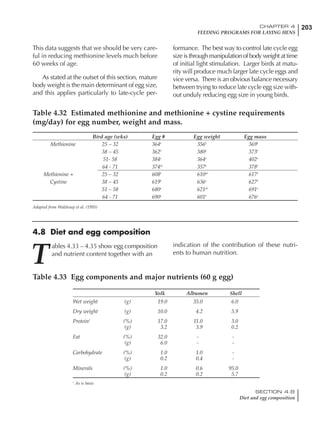
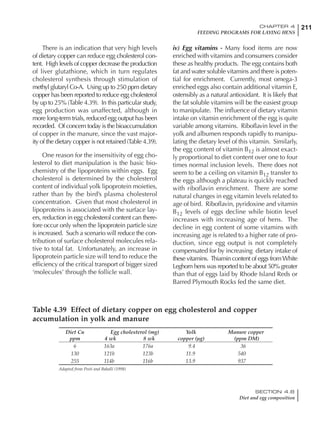
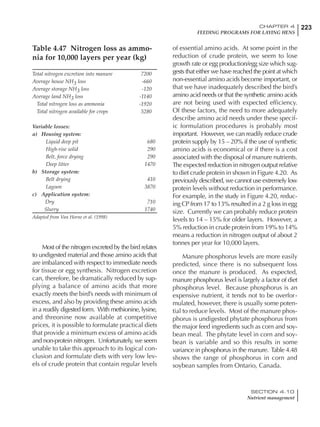
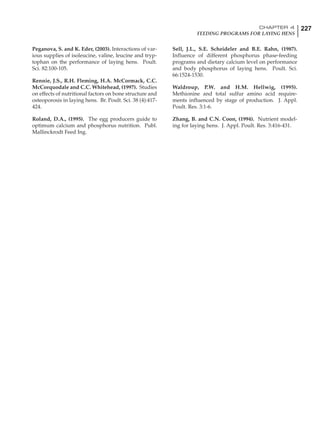
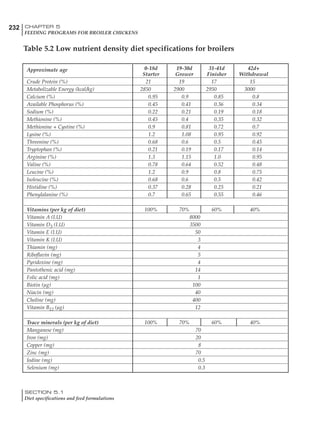
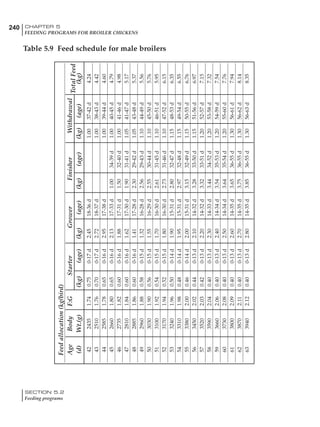
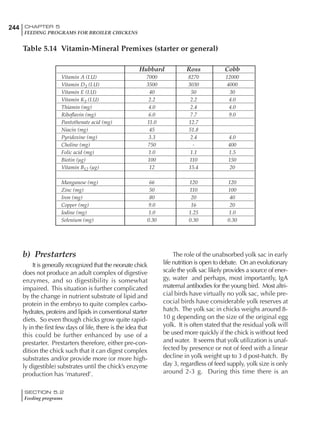
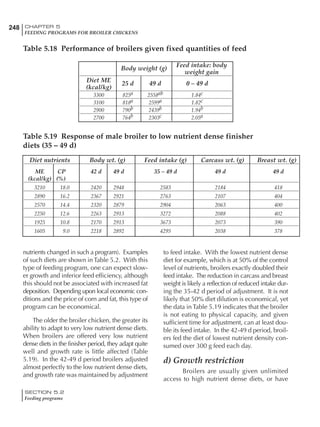
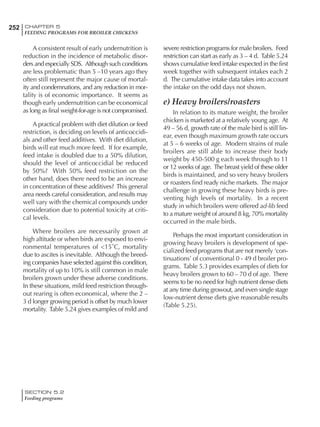
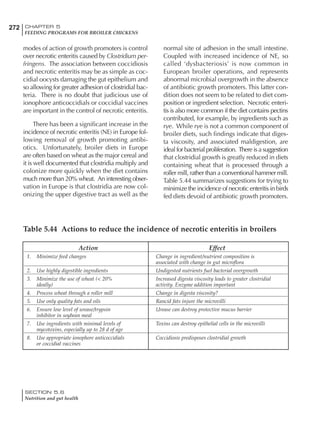
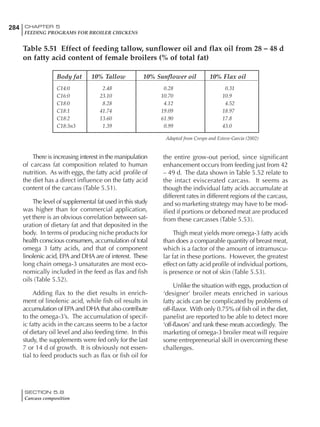
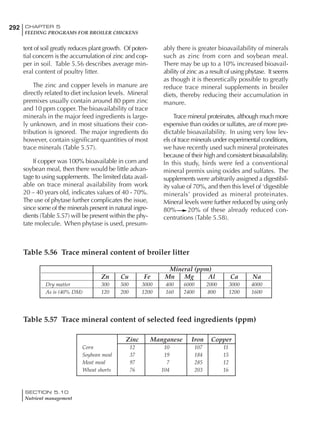
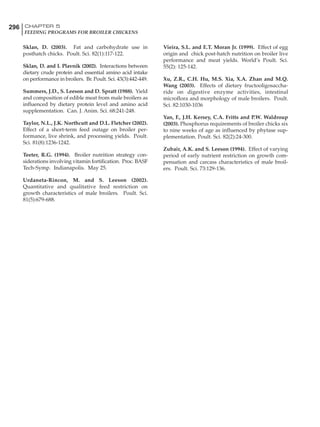
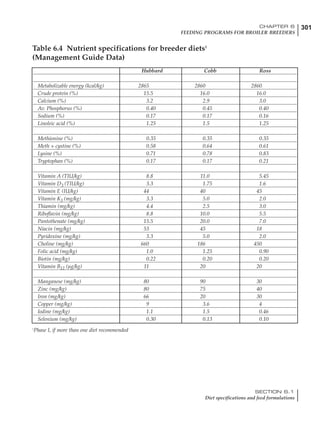
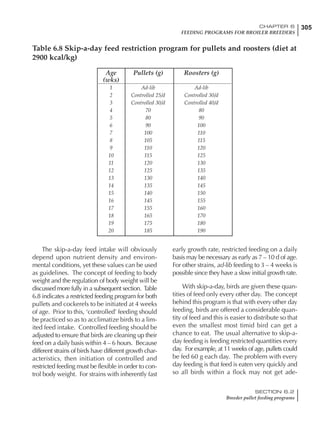
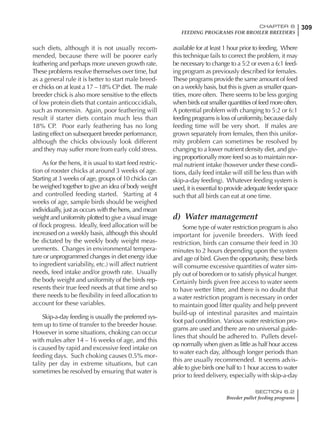
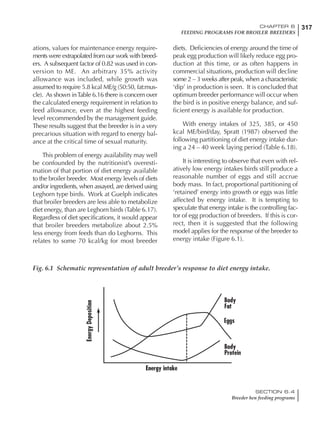
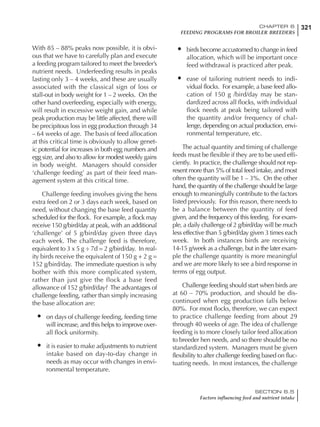
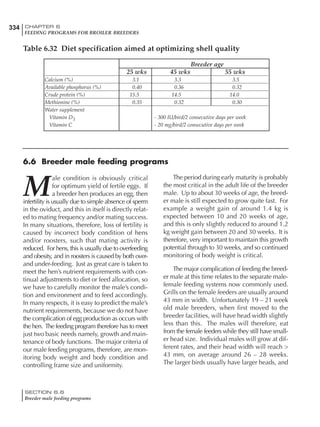
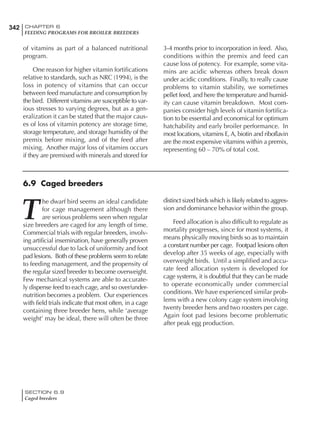
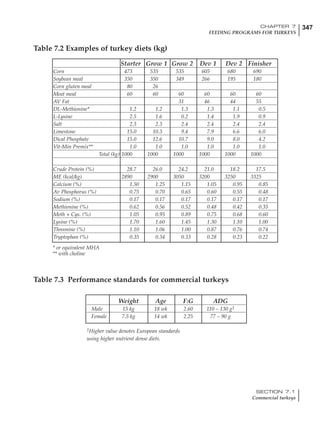
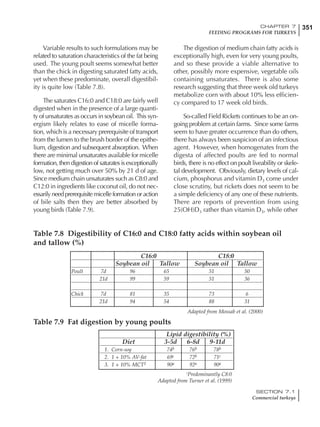
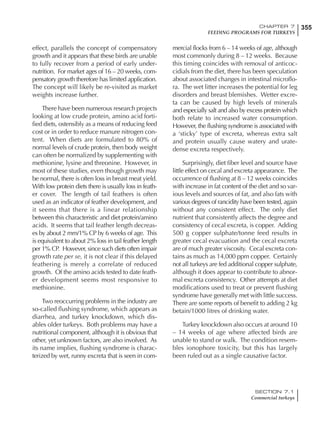
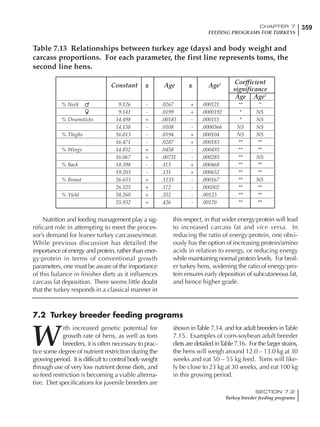
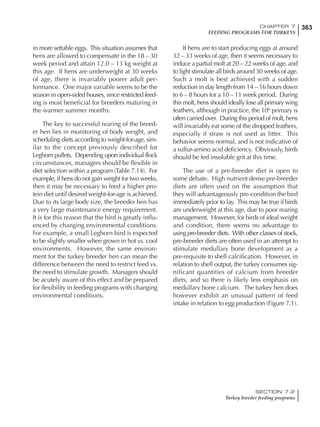
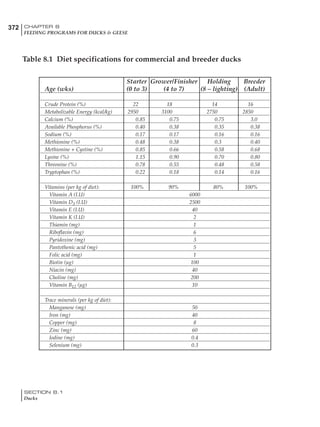
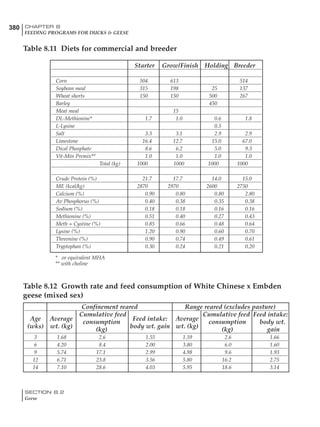
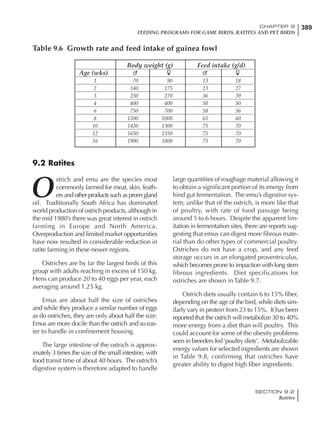
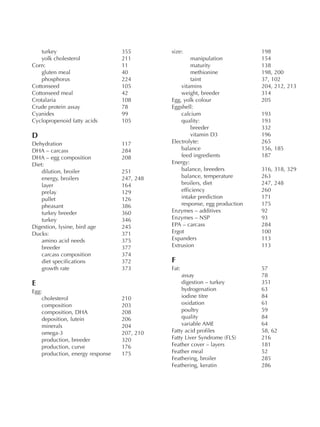
urements. Table 6.28 shows calculations using
this same formula, at various day and night
temperatures. If we assume that 26ºC is an ideal
temperature for breeders then we can calculate
the extra feed needed for maintenance as effec-
tive temperature declines. If a diet provides 2850
kcal ME/kg, a 3 kg breeder will need an extra 1.5
g feed for each 1ºC decline in effective house tem-
perature. Table 6.28 shows such calculated
extra feed needed by breeders kept at various day
and night conditions relative to breeders kept in
an ideal environment of constant 26ºC.
The deleterious influence of a cold night
temperature is therefore not as significant as a
comparable cold temperature during daytime.
With a daytime temperature of 24ºC as an
example, we only have to feed an extra 12 g daily
in order to counteract a chilly night temperature
of 6ºC. Failure to make such an adjustment long
term will mean that the hen will either lose
weight and/or reduce egg output in an attempt
to conserve energy.
Another question often asked is how often
should feed intake be adjusted in order to accom-
modate fluctuating environmental temperatures?
Weather predictions can be notoriously inaccu-
rate, and so day-to-day adjustments seem unwise,
as well as being impractical for the farm staff. The
bird does have a quickly usable store of energy
Table 6.28 Effect of temperature on increased feed allowance relative to 26ºC
standard (gram/hen/day)1
Daytime Nighttime temperature (ºC)
temperature
26 24 22 20 18 16 14 12 10 8 6 4 2 0 -2
(ºC)
26 0 1 2 3 4 5 6 7 8 9 10 11 12 13 14
24 4 5 6 7 8 9 10 11 12 13 14 15 16
22 7 8 9 10 11 12 13 14 15 16 17 18
20 10 11 12 13 14 15 16 17 18 19 20
18 13 14 15 16 17 18 19 20 21 22
16 16 17 18 19 20 21 22 23 24
14 19 20 21 22 23 24 25 26
12 22 23 24 25 26 27 28
10 25 26 27 28 29 30
8 28 29 30 31 32
6 30 31 32 33
1
Feed @ 2850 kcal ME/kg](https://image.slidesharecdn.com/commercialpoultrynutrition-130530001831-phpapp02/85/Commercial-poultry-nutritio-337-320.jpg)


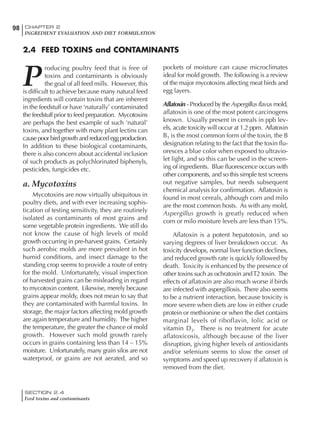
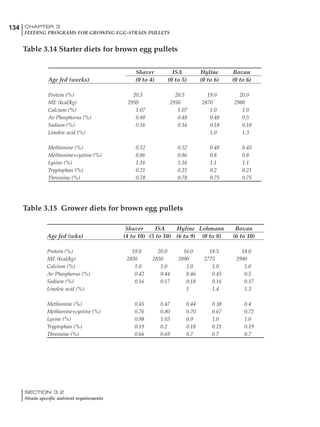
This document provides an overview of global poultry production trends. It notes that poultry meat and egg production have increased the most compared to other animal sectors. Poultry is well positioned to meet growing global demand for protein as the world's population increases. Key factors that will influence future poultry production include population growth and urbanization, especially in developing countries, as well as concerns about food safety and nutrition. Poultry production systems have improved efficiency and will continue playing an important role in global food security.


![OSTA TRAINING-introduction [Autosaved].pptx](https://cdn.slidesharecdn.com/ss_thumbnails/ostatraining-introductionautosaved-240507111126-2f0d1553-thumbnail.jpg?width=640&height=640&fit=bounds)