Downloaded 26 times


![Discriminant Analysis
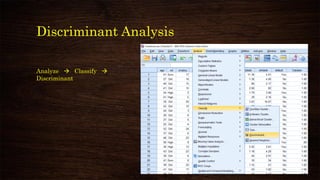
✓ Grouping variable –
Categorical response
variable
✓ Define Range – As per
number of categories
[see coding in variable
view]
✓ Independents – Metric
predictors
✓ How to choose
predictors –
✓ Domain knowledge
✓ Previous research
✓ EDA
✓ Step-wise](https://image.slidesharecdn.com/discriminantanalysisusingspss-210314044750/85/Discriminant-analysis-using-spss-15-320.jpg)
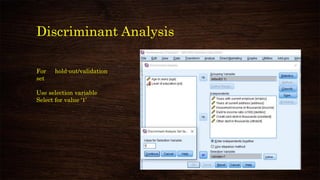

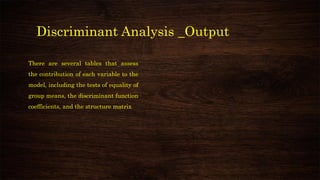


This document provides an overview and agenda for a presentation on multivariate analysis and discriminant analysis using SPSS. It introduces the presenter, Dr. Nisha Arora, and lists her areas of expertise including statistics, machine learning, and teaching online courses in programs like R and Python. The agenda outlines concepts in discriminant analysis and how to perform it in SPSS, including data preparation, assumptions, interpretation of outputs, and ways to improve the analysis model.