Download to read offline

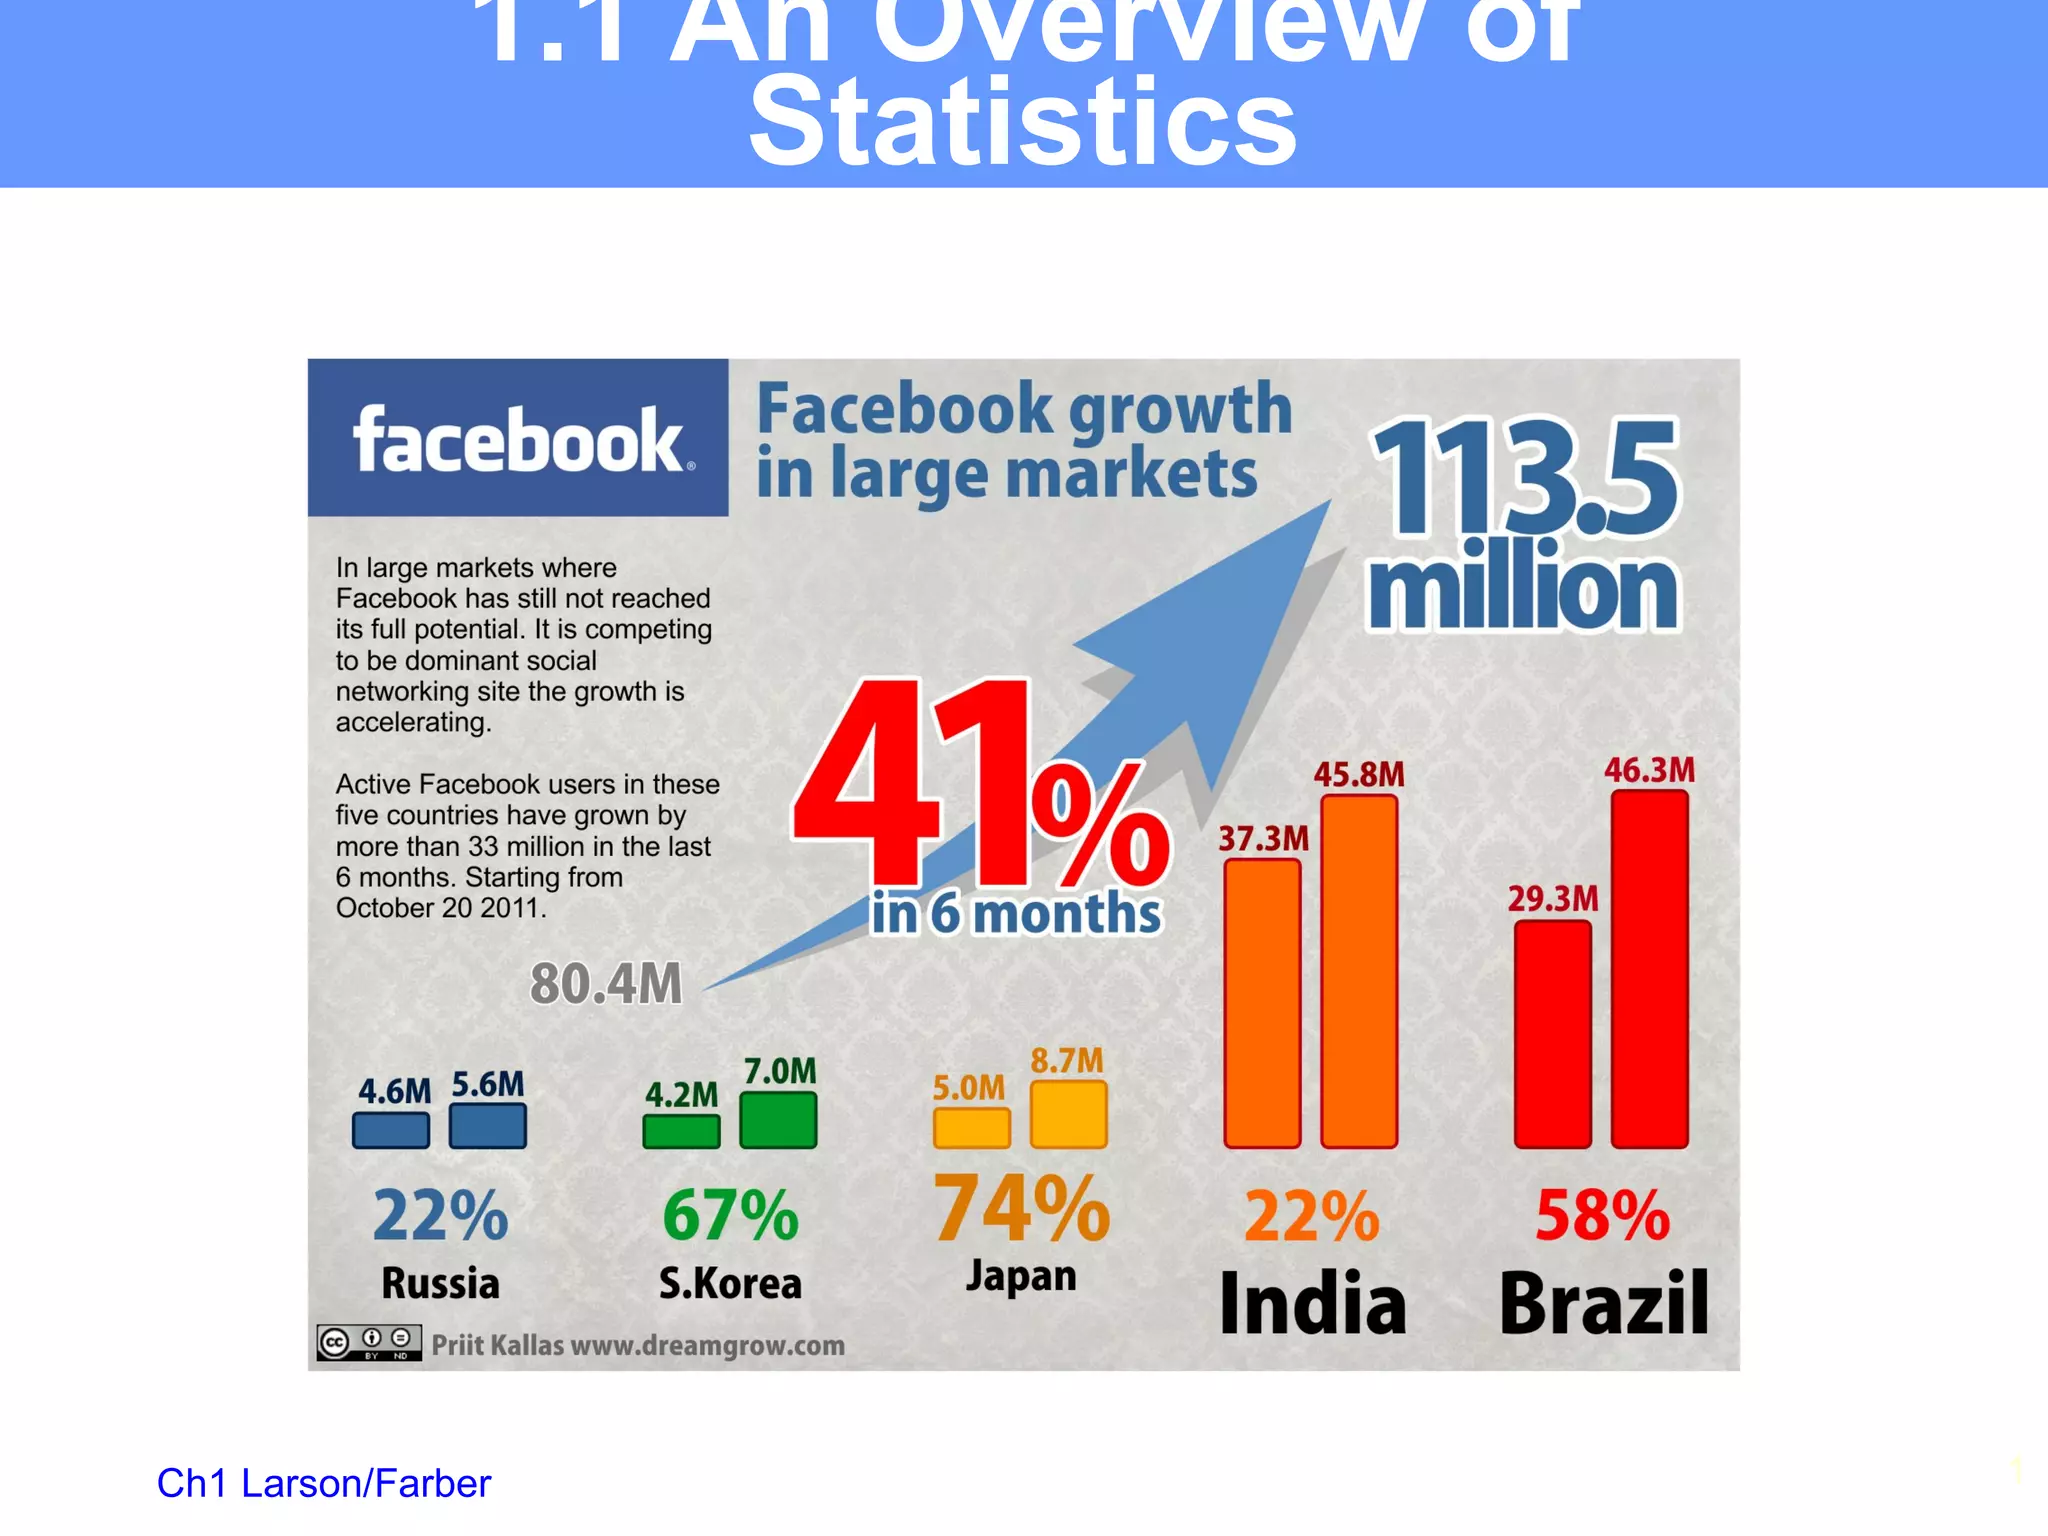


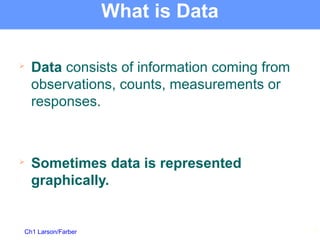


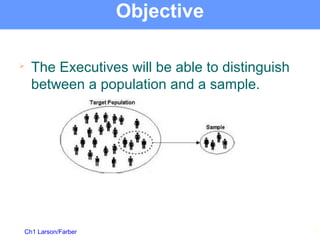
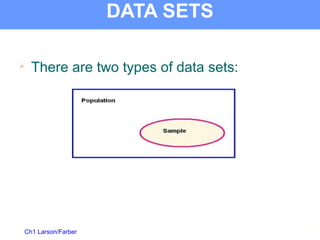
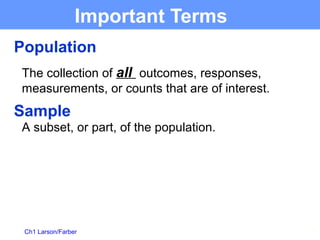
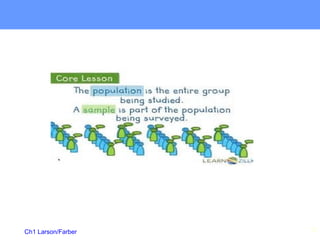


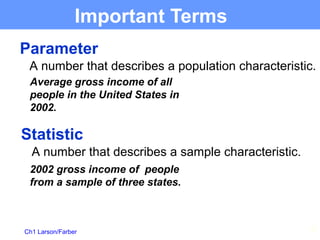


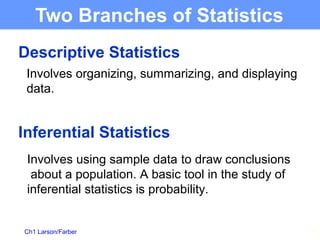
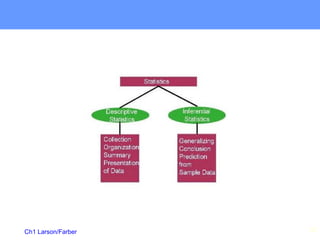

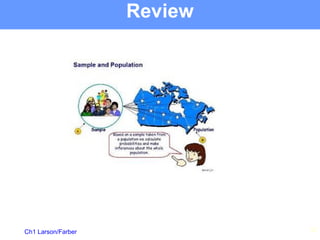


This document provides an overview of statistics. It defines statistics as the science of collecting, organizing, analyzing, and interpreting data to make decisions. There are two main types of data: populations, which are all possible outcomes, and samples, which are subsets of populations. The document distinguishes between parameters, which describe population characteristics, and statistics, which describe sample characteristics. Finally, it outlines the two branches of statistics: descriptive statistics, which involves summarizing and displaying data, and inferential statistics, which uses samples to draw conclusions about populations.