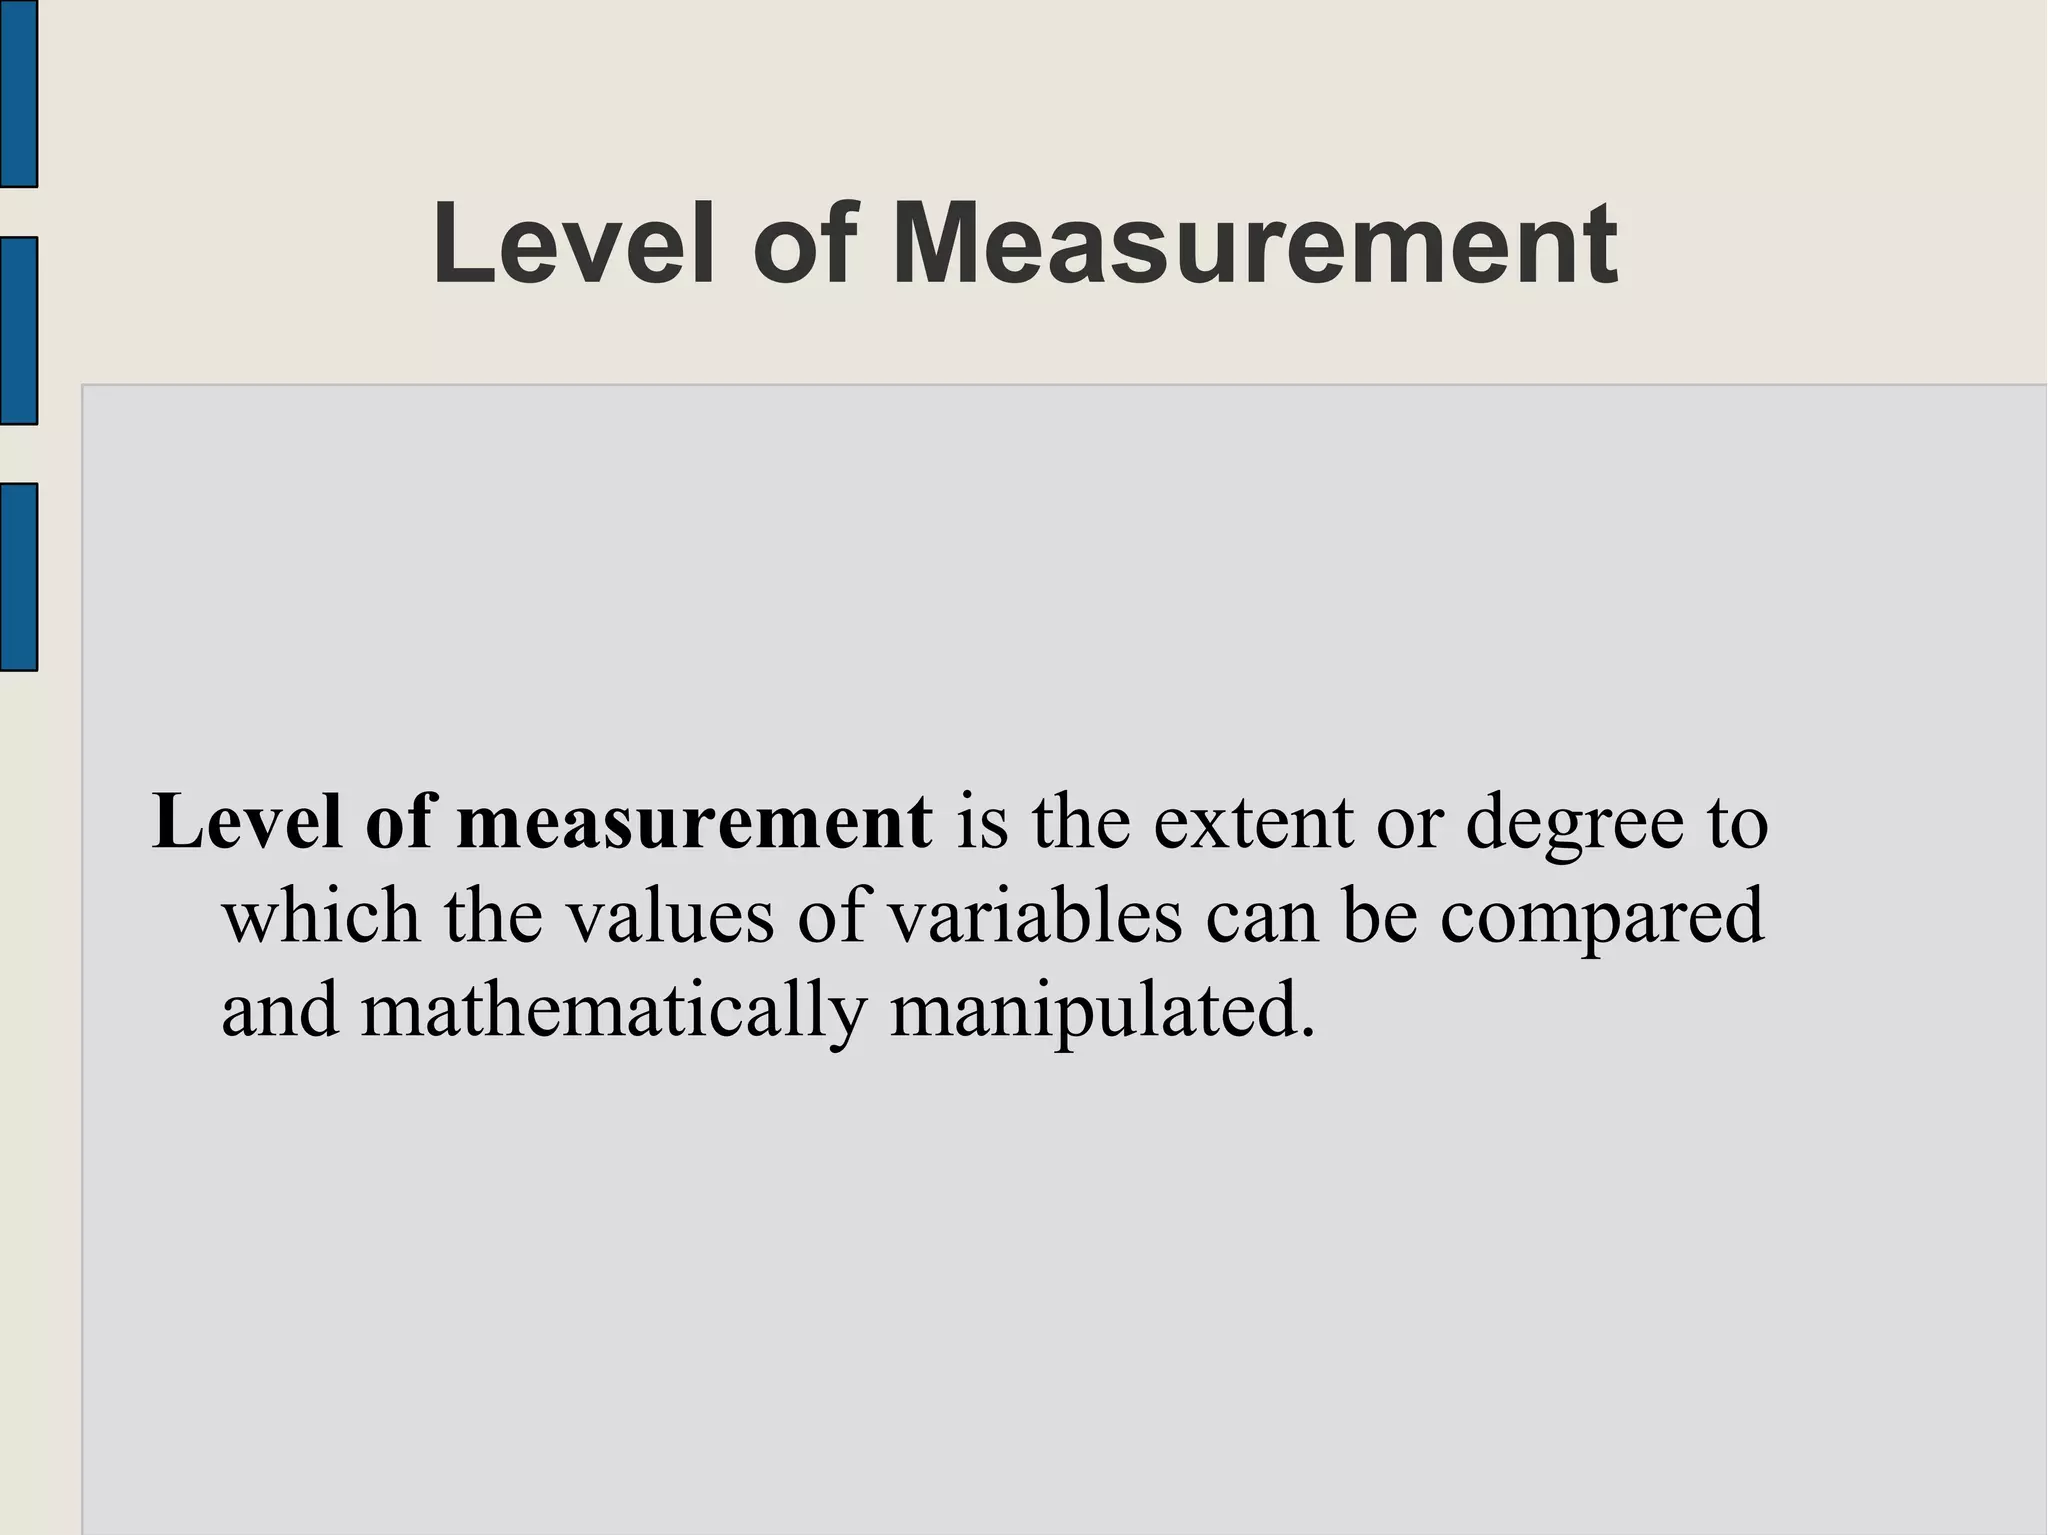
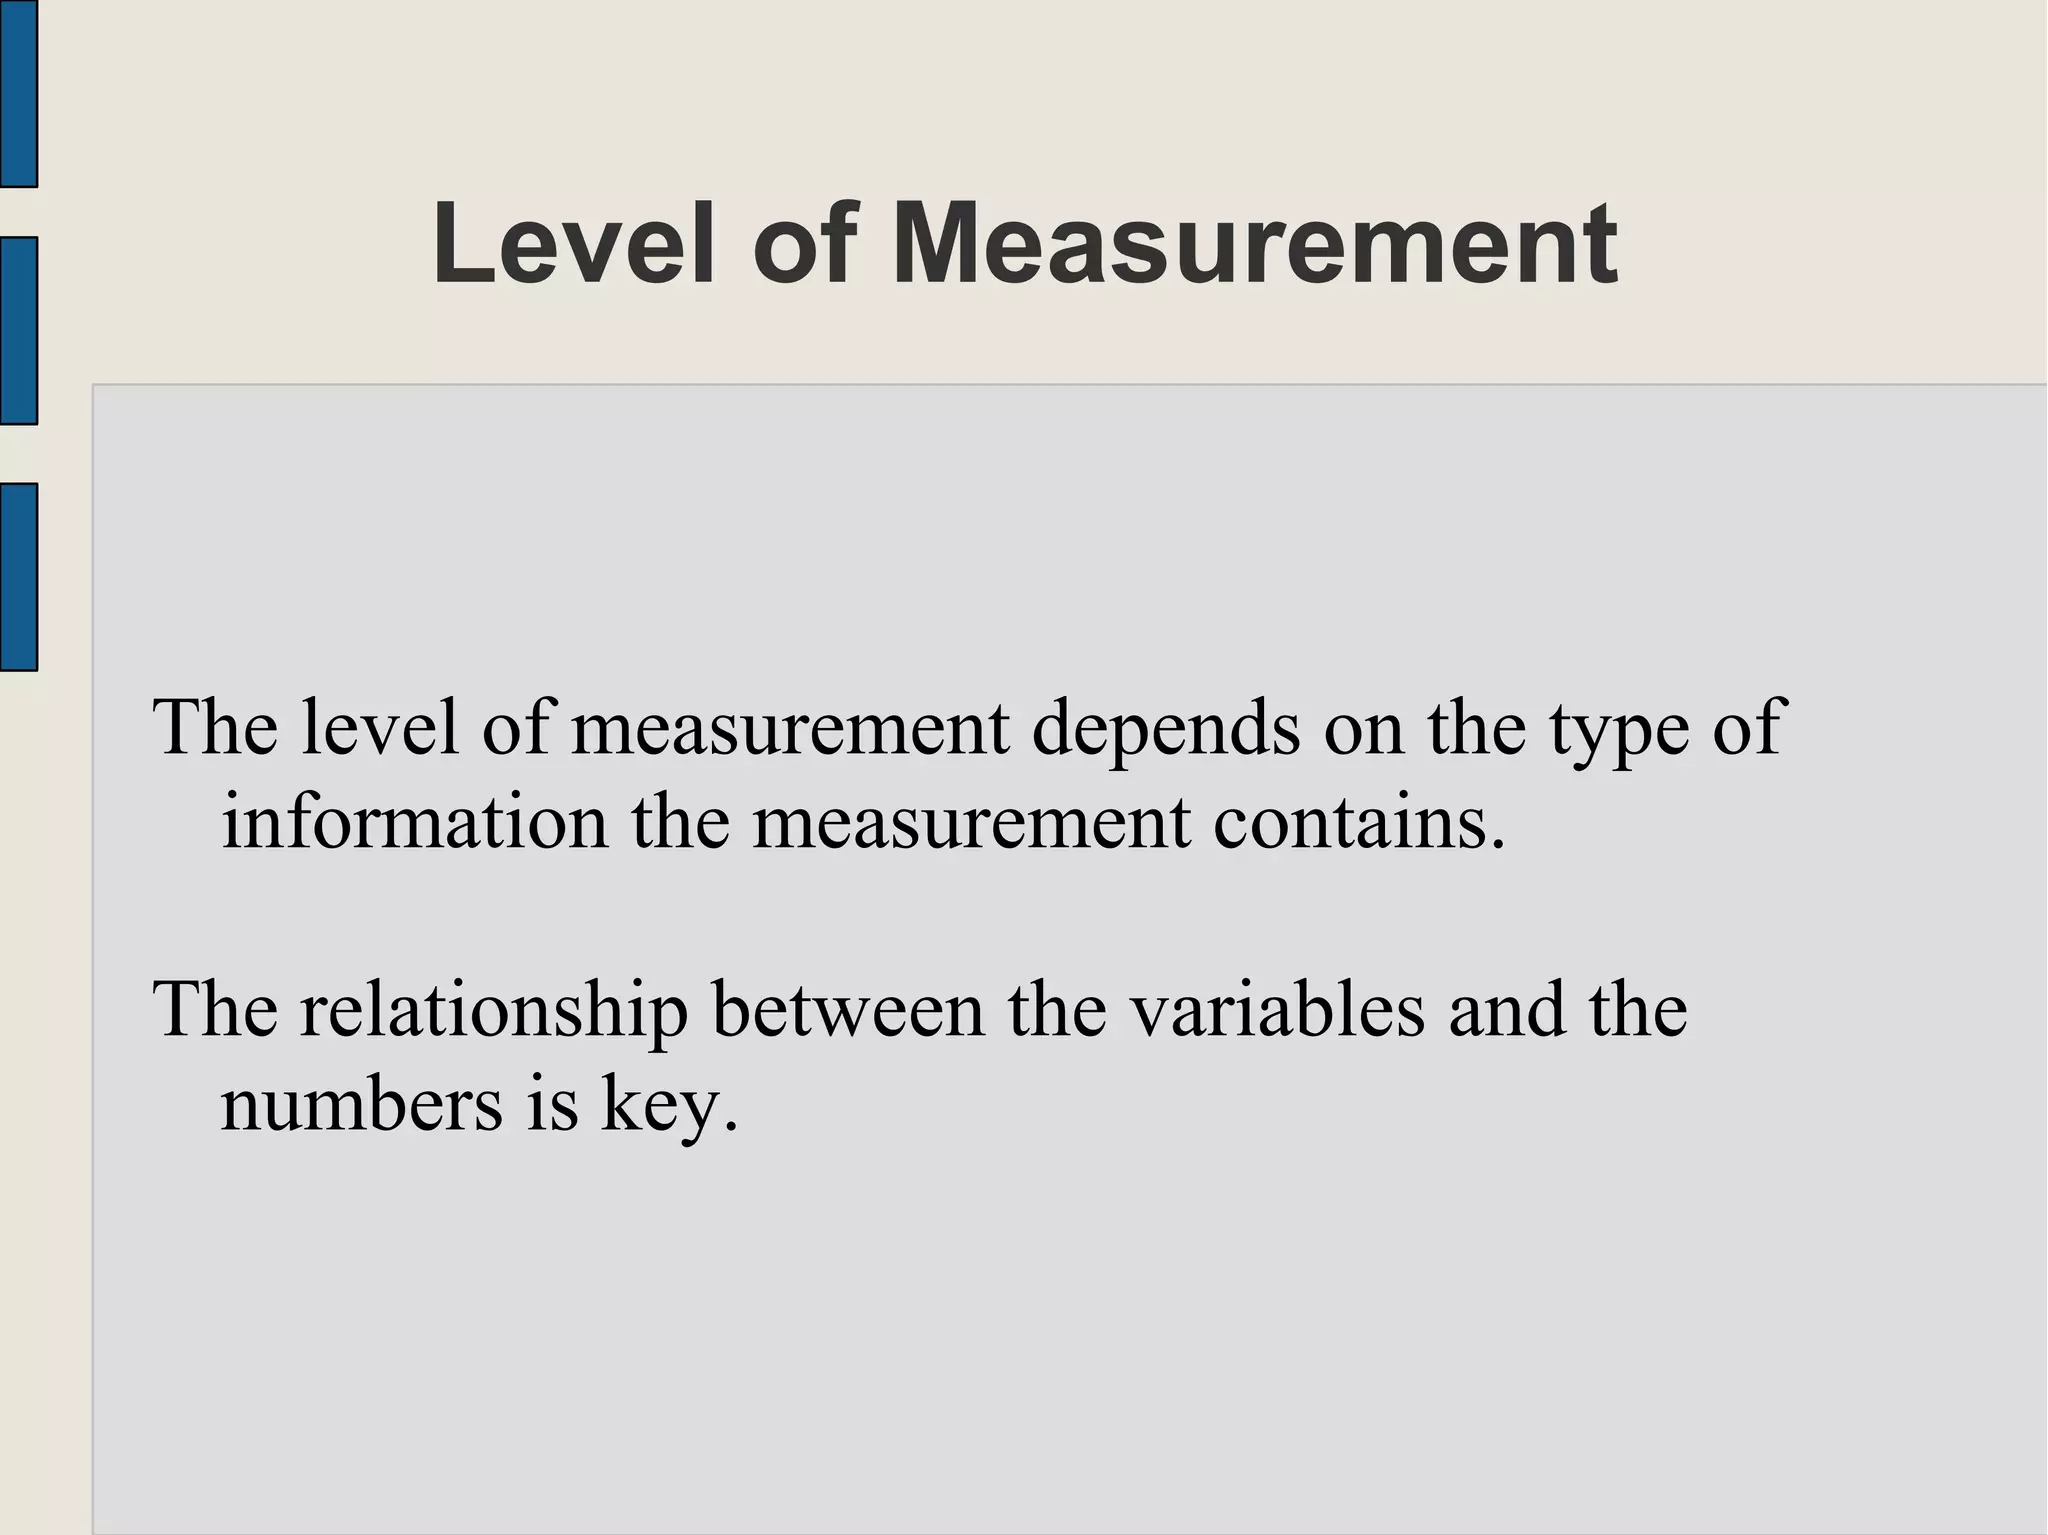
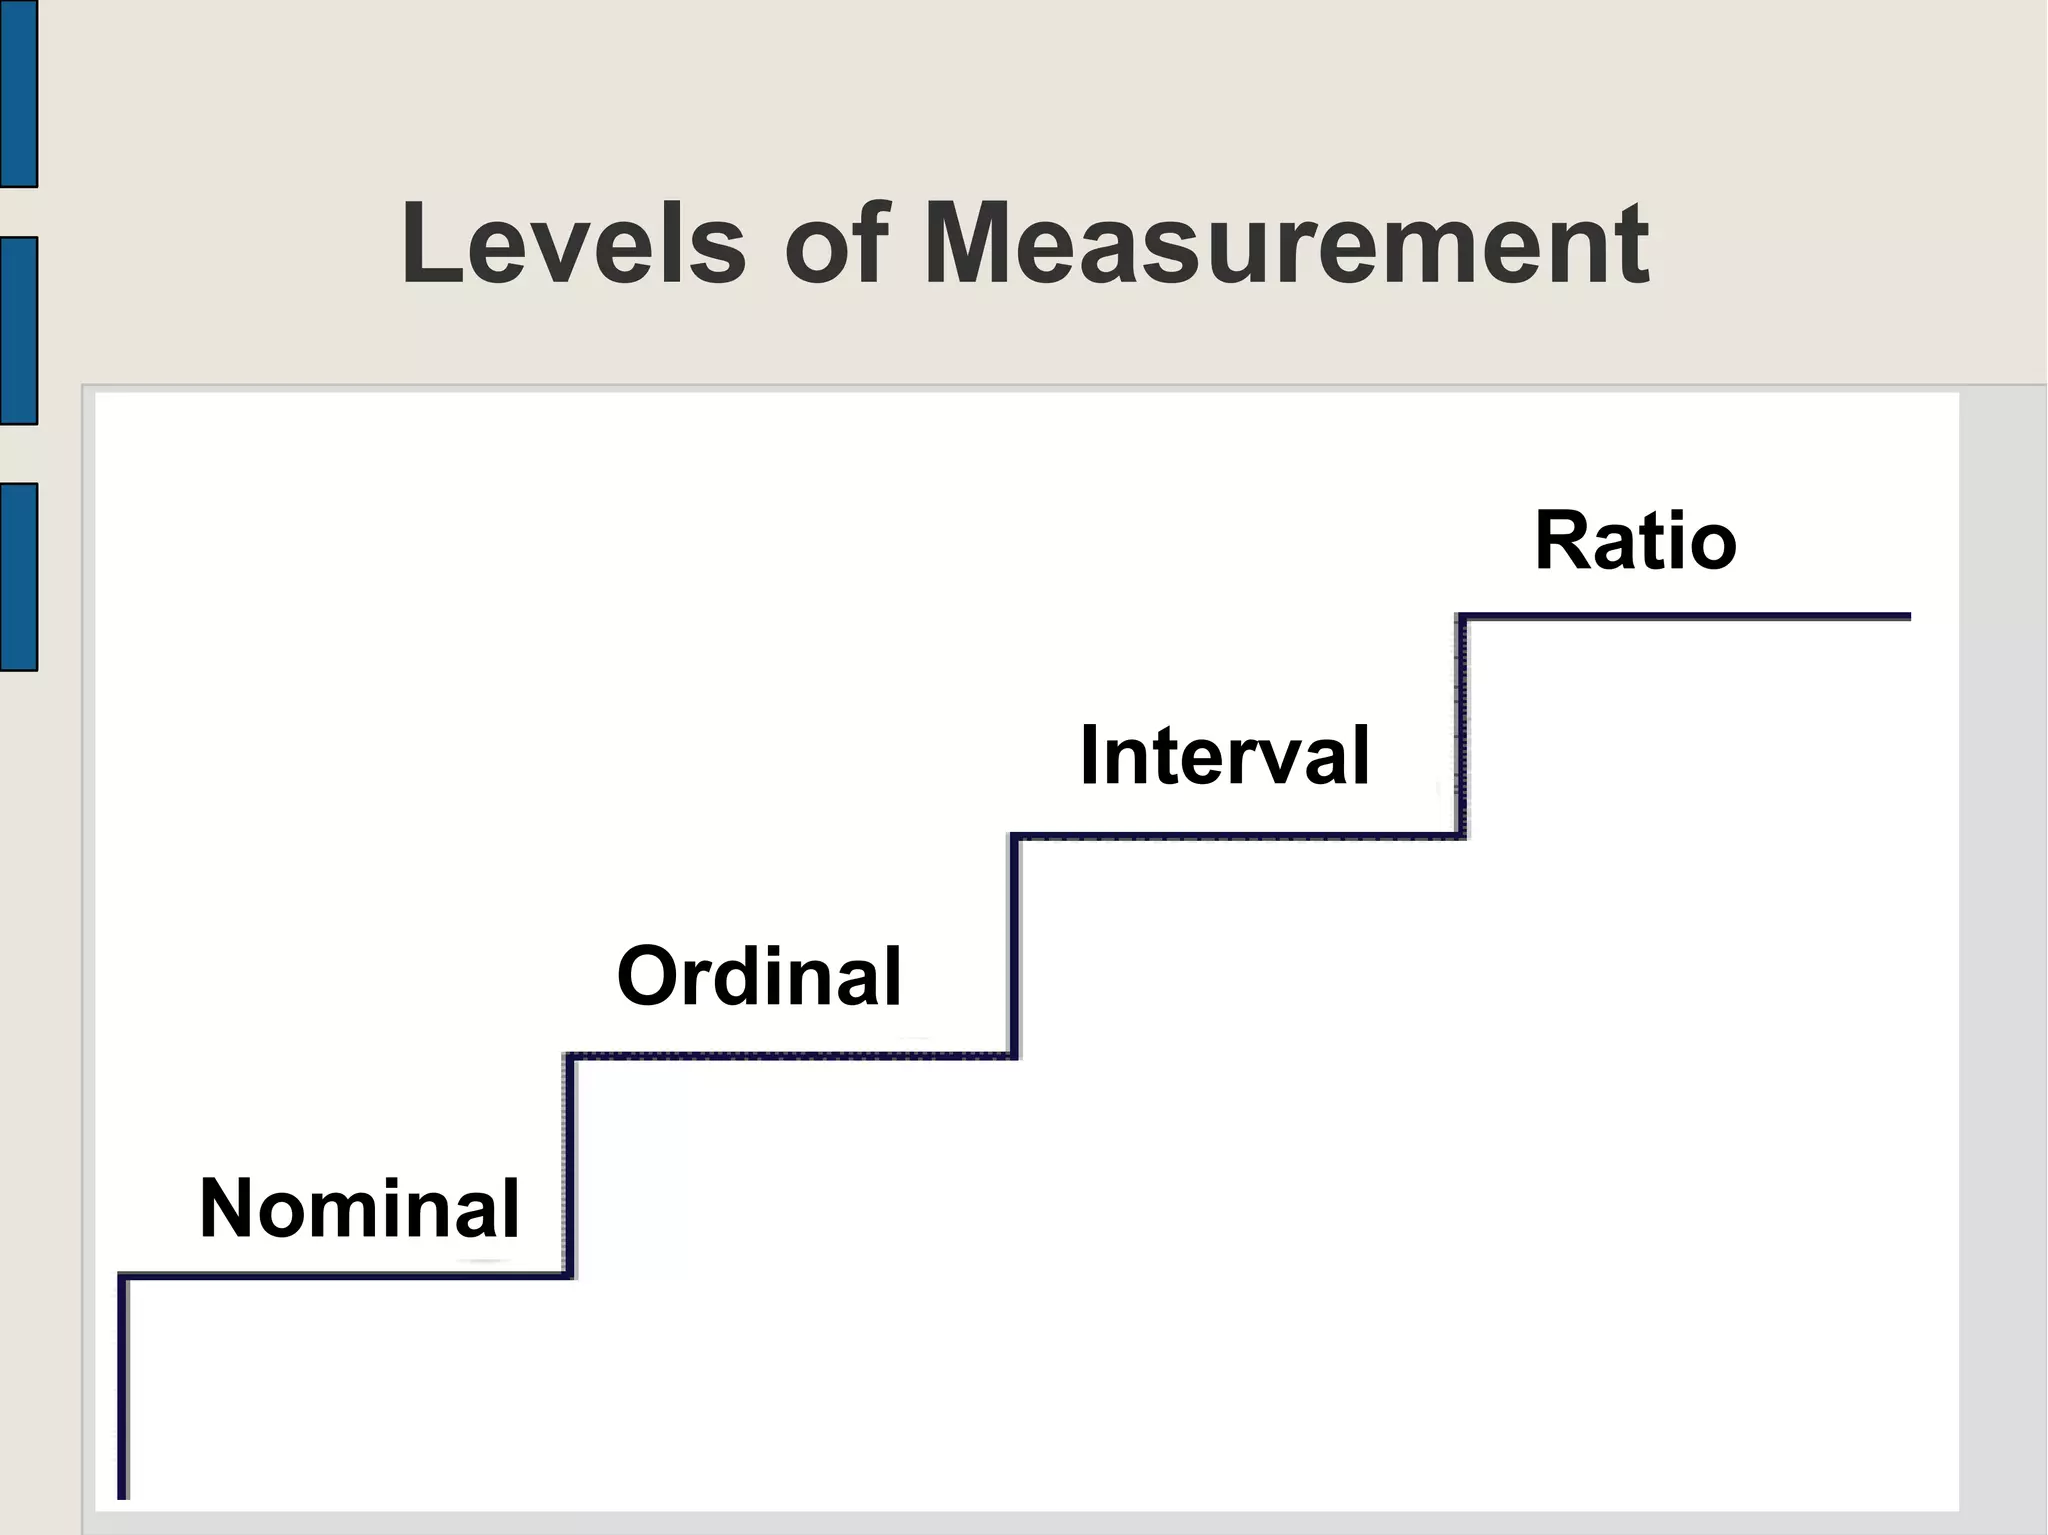
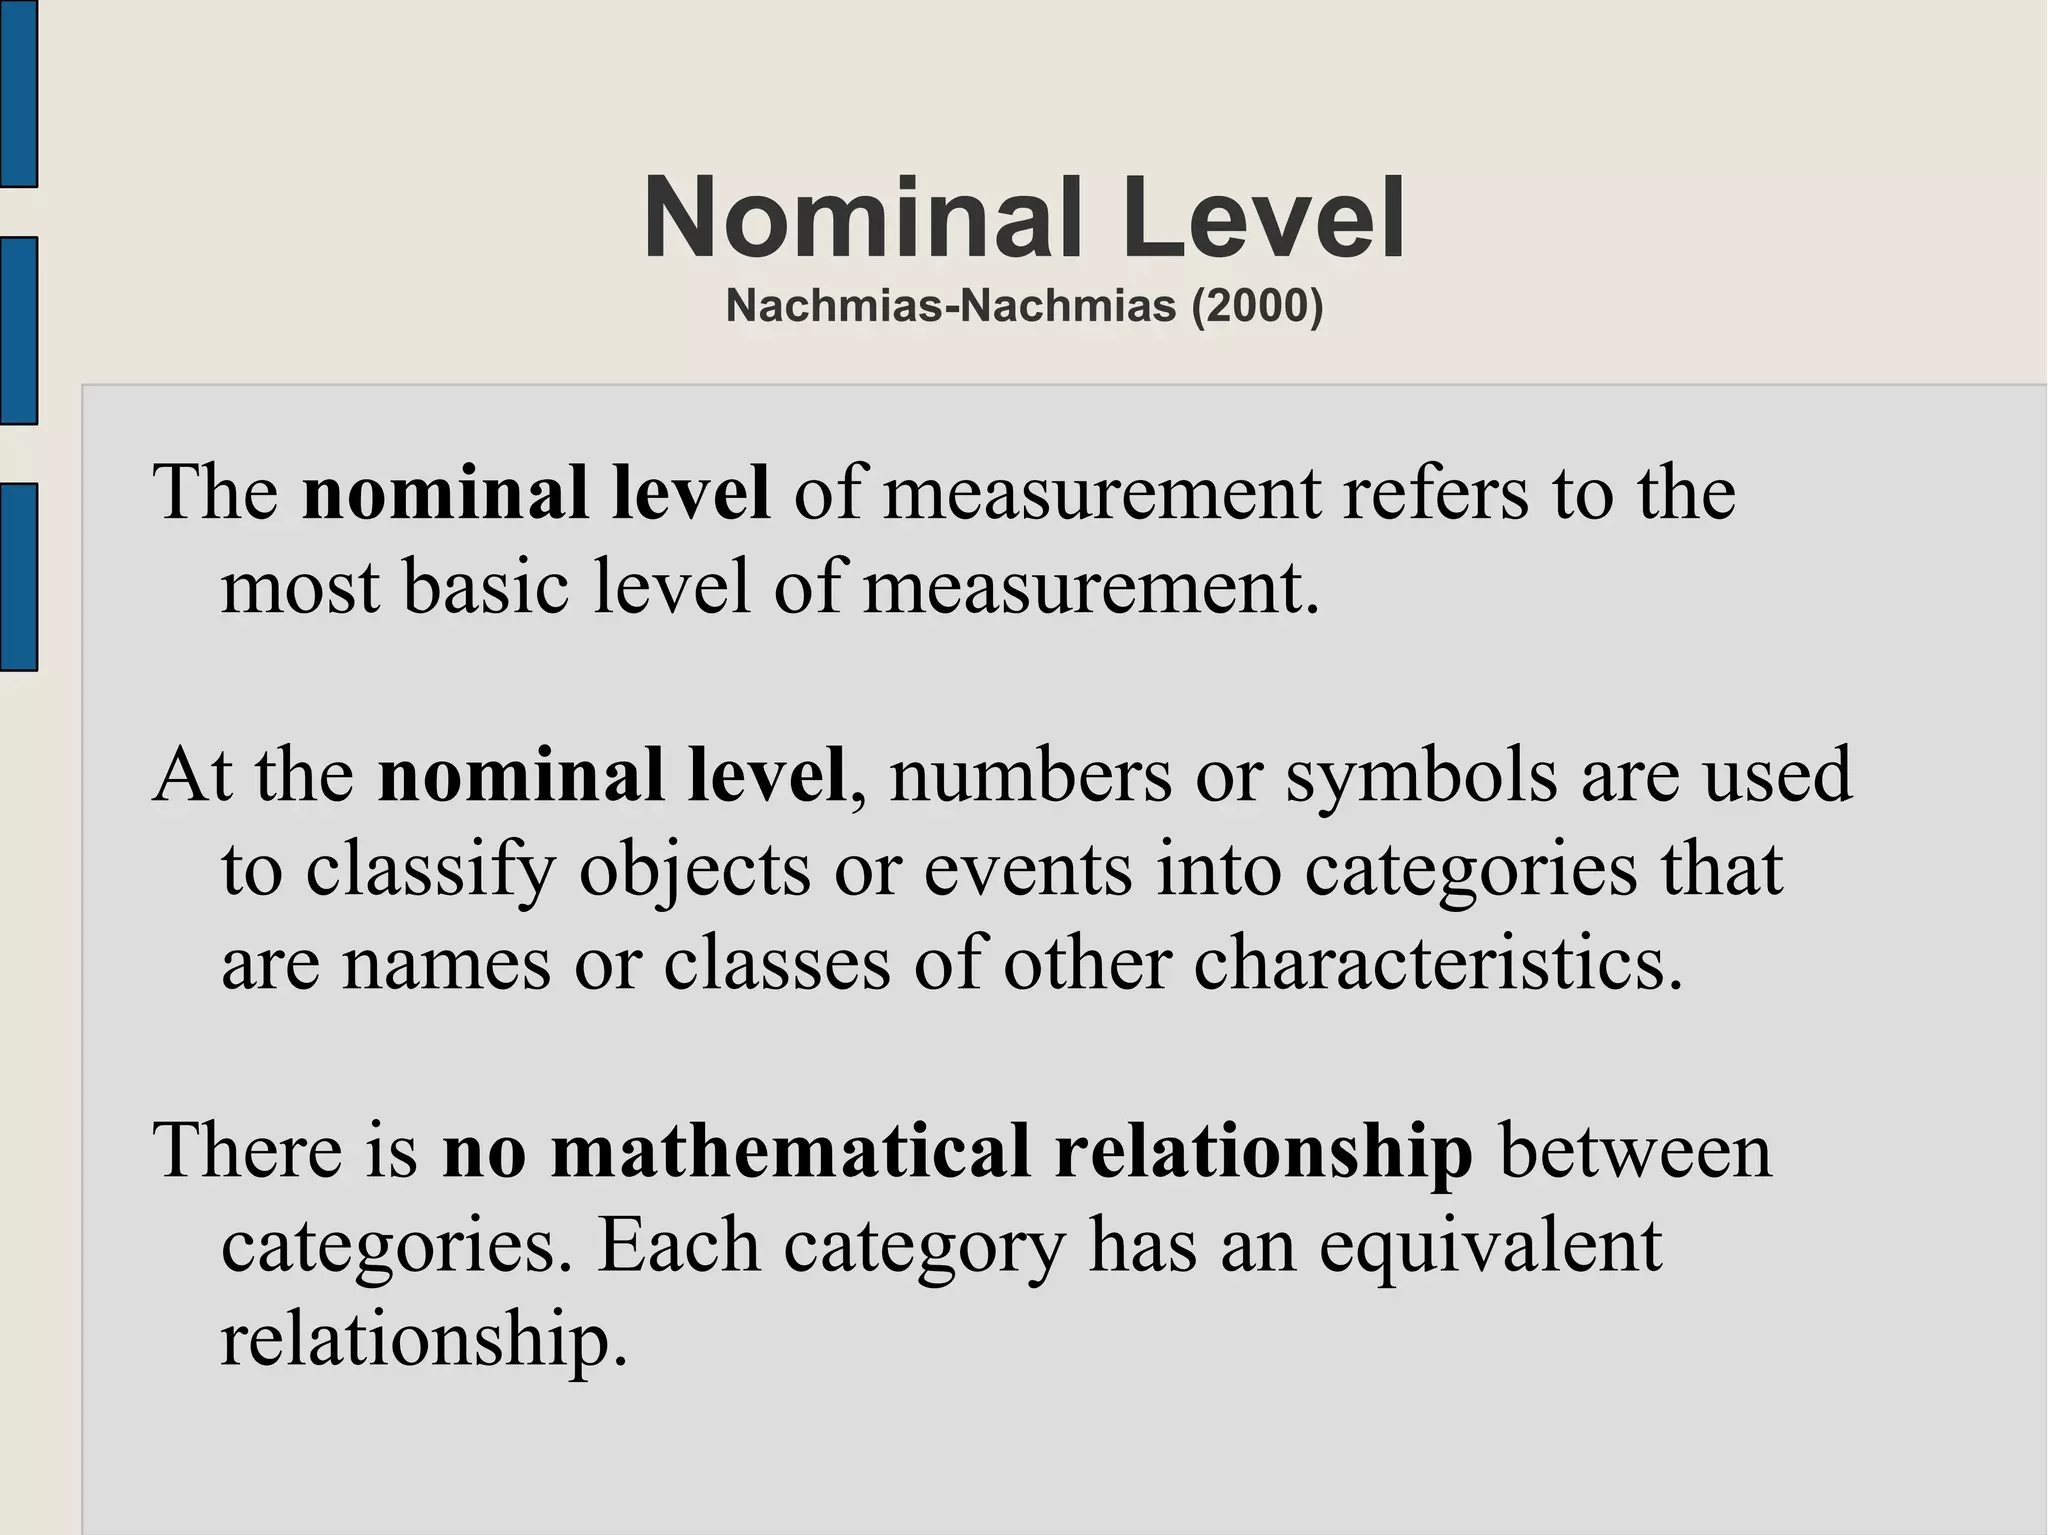
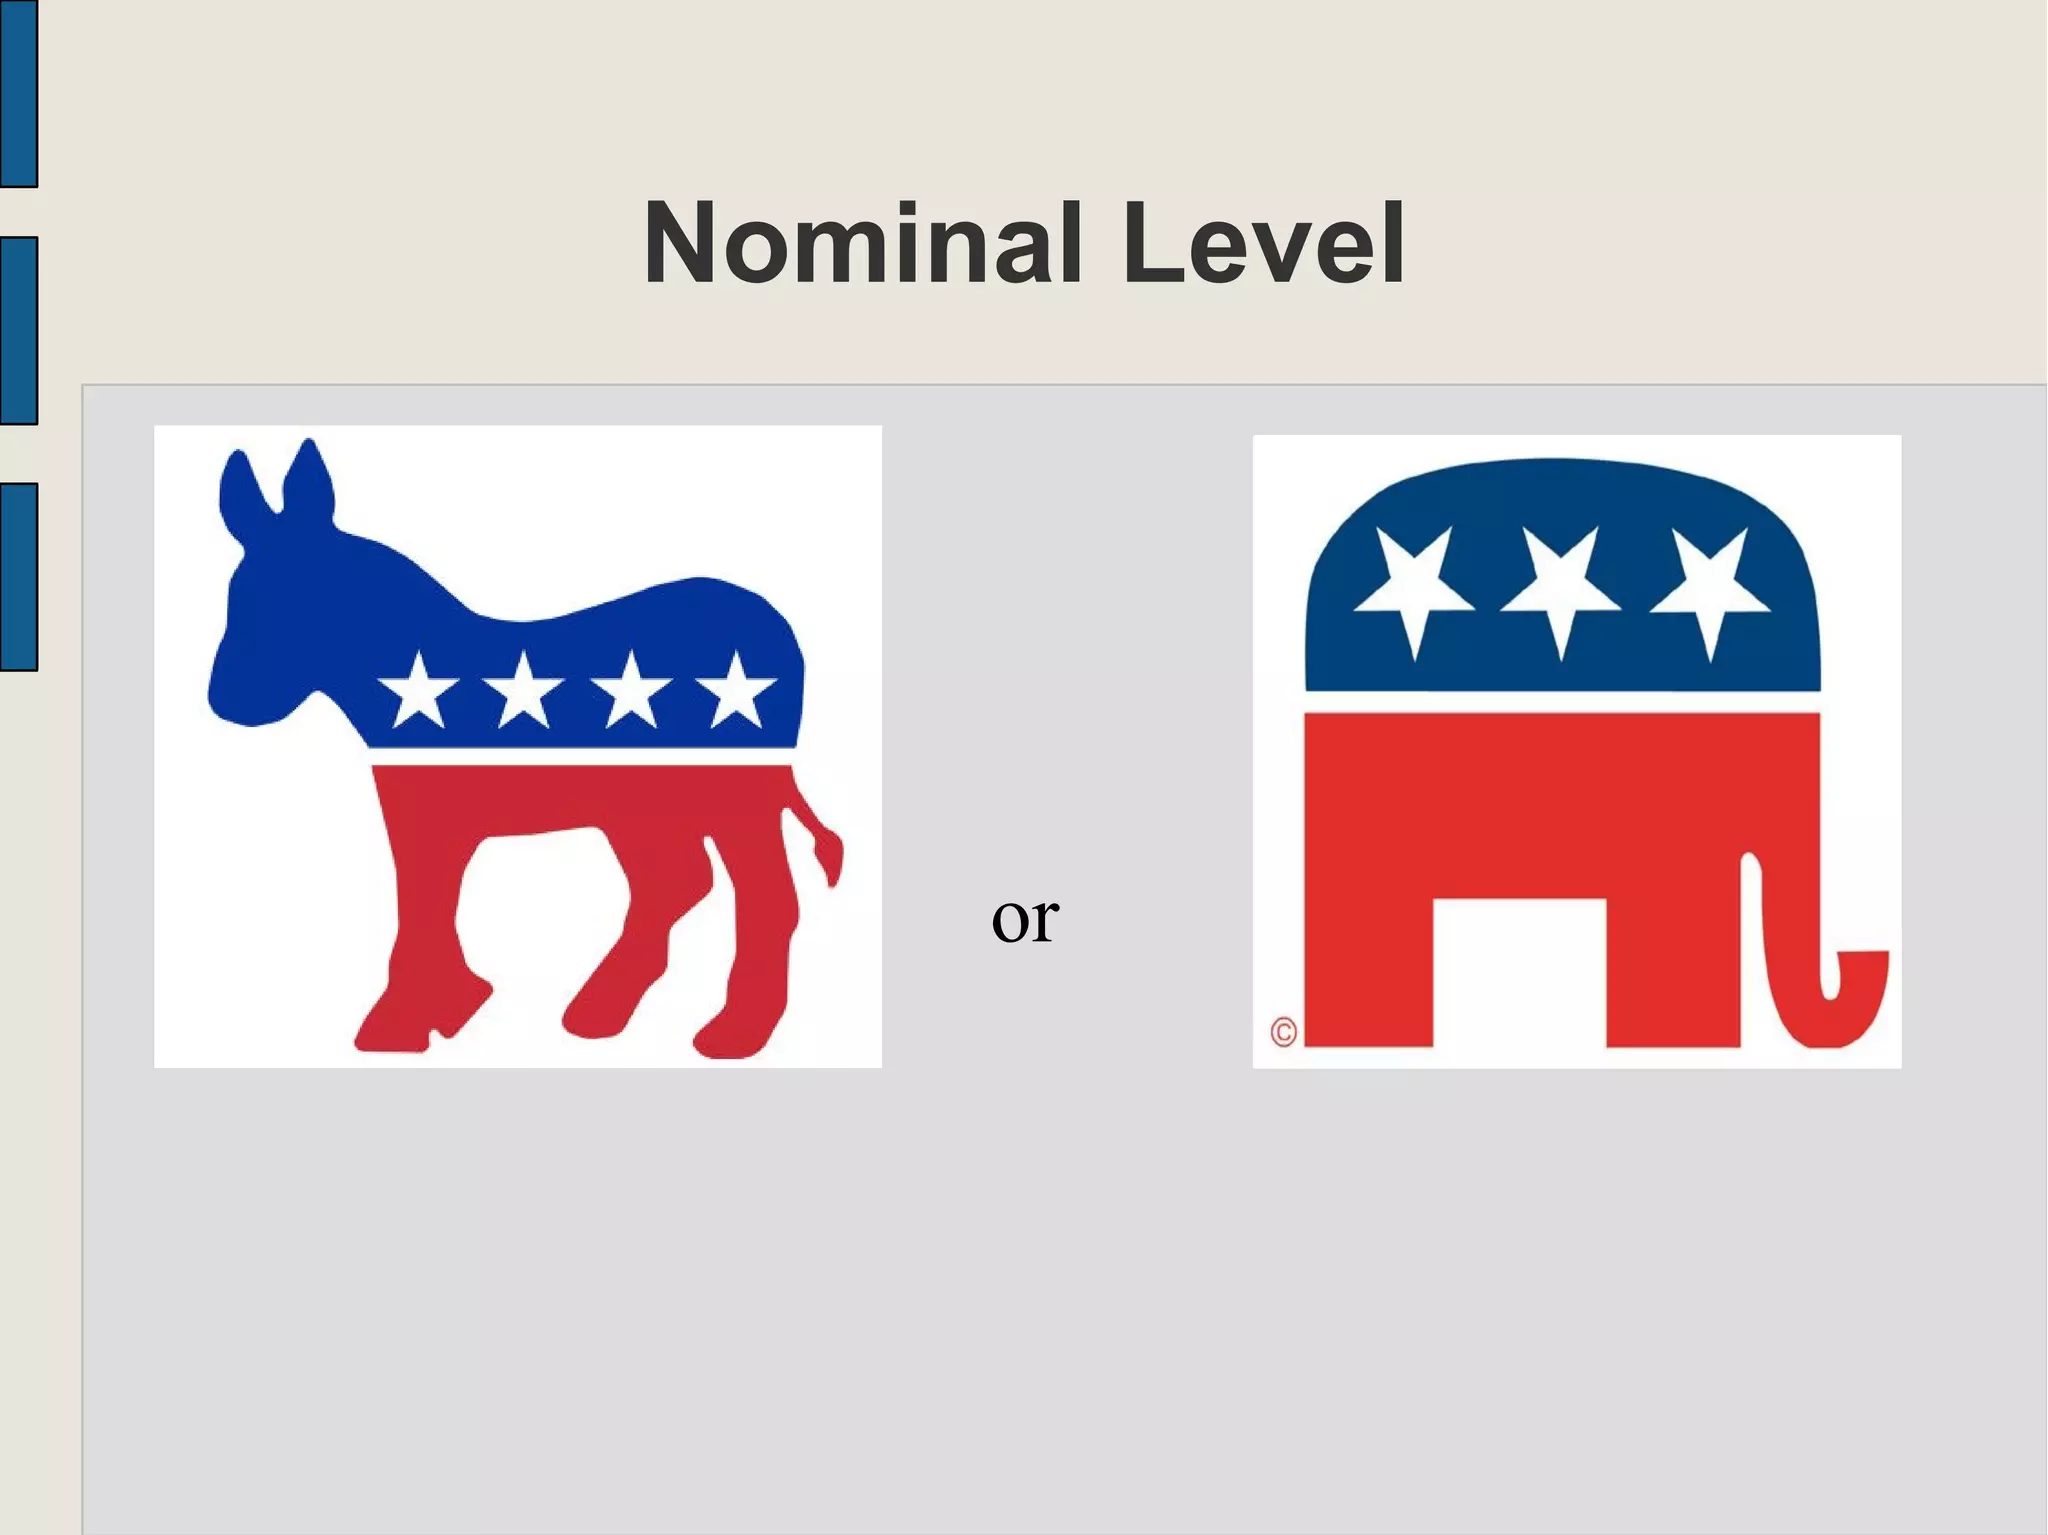
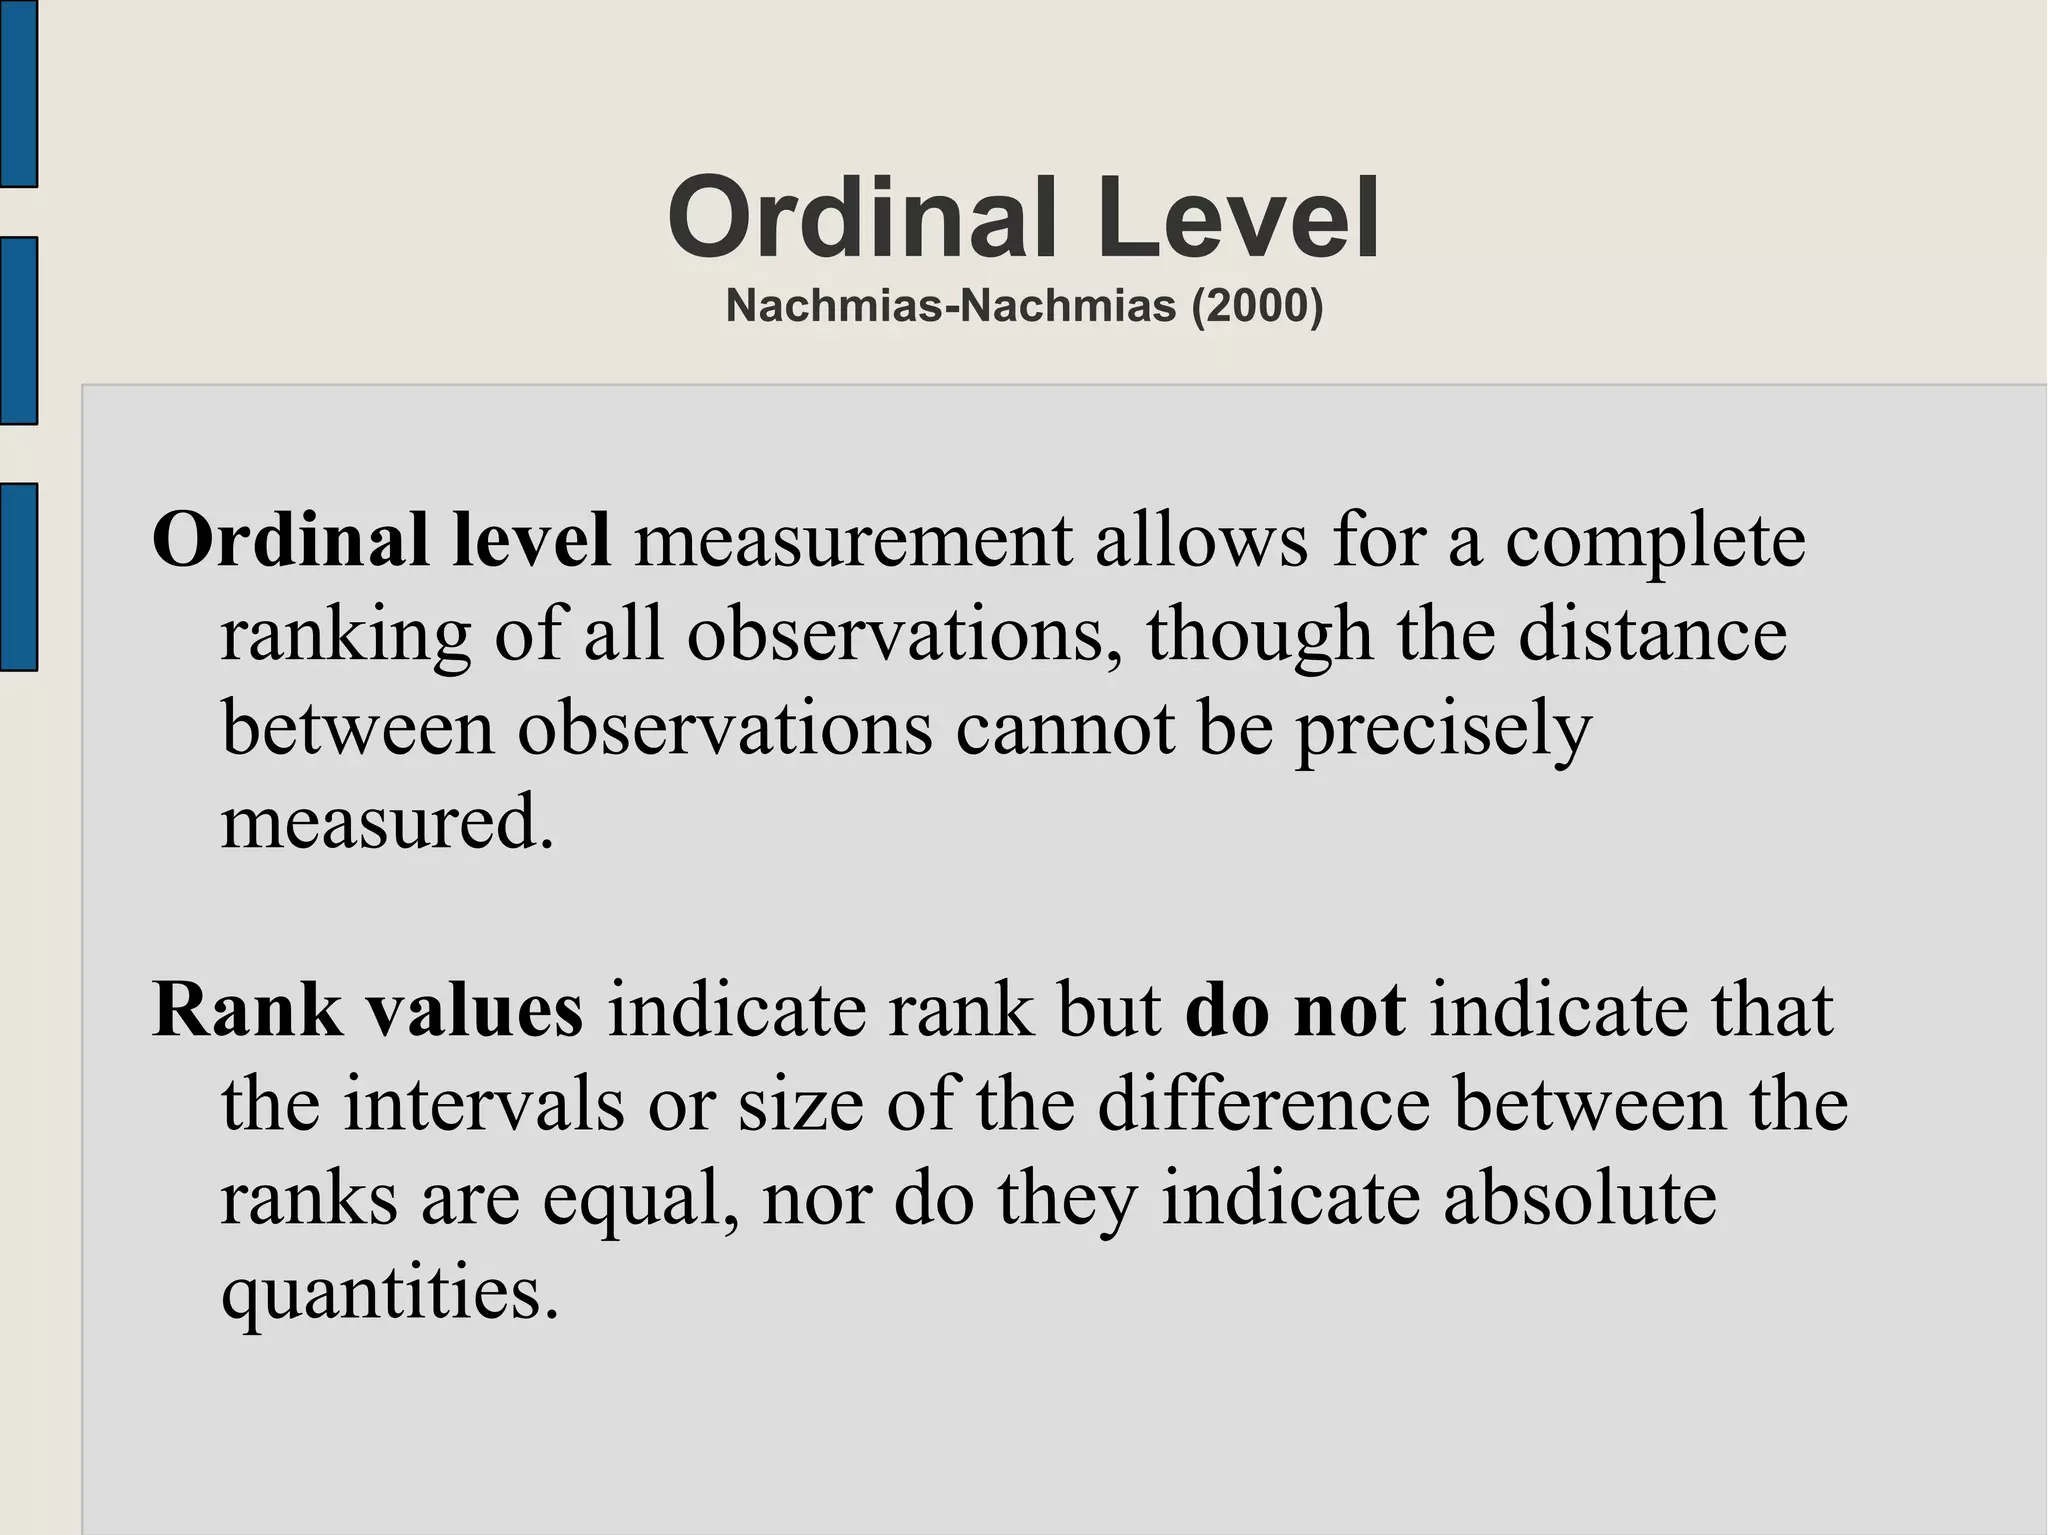
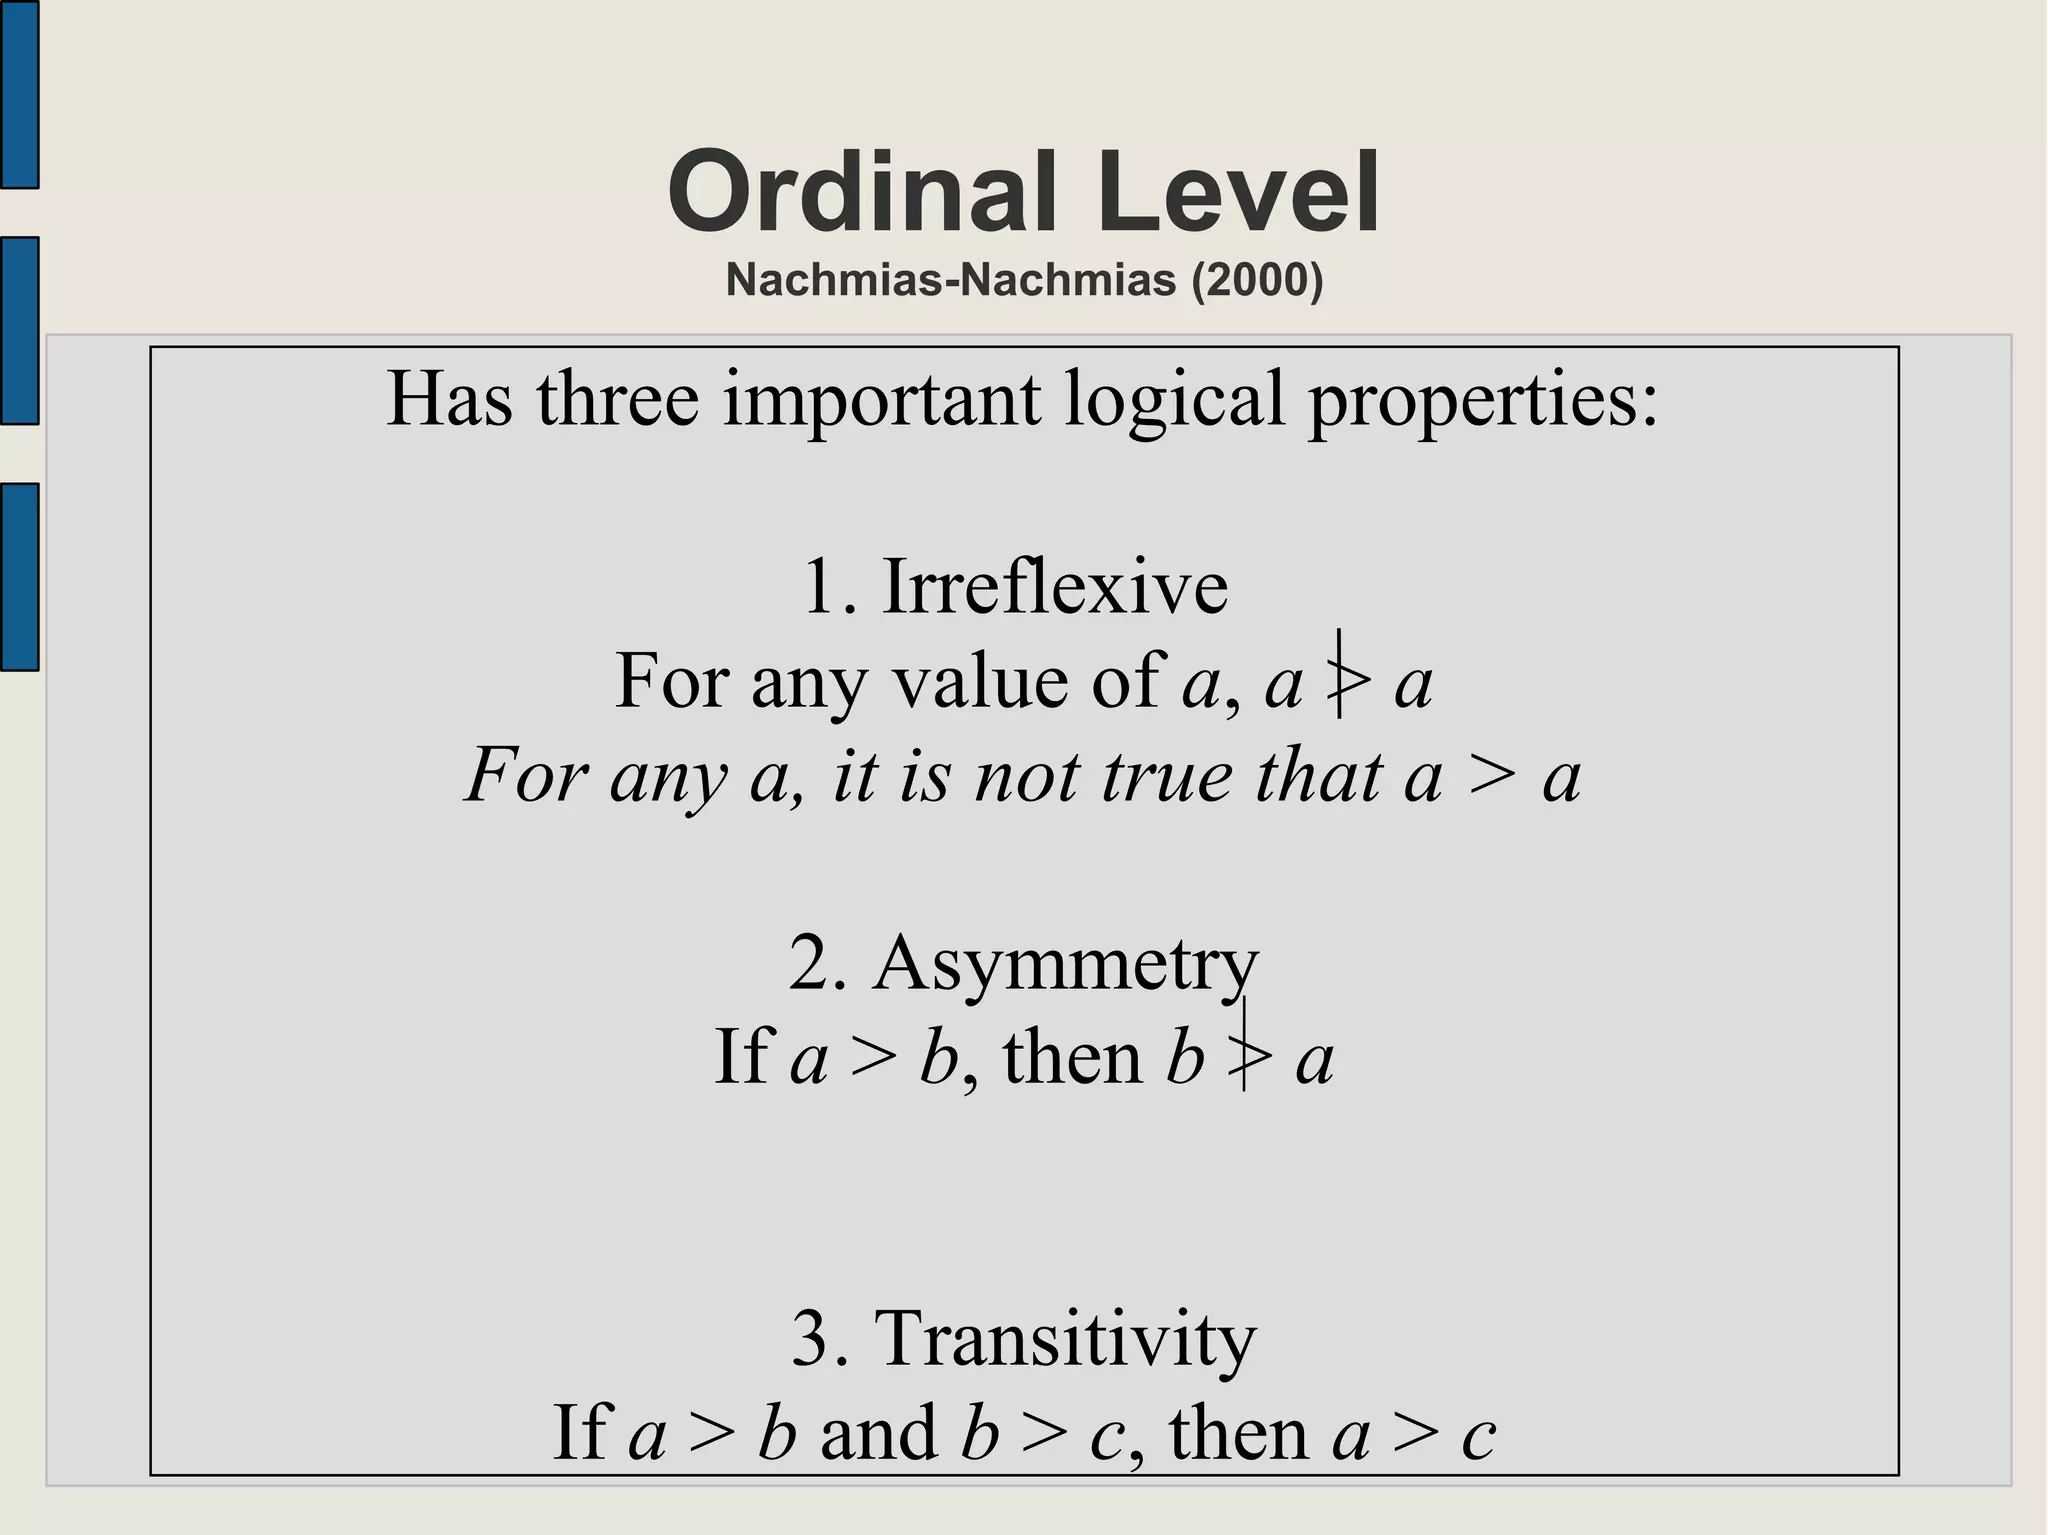
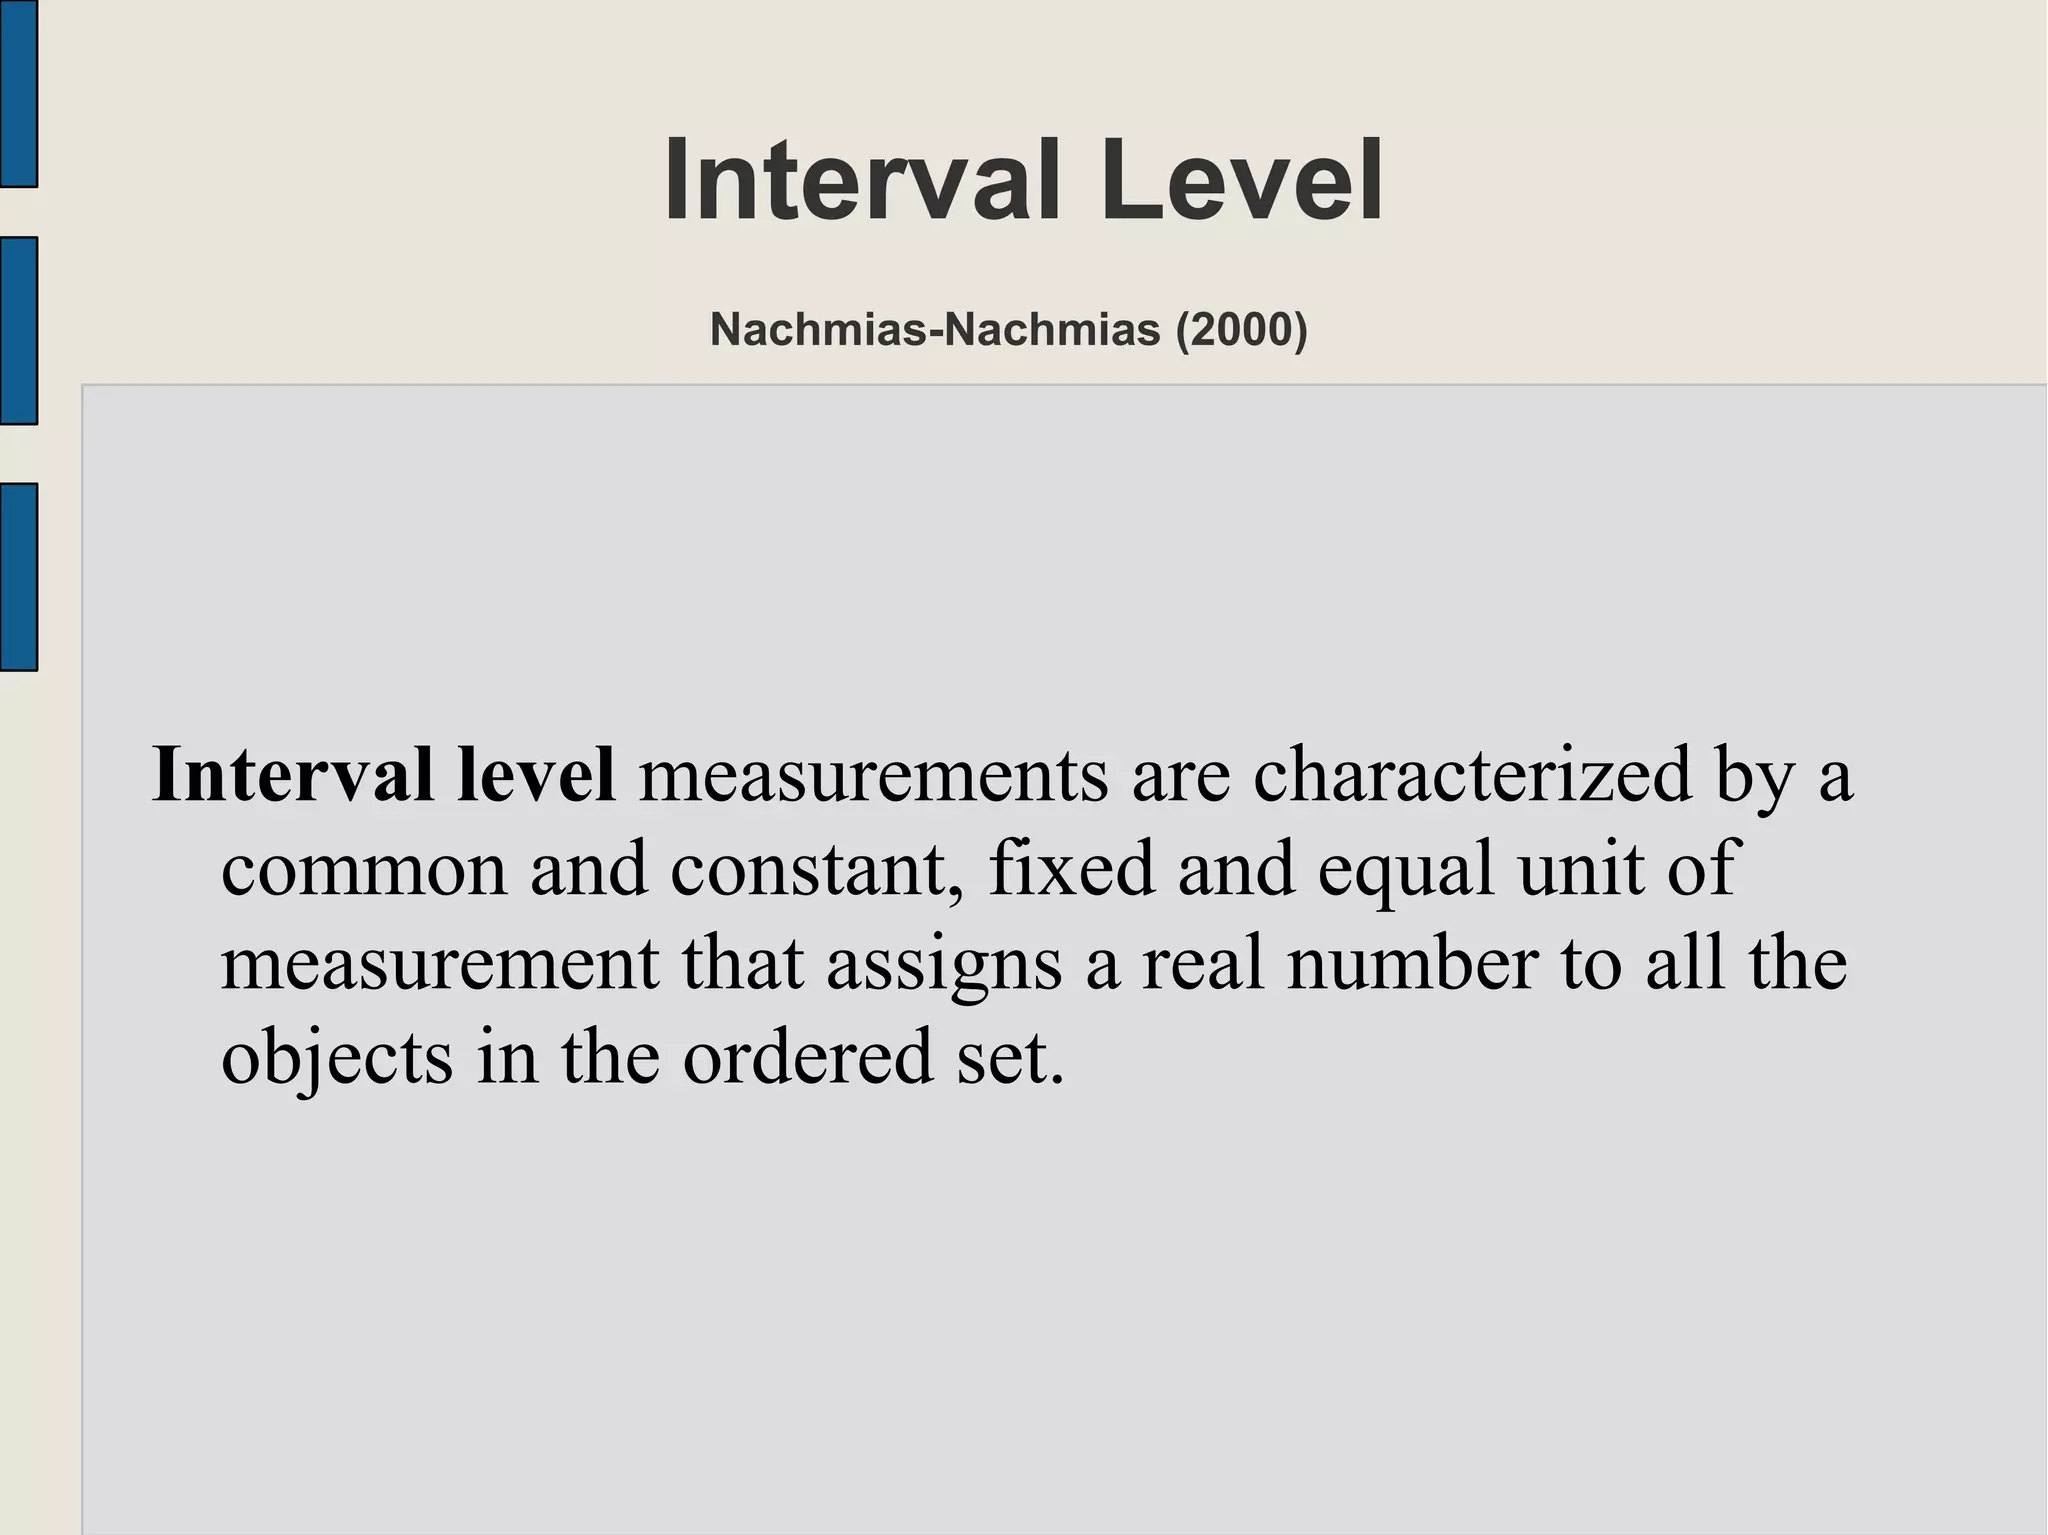
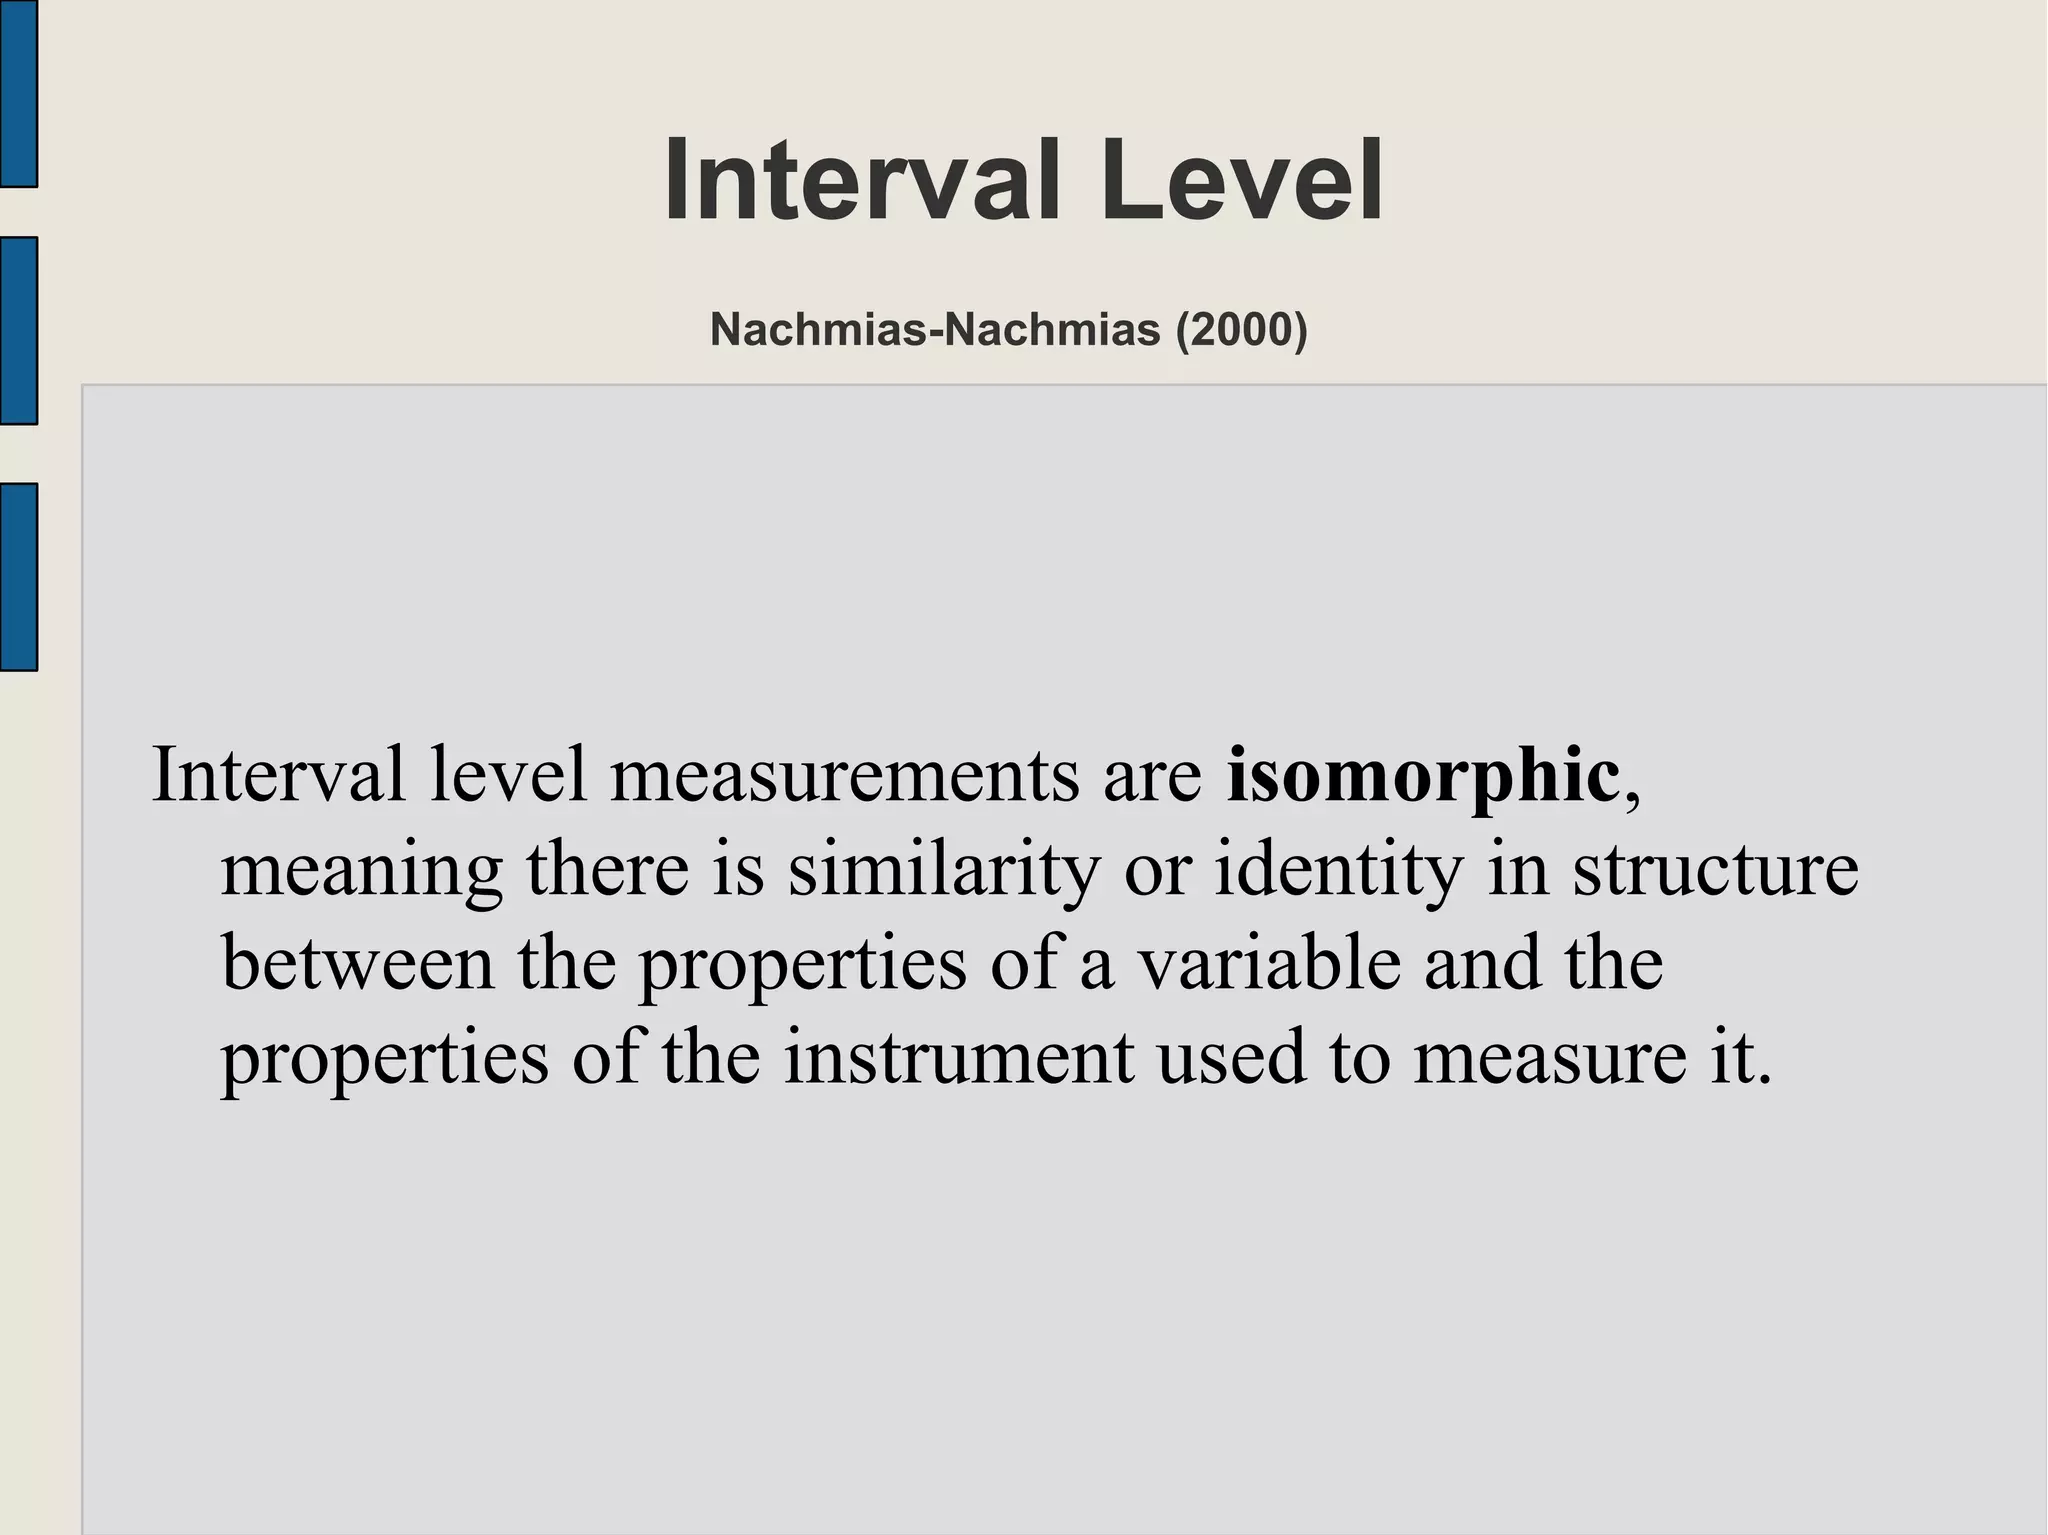
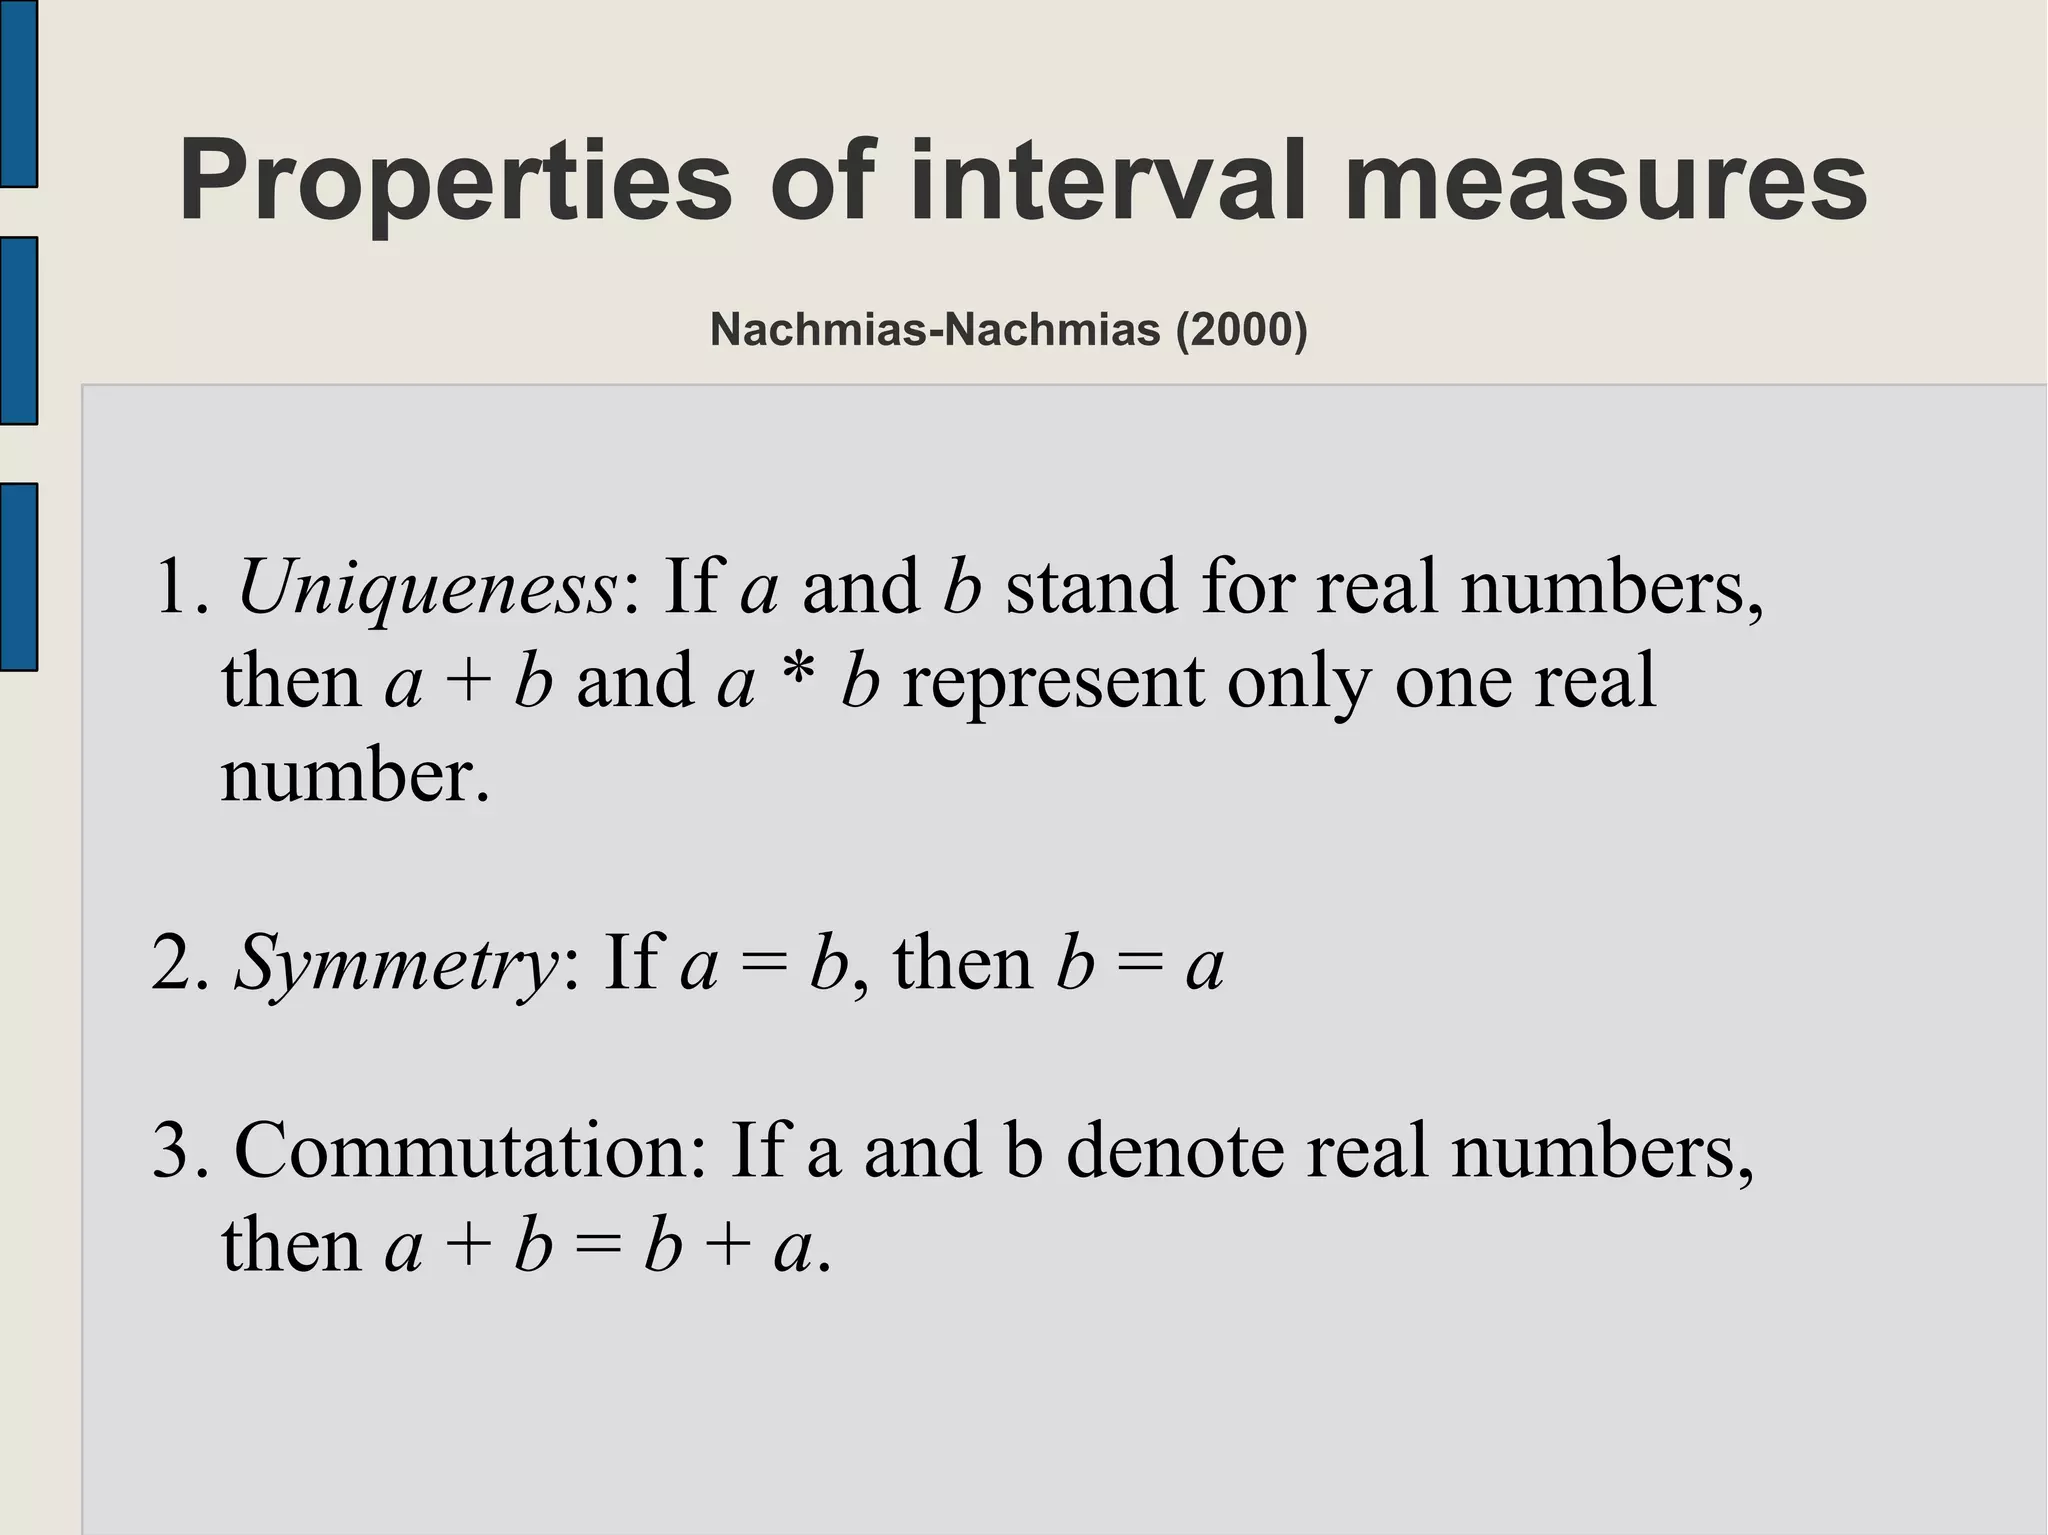
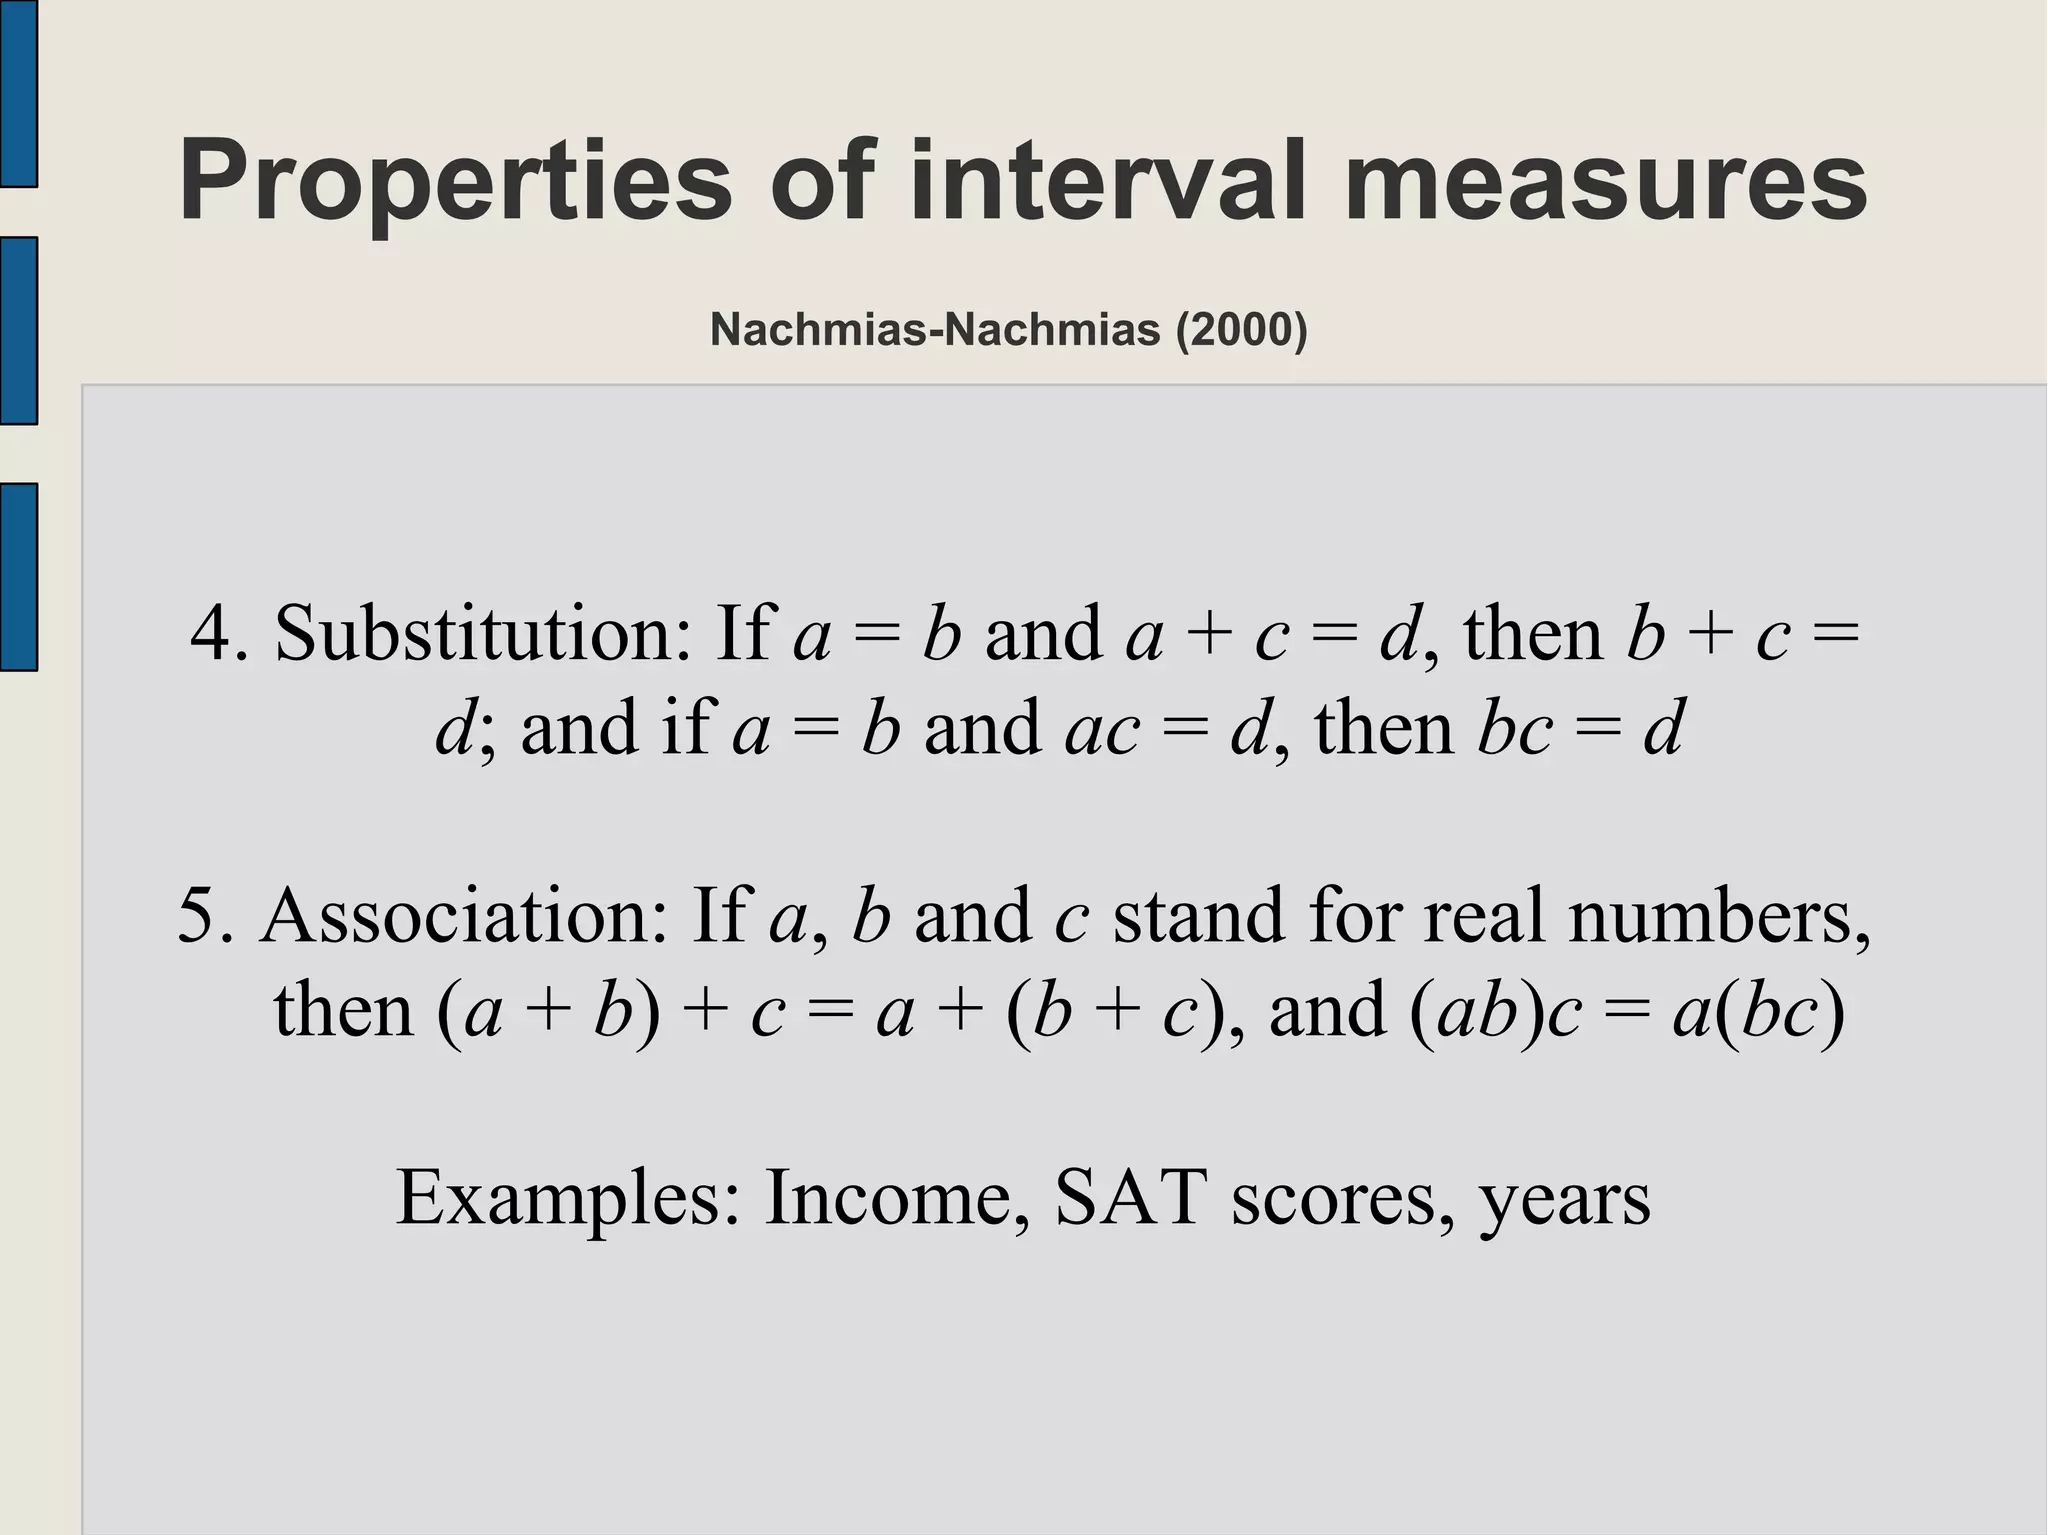
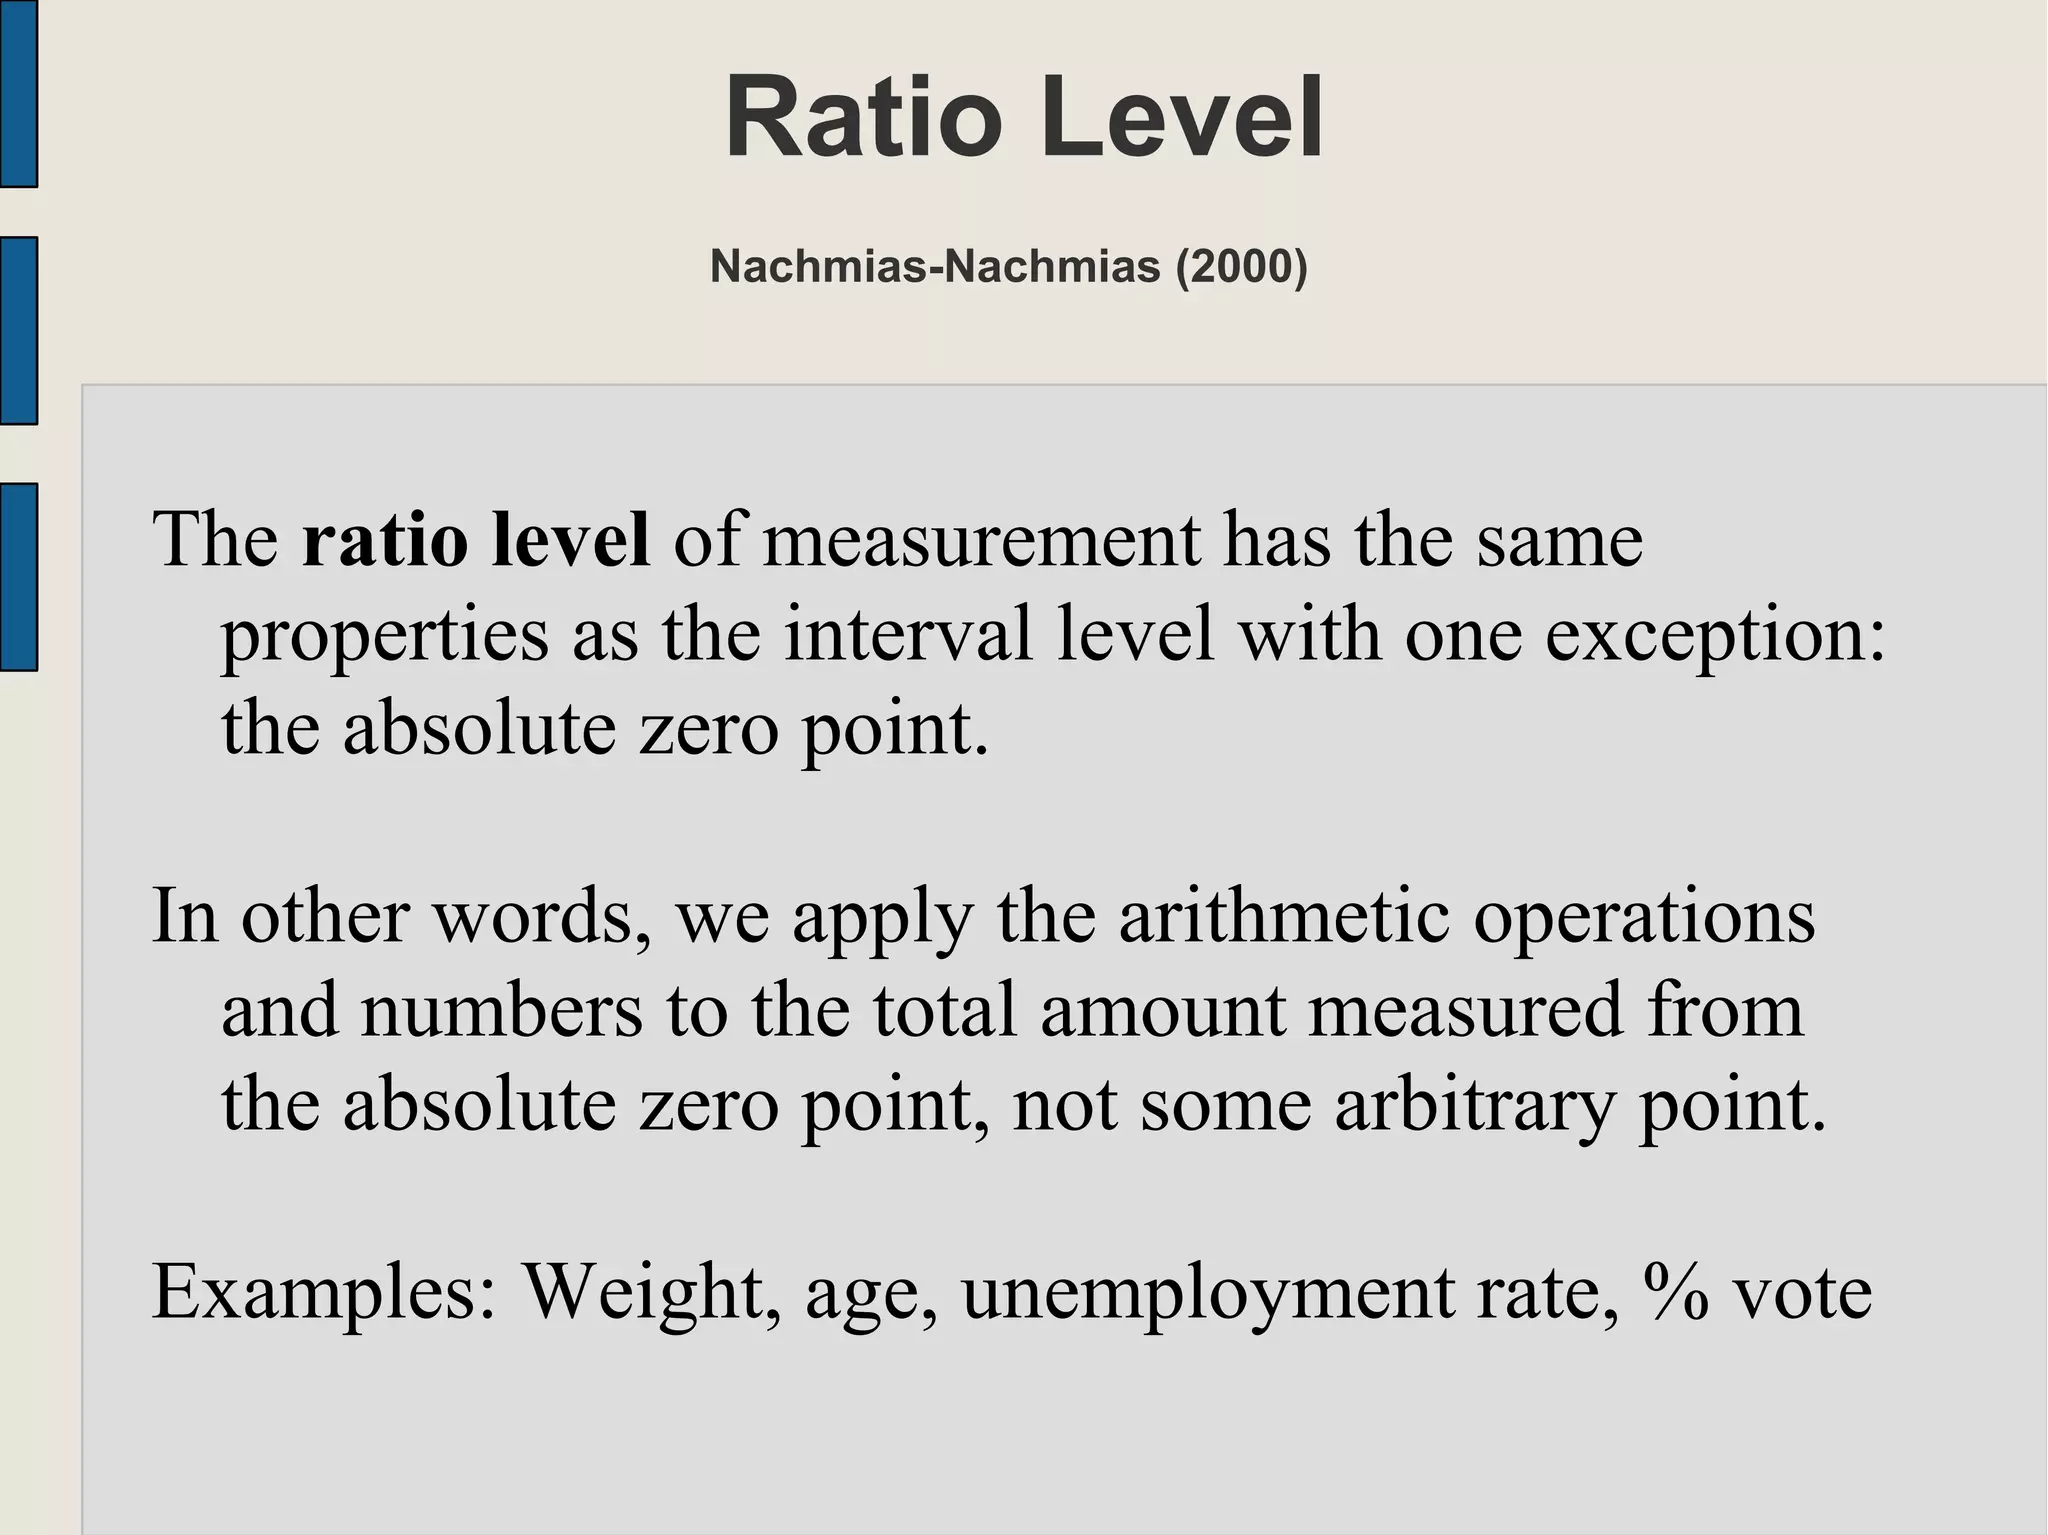
SlideShare a Scribd company logo
Level of Measurement
Debra Wallace
Level of Measurement
Level of measurement is the extent or degree to
which the values of variables can be compared
and mathematically manipulated.
Level of Measurement
The level of measurement depends on the type of
information the measurement contains.
The relationship between the variables and the
numbers is key.
Levels of Measurement
Ratio
Interval
Ordinal
NominalNominal
Ordinal
Interval
Ratio
Nominal Level
Nachmias-Nachmias (2000)
The nominal level of measurement refers to the
most basic level of measurement.
At the nominal level, numbers or symbols are used
to classify objects or events into categories that
are names or classes of other characteristics.
There is no mathematical relationship between
categories. Each category has an equivalent
relationship.
Nominal Level
or
Ordinal Level
Nachmias-Nachmias (2000)
Ordinal level measurement allows for a complete
ranking of all observations, though the distance
between observations cannot be precisely
measured.
Rank values indicate rank but do not indicate that
the intervals or size of the difference between the
ranks are equal, nor do they indicate absolute
quantities.
Ordinal Level
Nachmias-Nachmias (2000)
Has three important logical properties:
1. Irreflexive
For any value of a, a > a
For any a, it is not true that a > a
2. Asymmetry
If a > b, then b > a
3. Transitivity
If a > b and b > c, then a > c
Ordinal Level
Ordinal Level
Ordinal Level
Ordinal Level
Nachmias-Nachmias (2000)
● Surveys use ordinal
scales.
● Ex: Political efficacy
question: Do you
agree with the
following statement?
“People like me
have a lot of
influence on gov't
decisions.”
Interval Level
Nachmias-Nachmias (2000)
Interval level measurements are characterized by a
common and constant, fixed and equal unit of
measurement that assigns a real number to all the
objects in the ordered set.
Interval Level
Nachmias-Nachmias (2000)
Interval level measurements are isomorphic,
meaning there is similarity or identity in structure
between the properties of a variable and the
properties of the instrument used to measure it.
Properties of interval measures
Nachmias-Nachmias (2000)
1. Uniqueness: If a and b stand for real numbers,
then a + b and a * b represent only one real
number.
2. Symmetry: If a = b, then b = a
3. Commutation: If a and b denote real numbers,
then a + b = b + a.
Properties of interval measures
Nachmias-Nachmias (2000)
4. Substitution: If a = b and a + c = d, then b + c =
d; and if a = b and ac = d, then bc = d
5. Association: If a, b and c stand for real numbers,
then (a + b) + c = a + (b + c), and (ab)c = a(bc)
Examples: Income, SAT scores, years
Ratio Level
Nachmias-Nachmias (2000)
The ratio level of measurement has the same
properties as the interval level with one exception:
the absolute zero point.
In other words, we apply the arithmetic operations
and numbers to the total amount measured from
the absolute zero point, not some arbitrary point.
Examples: Weight, age, unemployment rate, % vote

More Related Content

What's hot

Levels of measurement
Levels of measurementLevels of measurement
Levels of measurement
Forum of Blended Learning
 
Standard Scores
Standard ScoresStandard Scores
Standard Scoresshoffma5
 
Types of Statistics
Types of StatisticsTypes of Statistics
Types of Statisticsloranel
 
Introduction to statistics...ppt rahul
Introduction to statistics...ppt rahulIntroduction to statistics...ppt rahul
Introduction to statistics...ppt rahul
Rahul Dhaker
 
Frequency distribution
Frequency distributionFrequency distribution
Frequency distribution
Noufal Naheem Kyd
 
Descriptive statistics
Descriptive statisticsDescriptive statistics
Descriptive statistics
Sarfraz Ahmad
 
Scales of measurment
Scales of measurmentScales of measurment
Scales of measurment
SWATHY M.A
 
Introduction To Statistics
Introduction To StatisticsIntroduction To Statistics
Introduction To Statisticsalbertlaporte
 
Population and Sampling.pptx
Population and Sampling.pptxPopulation and Sampling.pptx
Population and Sampling.pptx
Vijayalakshmi Murugesan
 
Introduction to statistics
Introduction to statisticsIntroduction to statistics
Introduction to statistics
ScholarsPoint1
 
Statistics in nursing research
Statistics in nursing researchStatistics in nursing research
Statistics in nursing research
Nursing Path
 
Measurement scales
Measurement scalesMeasurement scales
Measurement scales
Usra Hasan
 
Introduction and scope of statistics
Introduction and scope of statisticsIntroduction and scope of statistics
Introduction and scope of statistics
keerthi samuel
 
Methods of Data Collection in Statistics
Methods of Data Collection in StatisticsMethods of Data Collection in Statistics
Methods of Data Collection in Statistics
Clyde Bangligan
 
Introduction to Statistics - Basic concepts
Introduction to Statistics - Basic conceptsIntroduction to Statistics - Basic concepts
Introduction to Statistics - Basic concepts
DocIbrahimAbdelmonaem
 
Data analysis powerpoint
Data analysis powerpointData analysis powerpoint
Data analysis powerpointjamiebrandon
 
Measures of central tendency ppt
Measures of central tendency pptMeasures of central tendency ppt
Measures of central tendency ppt
NighatKanwal
 
Scale of measurement
Scale of measurementScale of measurement
Scale of measurement
HennaAnsari
 

What's hot (20)

Levels of measurement
Levels of measurementLevels of measurement
Levels of measurement
 
Standard Scores
Standard ScoresStandard Scores
Standard Scores
 
Types of Statistics
Types of StatisticsTypes of Statistics
Types of Statistics
 
Introduction to statistics...ppt rahul
Introduction to statistics...ppt rahulIntroduction to statistics...ppt rahul
Introduction to statistics...ppt rahul
 
Frequency distribution
Frequency distributionFrequency distribution
Frequency distribution
 
Descriptive statistics
Descriptive statisticsDescriptive statistics
Descriptive statistics
 
Scales of measurment
Scales of measurmentScales of measurment
Scales of measurment
 
Intro to statistics
Intro to statisticsIntro to statistics
Intro to statistics
 
Inferential Statistics
Inferential StatisticsInferential Statistics
Inferential Statistics
 
Introduction To Statistics
Introduction To StatisticsIntroduction To Statistics
Introduction To Statistics
 
Population and Sampling.pptx
Population and Sampling.pptxPopulation and Sampling.pptx
Population and Sampling.pptx
 
Introduction to statistics
Introduction to statisticsIntroduction to statistics
Introduction to statistics
 
Statistics in nursing research
Statistics in nursing researchStatistics in nursing research
Statistics in nursing research
 
Measurement scales
Measurement scalesMeasurement scales
Measurement scales
 
Introduction and scope of statistics
Introduction and scope of statisticsIntroduction and scope of statistics
Introduction and scope of statistics
 
Methods of Data Collection in Statistics
Methods of Data Collection in StatisticsMethods of Data Collection in Statistics
Methods of Data Collection in Statistics
 
Introduction to Statistics - Basic concepts
Introduction to Statistics - Basic conceptsIntroduction to Statistics - Basic concepts
Introduction to Statistics - Basic concepts
 
Data analysis powerpoint
Data analysis powerpointData analysis powerpoint
Data analysis powerpoint
 
Measures of central tendency ppt
Measures of central tendency pptMeasures of central tendency ppt
Measures of central tendency ppt
 
Scale of measurement
Scale of measurementScale of measurement
Scale of measurement
 

Viewers also liked

Level Of Measurement
Level Of MeasurementLevel Of Measurement
Level Of Measurement
cynthia joffrion
 
Level of measurement by slsmls
Level of measurement by slsmlsLevel of measurement by slsmls
Level of measurement by slsmls
Ravi Kumudesh
 
Properties of measurement scales
Properties of measurement scalesProperties of measurement scales
Properties of measurement scalesPrecious Aliman
 
Measures of central tendency
Measures of central tendencyMeasures of central tendency
Measures of central tendency
Eric Silandote
 
Lect w2 measures_of_location_and_spread
Lect w2 measures_of_location_and_spreadLect w2 measures_of_location_and_spread
Lect w2 measures_of_location_and_spread
Rione Drevale
 
Presentation on inverse matrix
Presentation on inverse matrixPresentation on inverse matrix
Presentation on inverse matrix
Syed Ahmed Zaki
 
Matrices and determinants
Matrices and determinantsMatrices and determinants
Matrices and determinants
Kum Visal
 
Inverse Matrix & Determinants
Inverse Matrix & DeterminantsInverse Matrix & Determinants
Inverse Matrix & Determinantsitutor
 
Matrices And Determinants
Matrices And DeterminantsMatrices And Determinants
Matrices And Determinants
DEVIKA S INDU
 
Graphical Representation of Data
Graphical Representation of DataGraphical Representation of Data
Graphical Representation of Data
forgetfulmailer
 
Graphical presentation of data
Graphical presentation of dataGraphical presentation of data
Graphical presentation of dataprince irfan
 
Levels of Measurement
Levels of MeasurementLevels of Measurement
Levels of Measurement
Sr Edith Bogue
 
Level Measurement
Level MeasurementLevel Measurement
Level Measurement
Burdwan University
 
Levels of measurement
Levels of measurementLevels of measurement
Levels of measurementBbte Rein
 
Measurement scales
Measurement scalesMeasurement scales
Measurement scalesAiden Yeh
 
Linear Algebra and Matrix
Linear Algebra and MatrixLinear Algebra and Matrix
Linear Algebra and Matrixitutor
 
Graphical representation of data mohit verma
Graphical representation of data mohit verma Graphical representation of data mohit verma
Graphical representation of data mohit verma
MOHIT KUMAR VERMA
 

Viewers also liked (20)

Level Of Measurement
Level Of MeasurementLevel Of Measurement
Level Of Measurement
 
Level of measurement by slsmls
Level of measurement by slsmlsLevel of measurement by slsmls
Level of measurement by slsmls
 
Properties of measurement scales
Properties of measurement scalesProperties of measurement scales
Properties of measurement scales
 
Measures of central tendency
Measures of central tendencyMeasures of central tendency
Measures of central tendency
 
Lect w2 measures_of_location_and_spread
Lect w2 measures_of_location_and_spreadLect w2 measures_of_location_and_spread
Lect w2 measures_of_location_and_spread
 
Presentation on inverse matrix
Presentation on inverse matrixPresentation on inverse matrix
Presentation on inverse matrix
 
Measurement levels
Measurement levelsMeasurement levels
Measurement levels
 
Matrices and determinants
Matrices and determinantsMatrices and determinants
Matrices and determinants
 
Inverse Matrix & Determinants
Inverse Matrix & DeterminantsInverse Matrix & Determinants
Inverse Matrix & Determinants
 
Matrices And Determinants
Matrices And DeterminantsMatrices And Determinants
Matrices And Determinants
 
Graphical Representation of Data
Graphical Representation of DataGraphical Representation of Data
Graphical Representation of Data
 
Graphical presentation of data
Graphical presentation of dataGraphical presentation of data
Graphical presentation of data
 
Levels of Measurement
Levels of MeasurementLevels of Measurement
Levels of Measurement
 
Level Measurement
Level MeasurementLevel Measurement
Level Measurement
 
Levels of measurement
Levels of measurementLevels of measurement
Levels of measurement
 
Measurement scales
Measurement scalesMeasurement scales
Measurement scales
 
Level Measurement
Level MeasurementLevel Measurement
Level Measurement
 
Linear Algebra and Matrix
Linear Algebra and MatrixLinear Algebra and Matrix
Linear Algebra and Matrix
 
The Level Measurement
The Level MeasurementThe Level Measurement
The Level Measurement
 
Graphical representation of data mohit verma
Graphical representation of data mohit verma Graphical representation of data mohit verma
Graphical representation of data mohit verma
 

Similar to Statistic Level of Measurement

12943625.ppt
12943625.ppt12943625.ppt
12943625.ppt
MokayceLimited
 
Descriptive Statistics.pptx
Descriptive Statistics.pptxDescriptive Statistics.pptx
Descriptive Statistics.pptx
SaiMohnishMuralidhar
 
Data Types and Graphical Representation.pptx
Data Types and Graphical Representation.pptxData Types and Graphical Representation.pptx
Data Types and Graphical Representation.pptx
anayanoor28
 
Plane-and-Solid-Geometry. introduction to proving
Plane-and-Solid-Geometry. introduction to provingPlane-and-Solid-Geometry. introduction to proving
Plane-and-Solid-Geometry. introduction to proving
ReyRoluna1
 
scales of measurement - maneesh jha.pptx
scales of measurement - maneesh jha.pptxscales of measurement - maneesh jha.pptx
scales of measurement - maneesh jha.pptx
Maneesh Jha
 
Lect w8 w9_correlation_regression
Lect w8 w9_correlation_regressionLect w8 w9_correlation_regression
Lect w8 w9_correlation_regression
Rione Drevale
 
Applied Statistics In Business
Applied Statistics In BusinessApplied Statistics In Business
Applied Statistics In Business
Ashish Nangla
 
Physics 1.3 scalars and vectors
Physics 1.3 scalars and vectorsPhysics 1.3 scalars and vectors
Physics 1.3 scalars and vectors
JohnPaul Kennedy
 
Correlation.pdf
Correlation.pdfCorrelation.pdf
Correlation.pdf
TamilarasiP13
 
Data mining Measuring similarity and desimilarity
Data mining Measuring similarity and desimilarityData mining Measuring similarity and desimilarity
Data mining Measuring similarity and desimilarity
Rushali Deshmukh
 
Measure of Association
Measure of AssociationMeasure of Association
Measure of Association
Kalahandi University
 
Statistics
StatisticsStatistics
Statisticspikuoec
 
The Real Numbers
The Real NumbersThe Real Numbers
The Real Numbers
Sierra Nichols
 
Correlation analysis in Biostatistics .pptx
Correlation analysis in Biostatistics .pptxCorrelation analysis in Biostatistics .pptx
Correlation analysis in Biostatistics .pptx
HamdiMichaelCC
 
Numerical approximation
Numerical approximationNumerical approximation
Numerical approximationMileacre
 
unit 3_Predictive Analysis Dr. Neeraj.pptx
unit 3_Predictive Analysis Dr. Neeraj.pptxunit 3_Predictive Analysis Dr. Neeraj.pptx
unit 3_Predictive Analysis Dr. Neeraj.pptx
rohitrajbhar1845
 
Statistics
StatisticsStatistics
Statisticsitutor
 
TTests.ppt
TTests.pptTTests.ppt
TTests.ppt
MUzair21
 
Measurements, Vector and Equilibrium
Measurements, Vector and EquilibriumMeasurements, Vector and Equilibrium
Measurements, Vector and Equilibrium
Muhammad Imtiaz
 

Similar to Statistic Level of Measurement (20)

Measurement pt. 2
Measurement pt. 2Measurement pt. 2
Measurement pt. 2
 
12943625.ppt
12943625.ppt12943625.ppt
12943625.ppt
 
Descriptive Statistics.pptx
Descriptive Statistics.pptxDescriptive Statistics.pptx
Descriptive Statistics.pptx
 
Data Types and Graphical Representation.pptx
Data Types and Graphical Representation.pptxData Types and Graphical Representation.pptx
Data Types and Graphical Representation.pptx
 
Plane-and-Solid-Geometry. introduction to proving
Plane-and-Solid-Geometry. introduction to provingPlane-and-Solid-Geometry. introduction to proving
Plane-and-Solid-Geometry. introduction to proving
 
scales of measurement - maneesh jha.pptx
scales of measurement - maneesh jha.pptxscales of measurement - maneesh jha.pptx
scales of measurement - maneesh jha.pptx
 
Lect w8 w9_correlation_regression
Lect w8 w9_correlation_regressionLect w8 w9_correlation_regression
Lect w8 w9_correlation_regression
 
Applied Statistics In Business
Applied Statistics In BusinessApplied Statistics In Business
Applied Statistics In Business
 
Physics 1.3 scalars and vectors
Physics 1.3 scalars and vectorsPhysics 1.3 scalars and vectors
Physics 1.3 scalars and vectors
 
Correlation.pdf
Correlation.pdfCorrelation.pdf
Correlation.pdf
 
Data mining Measuring similarity and desimilarity
Data mining Measuring similarity and desimilarityData mining Measuring similarity and desimilarity
Data mining Measuring similarity and desimilarity
 
Measure of Association
Measure of AssociationMeasure of Association
Measure of Association
 
Statistics
StatisticsStatistics
Statistics
 
The Real Numbers
The Real NumbersThe Real Numbers
The Real Numbers
 
Correlation analysis in Biostatistics .pptx
Correlation analysis in Biostatistics .pptxCorrelation analysis in Biostatistics .pptx
Correlation analysis in Biostatistics .pptx
 
Numerical approximation
Numerical approximationNumerical approximation
Numerical approximation
 
unit 3_Predictive Analysis Dr. Neeraj.pptx
unit 3_Predictive Analysis Dr. Neeraj.pptxunit 3_Predictive Analysis Dr. Neeraj.pptx
unit 3_Predictive Analysis Dr. Neeraj.pptx
 
Statistics
StatisticsStatistics
Statistics
 
TTests.ppt
TTests.pptTTests.ppt
TTests.ppt
 
Measurements, Vector and Equilibrium
Measurements, Vector and EquilibriumMeasurements, Vector and Equilibrium
Measurements, Vector and Equilibrium
 

More from Debra Wallace

Study strategies culture
Study strategies cultureStudy strategies culture
Study strategies culture
Debra Wallace
 
Elementary Statistics Picturing the World ch01.1
Elementary Statistics Picturing the World ch01.1Elementary Statistics Picturing the World ch01.1
Elementary Statistics Picturing the World ch01.1
Debra Wallace
 
Parallel and perpendicular_lines 1.1
Parallel and perpendicular_lines 1.1Parallel and perpendicular_lines 1.1
Parallel and perpendicular_lines 1.1
Debra Wallace
 
Statistics ch01.1
Statistics ch01.1Statistics ch01.1
Statistics ch01.1
Debra Wallace
 
Third nine week review powerpoint Chapter 4
Third nine week review powerpoint Chapter 4Third nine week review powerpoint Chapter 4
Third nine week review powerpoint Chapter 4
Debra Wallace
 
Stats 3rd nine week chapter 5 review powerpoint
Stats 3rd nine week chapter 5 review powerpointStats 3rd nine week chapter 5 review powerpoint
Stats 3rd nine week chapter 5 review powerpoint
Debra Wallace
 
Inverse composite functions
Inverse composite functionsInverse composite functions
Inverse composite functionsDebra Wallace
 
Inverse functions 1.6
Inverse functions 1.6Inverse functions 1.6
Inverse functions 1.6Debra Wallace
 
Odd and even functions
Odd and even functionsOdd and even functions
Odd and even functionsDebra Wallace
 
Data gathering section1.1
Data gathering section1.1Data gathering section1.1
Data gathering section1.1Debra Wallace
 
Experimental design powerpoint2
Experimental design powerpoint2Experimental design powerpoint2
Experimental design powerpoint2Debra Wallace
 
Stats project worksheet1
Stats project worksheet1Stats project worksheet1
Stats project worksheet1Debra Wallace
 
Statistics ch1 sec1.2
Statistics ch1 sec1.2Statistics ch1 sec1.2
Statistics ch1 sec1.2
Debra Wallace
 
Statistics Vocabulary Chapter 1
Statistics Vocabulary Chapter 1Statistics Vocabulary Chapter 1
Statistics Vocabulary Chapter 1Debra Wallace
 
MBA Mission statement
MBA Mission statementMBA Mission statement
MBA Mission statementDebra Wallace
 
Platonic solids in nature
Platonic solids in naturePlatonic solids in nature
Platonic solids in natureDebra Wallace
 

More from Debra Wallace (20)

Study strategies culture
Study strategies cultureStudy strategies culture
Study strategies culture
 
Elementary Statistics Picturing the World ch01.1
Elementary Statistics Picturing the World ch01.1Elementary Statistics Picturing the World ch01.1
Elementary Statistics Picturing the World ch01.1
 
Parallel and perpendicular_lines 1.1
Parallel and perpendicular_lines 1.1Parallel and perpendicular_lines 1.1
Parallel and perpendicular_lines 1.1
 
Pre cal drill
Pre cal drillPre cal drill
Pre cal drill
 
Statistics ch01.1
Statistics ch01.1Statistics ch01.1
Statistics ch01.1
 
Third nine week review powerpoint Chapter 4
Third nine week review powerpoint Chapter 4Third nine week review powerpoint Chapter 4
Third nine week review powerpoint Chapter 4
 
Stats 3rd nine week chapter 5 review powerpoint
Stats 3rd nine week chapter 5 review powerpointStats 3rd nine week chapter 5 review powerpoint
Stats 3rd nine week chapter 5 review powerpoint
 
Larson ch 4 Stats
Larson ch 4 StatsLarson ch 4 Stats
Larson ch 4 Stats
 
Inverse composite functions
Inverse composite functionsInverse composite functions
Inverse composite functions
 
Inverse functions 1.6
Inverse functions 1.6Inverse functions 1.6
Inverse functions 1.6
 
Classes
ClassesClasses
Classes
 
Odd and even functions
Odd and even functionsOdd and even functions
Odd and even functions
 
Data gathering section1.1
Data gathering section1.1Data gathering section1.1
Data gathering section1.1
 
Experimental design powerpoint2
Experimental design powerpoint2Experimental design powerpoint2
Experimental design powerpoint2
 
Stats project worksheet1
Stats project worksheet1Stats project worksheet1
Stats project worksheet1
 
Statistics ch1 sec1.2
Statistics ch1 sec1.2Statistics ch1 sec1.2
Statistics ch1 sec1.2
 
Statistics Vocabulary Chapter 1
Statistics Vocabulary Chapter 1Statistics Vocabulary Chapter 1
Statistics Vocabulary Chapter 1
 
Mba school culture
Mba school cultureMba school culture
Mba school culture
 
MBA Mission statement
MBA Mission statementMBA Mission statement
MBA Mission statement
 
Platonic solids in nature
Platonic solids in naturePlatonic solids in nature
Platonic solids in nature
 

Recently uploaded

The Challenger.pdf DNHS Official Publication
The Challenger.pdf DNHS Official PublicationThe Challenger.pdf DNHS Official Publication
The Challenger.pdf DNHS Official Publication
Delapenabediema
 
Overview on Edible Vaccine: Pros & Cons with Mechanism
Overview on Edible Vaccine: Pros & Cons with MechanismOverview on Edible Vaccine: Pros & Cons with Mechanism
Overview on Edible Vaccine: Pros & Cons with Mechanism
DeeptiGupta154
 
How to Create Map Views in the Odoo 17 ERP
How to Create Map Views in the Odoo 17 ERPHow to Create Map Views in the Odoo 17 ERP
How to Create Map Views in the Odoo 17 ERP
Celine George
 
Digital Tools and AI for Teaching Learning and Research
Digital Tools and AI for Teaching Learning and ResearchDigital Tools and AI for Teaching Learning and Research
Digital Tools and AI for Teaching Learning and Research
Vikramjit Singh
 
How to Split Bills in the Odoo 17 POS Module
How to Split Bills in the Odoo 17 POS ModuleHow to Split Bills in the Odoo 17 POS Module
How to Split Bills in the Odoo 17 POS Module
Celine George
 
How to Make a Field invisible in Odoo 17
How to Make a Field invisible in Odoo 17How to Make a Field invisible in Odoo 17
How to Make a Field invisible in Odoo 17
Celine George
 
TESDA TM1 REVIEWER FOR NATIONAL ASSESSMENT WRITTEN AND ORAL QUESTIONS WITH A...
TESDA TM1 REVIEWER  FOR NATIONAL ASSESSMENT WRITTEN AND ORAL QUESTIONS WITH A...TESDA TM1 REVIEWER  FOR NATIONAL ASSESSMENT WRITTEN AND ORAL QUESTIONS WITH A...
TESDA TM1 REVIEWER FOR NATIONAL ASSESSMENT WRITTEN AND ORAL QUESTIONS WITH A...
EugeneSaldivar
 
Introduction to Quality Improvement Essentials
Introduction to Quality Improvement EssentialsIntroduction to Quality Improvement Essentials
Introduction to Quality Improvement Essentials
Excellence Foundation for South Sudan
 
ESC Beyond Borders _From EU to You_ InfoPack general.pdf
ESC Beyond Borders _From EU to You_ InfoPack general.pdfESC Beyond Borders _From EU to You_ InfoPack general.pdf
ESC Beyond Borders _From EU to You_ InfoPack general.pdf
Fundacja Rozwoju Społeczeństwa Przedsiębiorczego
 
Language Across the Curriculm LAC B.Ed.
Language Across the  Curriculm LAC B.Ed.Language Across the  Curriculm LAC B.Ed.
Language Across the Curriculm LAC B.Ed.
Atul Kumar Singh
 
Cambridge International AS A Level Biology Coursebook - EBook (MaryFosbery J...
Cambridge International AS  A Level Biology Coursebook - EBook (MaryFosbery J...Cambridge International AS  A Level Biology Coursebook - EBook (MaryFosbery J...
Cambridge International AS A Level Biology Coursebook - EBook (MaryFosbery J...
AzmatAli747758
 
Sectors of the Indian Economy - Class 10 Study Notes pdf
Sectors of the Indian Economy - Class 10 Study Notes pdfSectors of the Indian Economy - Class 10 Study Notes pdf
Sectors of the Indian Economy - Class 10 Study Notes pdf
Vivekanand Anglo Vedic Academy
 
Home assignment II on Spectroscopy 2024 Answers.pdf
Home assignment II on Spectroscopy 2024 Answers.pdfHome assignment II on Spectroscopy 2024 Answers.pdf
Home assignment II on Spectroscopy 2024 Answers.pdf
Tamralipta Mahavidyalaya
 
Thesis Statement for students diagnonsed withADHD.ppt
Thesis Statement for students diagnonsed withADHD.pptThesis Statement for students diagnonsed withADHD.ppt
Thesis Statement for students diagnonsed withADHD.ppt
EverAndrsGuerraGuerr
 
MARUTI SUZUKI- A Successful Joint Venture in India.pptx
MARUTI SUZUKI- A Successful Joint Venture in India.pptxMARUTI SUZUKI- A Successful Joint Venture in India.pptx
MARUTI SUZUKI- A Successful Joint Venture in India.pptx
bennyroshan06
 
Basic phrases for greeting and assisting costumers
Basic phrases for greeting and assisting costumersBasic phrases for greeting and assisting costumers
Basic phrases for greeting and assisting costumers
PedroFerreira53928
 
CLASS 11 CBSE B.St Project AIDS TO TRADE - INSURANCE
CLASS 11 CBSE B.St Project AIDS TO TRADE - INSURANCECLASS 11 CBSE B.St Project AIDS TO TRADE - INSURANCE
CLASS 11 CBSE B.St Project AIDS TO TRADE - INSURANCE
BhavyaRajput3
 
Unit 2- Research Aptitude (UGC NET Paper I).pdf
Unit 2- Research Aptitude (UGC NET Paper I).pdfUnit 2- Research Aptitude (UGC NET Paper I).pdf
Unit 2- Research Aptitude (UGC NET Paper I).pdf
Thiyagu K
 
Polish students' mobility in the Czech Republic
Polish students' mobility in the Czech RepublicPolish students' mobility in the Czech Republic
Polish students' mobility in the Czech Republic
Anna Sz.
 
Synthetic Fiber Construction in lab .pptx
Synthetic Fiber Construction in lab .pptxSynthetic Fiber Construction in lab .pptx
Synthetic Fiber Construction in lab .pptx
Pavel ( NSTU)
 

Recently uploaded (20)

The Challenger.pdf DNHS Official Publication
The Challenger.pdf DNHS Official PublicationThe Challenger.pdf DNHS Official Publication
The Challenger.pdf DNHS Official Publication
 
Overview on Edible Vaccine: Pros & Cons with Mechanism
Overview on Edible Vaccine: Pros & Cons with MechanismOverview on Edible Vaccine: Pros & Cons with Mechanism
Overview on Edible Vaccine: Pros & Cons with Mechanism
 
How to Create Map Views in the Odoo 17 ERP
How to Create Map Views in the Odoo 17 ERPHow to Create Map Views in the Odoo 17 ERP
How to Create Map Views in the Odoo 17 ERP
 
Digital Tools and AI for Teaching Learning and Research
Digital Tools and AI for Teaching Learning and ResearchDigital Tools and AI for Teaching Learning and Research
Digital Tools and AI for Teaching Learning and Research
 
How to Split Bills in the Odoo 17 POS Module
How to Split Bills in the Odoo 17 POS ModuleHow to Split Bills in the Odoo 17 POS Module
How to Split Bills in the Odoo 17 POS Module
 
How to Make a Field invisible in Odoo 17
How to Make a Field invisible in Odoo 17How to Make a Field invisible in Odoo 17
How to Make a Field invisible in Odoo 17
 
TESDA TM1 REVIEWER FOR NATIONAL ASSESSMENT WRITTEN AND ORAL QUESTIONS WITH A...
TESDA TM1 REVIEWER  FOR NATIONAL ASSESSMENT WRITTEN AND ORAL QUESTIONS WITH A...TESDA TM1 REVIEWER  FOR NATIONAL ASSESSMENT WRITTEN AND ORAL QUESTIONS WITH A...
TESDA TM1 REVIEWER FOR NATIONAL ASSESSMENT WRITTEN AND ORAL QUESTIONS WITH A...
 
Introduction to Quality Improvement Essentials
Introduction to Quality Improvement EssentialsIntroduction to Quality Improvement Essentials
Introduction to Quality Improvement Essentials
 
ESC Beyond Borders _From EU to You_ InfoPack general.pdf
ESC Beyond Borders _From EU to You_ InfoPack general.pdfESC Beyond Borders _From EU to You_ InfoPack general.pdf
ESC Beyond Borders _From EU to You_ InfoPack general.pdf
 
Language Across the Curriculm LAC B.Ed.
Language Across the  Curriculm LAC B.Ed.Language Across the  Curriculm LAC B.Ed.
Language Across the Curriculm LAC B.Ed.
 
Cambridge International AS A Level Biology Coursebook - EBook (MaryFosbery J...
Cambridge International AS  A Level Biology Coursebook - EBook (MaryFosbery J...Cambridge International AS  A Level Biology Coursebook - EBook (MaryFosbery J...
Cambridge International AS A Level Biology Coursebook - EBook (MaryFosbery J...
 
Sectors of the Indian Economy - Class 10 Study Notes pdf
Sectors of the Indian Economy - Class 10 Study Notes pdfSectors of the Indian Economy - Class 10 Study Notes pdf
Sectors of the Indian Economy - Class 10 Study Notes pdf
 
Home assignment II on Spectroscopy 2024 Answers.pdf
Home assignment II on Spectroscopy 2024 Answers.pdfHome assignment II on Spectroscopy 2024 Answers.pdf
Home assignment II on Spectroscopy 2024 Answers.pdf
 
Thesis Statement for students diagnonsed withADHD.ppt
Thesis Statement for students diagnonsed withADHD.pptThesis Statement for students diagnonsed withADHD.ppt
Thesis Statement for students diagnonsed withADHD.ppt
 
MARUTI SUZUKI- A Successful Joint Venture in India.pptx
MARUTI SUZUKI- A Successful Joint Venture in India.pptxMARUTI SUZUKI- A Successful Joint Venture in India.pptx
MARUTI SUZUKI- A Successful Joint Venture in India.pptx
 
Basic phrases for greeting and assisting costumers
Basic phrases for greeting and assisting costumersBasic phrases for greeting and assisting costumers
Basic phrases for greeting and assisting costumers
 
CLASS 11 CBSE B.St Project AIDS TO TRADE - INSURANCE
CLASS 11 CBSE B.St Project AIDS TO TRADE - INSURANCECLASS 11 CBSE B.St Project AIDS TO TRADE - INSURANCE
CLASS 11 CBSE B.St Project AIDS TO TRADE - INSURANCE
 
Unit 2- Research Aptitude (UGC NET Paper I).pdf
Unit 2- Research Aptitude (UGC NET Paper I).pdfUnit 2- Research Aptitude (UGC NET Paper I).pdf
Unit 2- Research Aptitude (UGC NET Paper I).pdf
 
Polish students' mobility in the Czech Republic
Polish students' mobility in the Czech RepublicPolish students' mobility in the Czech Republic
Polish students' mobility in the Czech Republic
 
Synthetic Fiber Construction in lab .pptx
Synthetic Fiber Construction in lab .pptxSynthetic Fiber Construction in lab .pptx
Synthetic Fiber Construction in lab .pptx
 

Statistic Level of Measurement

  • 2. Level of Measurement Level of measurement is the extent or degree to which the values of variables can be compared and mathematically manipulated.
  • 3. Level of Measurement The level of measurement depends on the type of information the measurement contains. The relationship between the variables and the numbers is key.
  • 5. Nominal Level Nachmias-Nachmias (2000) The nominal level of measurement refers to the most basic level of measurement. At the nominal level, numbers or symbols are used to classify objects or events into categories that are names or classes of other characteristics. There is no mathematical relationship between categories. Each category has an equivalent relationship.
  • 7. Ordinal Level Nachmias-Nachmias (2000) Ordinal level measurement allows for a complete ranking of all observations, though the distance between observations cannot be precisely measured. Rank values indicate rank but do not indicate that the intervals or size of the difference between the ranks are equal, nor do they indicate absolute quantities.
  • 8. Ordinal Level Nachmias-Nachmias (2000) Has three important logical properties: 1. Irreflexive For any value of a, a > a For any a, it is not true that a > a 2. Asymmetry If a > b, then b > a 3. Transitivity If a > b and b > c, then a > c
  • 12. Ordinal Level Nachmias-Nachmias (2000) ● Surveys use ordinal scales. ● Ex: Political efficacy question: Do you agree with the following statement? “People like me have a lot of influence on gov't decisions.”
  • 13. Interval Level Nachmias-Nachmias (2000) Interval level measurements are characterized by a common and constant, fixed and equal unit of measurement that assigns a real number to all the objects in the ordered set.
  • 14. Interval Level Nachmias-Nachmias (2000) Interval level measurements are isomorphic, meaning there is similarity or identity in structure between the properties of a variable and the properties of the instrument used to measure it.
  • 15. Properties of interval measures Nachmias-Nachmias (2000) 1. Uniqueness: If a and b stand for real numbers, then a + b and a * b represent only one real number. 2. Symmetry: If a = b, then b = a 3. Commutation: If a and b denote real numbers, then a + b = b + a.
  • 16. Properties of interval measures Nachmias-Nachmias (2000) 4. Substitution: If a = b and a + c = d, then b + c = d; and if a = b and ac = d, then bc = d 5. Association: If a, b and c stand for real numbers, then (a + b) + c = a + (b + c), and (ab)c = a(bc) Examples: Income, SAT scores, years
  • 17. Ratio Level Nachmias-Nachmias (2000) The ratio level of measurement has the same properties as the interval level with one exception: the absolute zero point. In other words, we apply the arithmetic operations and numbers to the total amount measured from the absolute zero point, not some arbitrary point. Examples: Weight, age, unemployment rate, % vote