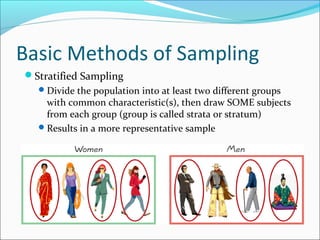
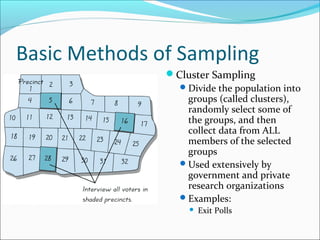
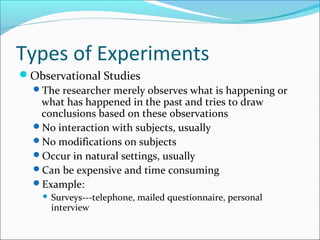
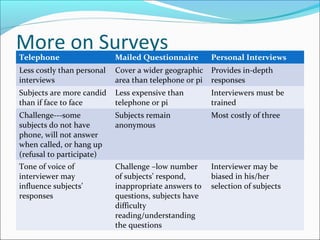
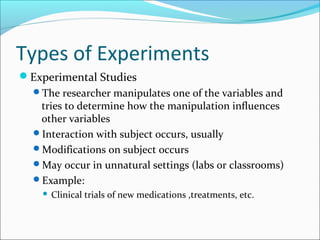
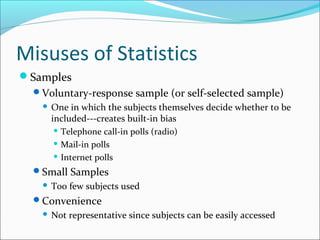
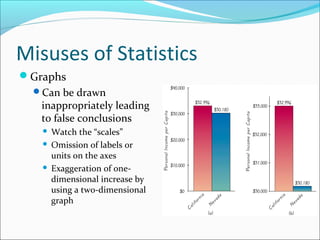
Section 1-4
Objectives
Identify the five basic sample techniques
Data Collection
In research, statisticians use data in many different
ways.
Data can be used to describe situations.
Data can be collected in a variety of ways, BUT if the
sample data is not collected in an appropriate way,
the data may be so completely useless that no amount
of statistical torturing can salvage them.
Basic Methods of Sampling
Random Sampling
Selected by using
chance or random
numbers
Each individual subject
(human or otherwise)
has an equal chance of
being selected
Examples:
 Drawing names from a hat
 Random Numbers
Basic Methods of Sampling
Systematic Sampling
Select a random starting point and then select every kth
subject in the population
Simple to use so it is used often
Basic Methods of Sampling
Convenience Sampling
Use subjects that are easily accessible
Examples:
 Using family members or students in a classroom
 Mall shoppers
Basic Methods of Sampling
Stratified Sampling
Divide the population into at least two different groups
with common characteristic(s), then draw SOME subjects
from each group (group is called strata or stratum)
Results in a more representative sample
Basic Methods of Sampling
Cluster Sampling
Divide the population into
groups (called clusters),
randomly select some of
the groups, and then
collect data from ALL
members of the selected
groups
Used extensively by
government and private
research organizations
Examples:
 Exit Polls
Section 1-5
Objectives
Explain the difference between an observational and
an experimental study
Types of Experiments
Observational Studies
The researcher merely observes what is happening or
what has happened in the past and tries to draw
conclusions based on these observations
No interaction with subjects, usually
No modifications on subjects
Occur in natural settings, usually
Can be expensive and time consuming
Example:
 Surveys---telephone, mailed questionnaire, personal
interview
More on SurveysTelephone Mailed Questionnaire Personal Interviews
Less costly than personal
interviews
Cover a wider geographic
area than telephone or pi
Provides in-depth
responses
Subjects are more candid
than if face to face
Less expensive than
telephone or pi
Interviewers must be
trained
Challenge---some
subjects do not have
phone, will not answer
when called, or hang up
(refusal to participate)
Subjects remain
anonymous
Most costly of three
Tone of voice of
interviewer may
influence subjects’
responses
Challenge –low number
of subjects’ respond,
inappropriate answers to
questions, subjects have
difficulty
reading/understanding
the questions
Interviewer may be
biased in his/her
selection of subjects
Types of Experiments
Experimental Studies
The researcher manipulates one of the variables and
tries to determine how the manipulation influences
other variables
Interaction with subject occurs, usually
Modifications on subject occurs
May occur in unnatural settings (labs or classrooms)
Example:
 Clinical trials of new medications ,treatments, etc.
Section 1-6
Objectives
Explain how statistics can be used and misused
Uses of Statistics
Describe data
Compare two or more data sets
Determine if a relationship exists between variables
Test hypothesis (educated guess)
Make estimates about population characteristics
Predict past or future behavior of data
Use of statistics can be impressive to employers.
Almost all fields of human endeavor benefit from the
application of statistical method; however, the
misuses of statistics are just as abundant, if not more
so!
“There are three types of lies---lies, damn lies, and
statistics” Benjamin Disraeli
“Figures don’t lie, but liars figure”
“Statistics can be used to support anything
---especially statisticians” Franklin P. Jones
Sources of Misuse
There are two main sources of misuse of statistics:
Evil intent on part of a dishonest researcher
Unintentional errors (stupidity) on part of a researcher
who does not know any better
Misuses of Statistics
Samples
Voluntary-response sample (or self-selected sample)
 One in which the subjects themselves decide whether to be
included---creates built-in bias
 Telephone call-in polls (radio)
 Mail-in polls
 Internet polls
Small Samples
 Too few subjects used
Convenience
 Not representative since subjects can be easily accessed
Misuses of Statistics
Graphs
Can be drawn
inappropriately leading
to false conclusions
 Watch the “scales”
 Omission of labels or
units on the axes
 Exaggeration of one-
dimensional increase by
using a two-dimensional
graph
Misuses of Statistics
Survey Questions
Loaded Questions---unintentional wording to elicit a
desired response
Order of Questions
Nonresponse (Refusal)—subject refuses to answer
questions
Self-Interest ---Sponsor of the survey could enjoy
monetary gains from the results
Misuses of Statistics
Missing Data (Partial Pictures)
Detached Statistics ---no comparison is made
Percentages --
Precise Numbers
People believe this implies accuracy
Implied Connections
Correlation and Causality –when we find a statistical
association between two variables, we cannot conclude
that one of the variables is the cause of (or directly
affects) the other variable
Assignment

Data gathering section1.1

  • 1.
  • 2.
    Objectives Identify the fivebasic sample techniques
  • 3.
    Data Collection In research,statisticians use data in many different ways. Data can be used to describe situations. Data can be collected in a variety of ways, BUT if the sample data is not collected in an appropriate way, the data may be so completely useless that no amount of statistical torturing can salvage them.
  • 5.
    Basic Methods ofSampling Random Sampling Selected by using chance or random numbers Each individual subject (human or otherwise) has an equal chance of being selected Examples:  Drawing names from a hat  Random Numbers
  • 6.
    Basic Methods ofSampling Systematic Sampling Select a random starting point and then select every kth subject in the population Simple to use so it is used often
  • 7.
    Basic Methods ofSampling Convenience Sampling Use subjects that are easily accessible Examples:  Using family members or students in a classroom  Mall shoppers
  • 8.
    Basic Methods ofSampling Stratified Sampling Divide the population into at least two different groups with common characteristic(s), then draw SOME subjects from each group (group is called strata or stratum) Results in a more representative sample
  • 9.
    Basic Methods ofSampling Cluster Sampling Divide the population into groups (called clusters), randomly select some of the groups, and then collect data from ALL members of the selected groups Used extensively by government and private research organizations Examples:  Exit Polls
  • 10.
  • 11.
    Objectives Explain the differencebetween an observational and an experimental study
  • 12.
    Types of Experiments ObservationalStudies The researcher merely observes what is happening or what has happened in the past and tries to draw conclusions based on these observations No interaction with subjects, usually No modifications on subjects Occur in natural settings, usually Can be expensive and time consuming Example:  Surveys---telephone, mailed questionnaire, personal interview
  • 13.
    More on SurveysTelephoneMailed Questionnaire Personal Interviews Less costly than personal interviews Cover a wider geographic area than telephone or pi Provides in-depth responses Subjects are more candid than if face to face Less expensive than telephone or pi Interviewers must be trained Challenge---some subjects do not have phone, will not answer when called, or hang up (refusal to participate) Subjects remain anonymous Most costly of three Tone of voice of interviewer may influence subjects’ responses Challenge –low number of subjects’ respond, inappropriate answers to questions, subjects have difficulty reading/understanding the questions Interviewer may be biased in his/her selection of subjects
  • 14.
    Types of Experiments ExperimentalStudies The researcher manipulates one of the variables and tries to determine how the manipulation influences other variables Interaction with subject occurs, usually Modifications on subject occurs May occur in unnatural settings (labs or classrooms) Example:  Clinical trials of new medications ,treatments, etc.
  • 15.
  • 16.
  • 17.
    Uses of Statistics Describedata Compare two or more data sets Determine if a relationship exists between variables Test hypothesis (educated guess) Make estimates about population characteristics Predict past or future behavior of data Use of statistics can be impressive to employers.
  • 18.
    Almost all fieldsof human endeavor benefit from the application of statistical method; however, the misuses of statistics are just as abundant, if not more so! “There are three types of lies---lies, damn lies, and statistics” Benjamin Disraeli “Figures don’t lie, but liars figure” “Statistics can be used to support anything ---especially statisticians” Franklin P. Jones
  • 19.
    Sources of Misuse Thereare two main sources of misuse of statistics: Evil intent on part of a dishonest researcher Unintentional errors (stupidity) on part of a researcher who does not know any better
  • 20.
    Misuses of Statistics Samples Voluntary-responsesample (or self-selected sample)  One in which the subjects themselves decide whether to be included---creates built-in bias  Telephone call-in polls (radio)  Mail-in polls  Internet polls Small Samples  Too few subjects used Convenience  Not representative since subjects can be easily accessed
  • 21.
    Misuses of Statistics Graphs Canbe drawn inappropriately leading to false conclusions  Watch the “scales”  Omission of labels or units on the axes  Exaggeration of one- dimensional increase by using a two-dimensional graph
  • 23.
    Misuses of Statistics SurveyQuestions Loaded Questions---unintentional wording to elicit a desired response Order of Questions Nonresponse (Refusal)—subject refuses to answer questions Self-Interest ---Sponsor of the survey could enjoy monetary gains from the results
  • 24.
    Misuses of Statistics MissingData (Partial Pictures) Detached Statistics ---no comparison is made Percentages -- Precise Numbers People believe this implies accuracy Implied Connections Correlation and Causality –when we find a statistical association between two variables, we cannot conclude that one of the variables is the cause of (or directly affects) the other variable
  • 25.