STATISTICS
SUBTOPICS
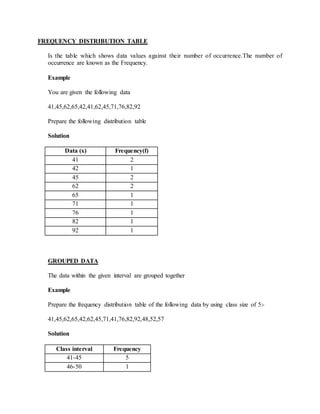
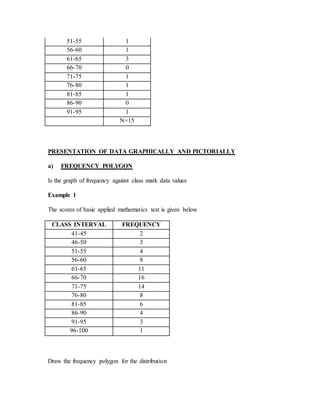
1. Collection, organization, and presentation of data
2. Measures of central tendency
3. Measures of dispersion
4. Application of statistics
COLLECTION, ORGANIZATION AND PRESENTATION OF DATA
Collection of data
We collect data by
i) Observation
ii) Interview
iii) Questionnaires
iv) Focus group discussion
v) Experiments
vi) Portfolio
Organization of data
We organize data by
i) Rank order list
ii) Frequency distribution table
iii) Histogram
iv) Frequency polygon
FREQUENCY DISTRIBUTION TABLE
Is the table which shows data values against their number of occurrence.The number of
occurrence are known as the Frequency.
Example
You are given the following data
41,45,62,65,42,41,62,45,71,76,82,92
Prepare the following distribution table
Solution
Data (x) Frequency(f)
41 2
42 1
45 2
62 2
65 1
71 1
76 1
82 1
92 1
GROUPED DATA
The data within the given interval are grouped together
Example
Prepare the frequency distribution table of the following data by using class size of 5:-
41,45,62,65,42,62,45,71,41,76,82,92,48,52,57
Solution
Class interval Frequency
41-45 5
46-50 1
51-55 1
56-60 1
61-65 3
66-70 0
71-75 1
76-80 1
81-85 1
86-90 0
91-95 1
N=15
PRESENTATION OF DATA GRAPHICALLY AND PICTORIALLY
a) FREQUENCY POLYGON
Is the graph of frequency against class mark data values
Example 1
The scores of basic applied mathematics test is given below
CLASS INTERVAL FREQUENCY
41-45 2
46-50 3
51-55 4
56-60 8
61-65 11
66-70 16
71-75 14
76-80 8
81-85 6
86-90 4
91-95 3
96-100 1
Draw the frequency polygon for the distribution
Solution
Procedures
i) Class marks (find)
ii) Plot the graph of frequency against the class marks
iii) Join the points by using a ruler
iv) Add one class below the lowest class interval and assign it with (0) zero frequency
v) Add one class above the highest class interval and assign it with (0) zero frequency
vi) Now join the added classes together with procedure (iii)
CLASS INTERVAL FREQUENCY CLASS MARK
41-45 2 43
46-50 3 48
51-55 4 53
56-60 8 58
61-65 11 63
66-70 16 68
71-75 14 73
76-80 8 78
81-85 6 83
86-90 4 88
91-95 3 93
96-100 1 98
b)HISTOGRAM
Is the graph of frequency against the class mark or data values represented by rectangles.
Example 2:
By using the table in example 1 in the previous page, construct the histogram
Solution
MEASURES OF CENTRAL TENDENCY
a) Mode
Is the data with the highest frequency
Example
50,34,40,52,34,66,41,67,70,81,90,42,35,45
The mode is 34
THE MODE OF GROUPED DATA
Mode= L +
Where by
L= Lower boundary of the model class
∆1=Excess frequency of the modal class to the next lower class interval
∆2=Excess frequency of the modal class to the next upper class interval
C= class interval /class size
Example 1
The scores in a geography examination were recorded as follows
SCORES 30-34 30-34
35-
39 40-44 45-49 50-54 55-59 60-64 65-69 70-79 80-84
F 3 5 7 8 16 10 9 8 6 4 3
Find the mode of the following frequency distribution
Solution
Modal class is 50-54
L=49.5
∆1=16-8=8
∆2=16-10=6
C = 5
Mode = L +
= 49.5 +
= 49.5 +
= 49.5 +
=49.4+2.9
=52.4
b) Median
This is the middle data or middle value
Example
Find the median from the given distribution
i) 14, 8, 9, 6,15,16,19
ii) 2,5,6,10,9,7
Solution
i) Arrange the given data in ascending data or descending order
= 6, 8,9,14,15,16,19
The median is 14
ii) 2,5,6,7,9,10
= = = 6.5
The median is 6.5
THE MEDIAN OF GROUPED DATA
Median = L +
Where by
L=lower boundary of the median class
N=total frequency
na =Total no of frequency below the median class
nm =frequency of the median class
C=class size
Example 2
The scores of a geography examinations data are as the one in example 1
Find the median of the frequency distribution
Given data
N=80 N/2=40
Median classes is 55-59
L=54.5, na = 39
nm =10, c=5
Median = L + c
=54.5 +
=54.5+
= 54.5+0.5
= 55
EXERCISE
1. The scores of mathematics subject of 100 students were recorded as follows
SCORES 51-55 56-60 61-65 66-70 71-75 76-80 81-85 86-90
F 2 10 22 34 15 10 6 1
Calculate
a) Mode
b) Median score
Solution
a) Mode = L +
Modal class is 66-70
L = 65.5
= 34 – 22 = 12
= 34– 15 = 19
C = 5
= 65.5 +
= 65.5 +
=65.5+1.94
= 67.44
b) Median score = L+
N=100 N/2=50
Median class is 66-70
L= 65.5, na=34
nm=34, c=5
=65.5 +
= 65.5+(0.47)5
= 65.5+2.35
= 67.85
2 .The age of children in month were recorded as follows
Age(month 5-10 11-16 17-22 23-28 29-34 35-40 41-46
f 26 28 18 12 9 4 4
Calculate the
a) mode
b) Median
Solution
a) Mode = L+ c
Modal class is 11-16
l=10.5
∆1=28-26 = 2
∆2=28-18=10
c = 6
= 10.5 +
= 10.5 + (
10.5+ (
=10.5 + 1
= 11.5
b) Median age = L +
N=100, N/2=50
Median age=11-16
L= 10.5, na =26
nm=28, c=6
= 10.5+
= 10.5+ (0.86)6
=10.5+5.16
=15.66
C.MEAN
Is the ratio of the sum of the data given to the total number of observations.
I.e. = =
Example
Calculate the mean of the following
33, 40, 44,35,46,50
Solution
= = =
= 41.3
THE MEAN OF GROUPED DATA
When dealing with grouped data
=
Where x is the class mark
EXAMPLE
Calculate the mean score of the following distribution
SCORES 55-59 60-64 65-69 70-74 75-79 80-84
F 5 7 16 6 4 2
Solution
SCORES CLASS MARK (x) f fx
55-59 57 5 285
60-64 62 7 434
65-69 67 16 1072
70-74 72 6 432
75-79 77 4 308
80-84 82 2 164
=40 = 2695
Mean=
=
= 67.38
= 67.38
ASSUMED MEAN METHOD
The following method is used
X= A +
Where A= Assumed Mean
f= frequency
d = deviation from assumed mean
N = total frequency
From the same example 3 let it be
Example 4.
Calculate the mean by using assumed mean method
Solution
SCORES x f d=x-A fd
55-59 57 5 -10 -50
60-64 62 7 -5 -35
65-69 67 16 0 0
70-74 72 6 5 30
75-79 77 4 10 40
80-84 82 2 15 30
N=40 =15
Take: A =67
= 67 +
= 67 + 0.38
= 67.38
EXERCISE 2
1. Calculate the mean weight of the following population
WEIGHT
(KG)
40-44 45-49 50-54 55-59 60-64 65-69 70-74 75-79
FREQUENCY 2 5 6 8 6 5 3 2
Solution
Mean =
SCORES CLASS MARK(x) f fx
40-44 42 2 235
45-49 47 5 312
50-54 52 6 456
55-59 57 8 372
60-64 62 6 335
65-69 67 5 216
70-74 72 3 154
75-79 77 2 ∑fx=2164
2. Find the mean of the following frequency distribution
CLASS
INTERVAL
85-89 90-94 95-99 100-104 105-109 110-114
F 4 14 32 28 17 5
SCORES CLASS MARK(x) f fx
85-89 87 4 348
90-94 92 14 1288
95-99 97 32 3104
100-104 102 28 2856
105-109 107 17 1819
110-114 112 5 560
100 9975
=
=
X= 99.75
THE MEAN BY USING CODING METHOD
PROCEDURES
· Choose the convenient value of x nearby the middle of the range
· Subtract it from every value of x
· Divide by the class size to get the coded value of x i.e. x/c
· Find the product of xc and f i.e. xc f
· Find the mean of xc i.e.
· Find the true mean
Example
Calculate the mean of the following distribution by using coding method
SCORES 55-59 60-64 65-69 70-74 75-79 80-84
F 5 7 16 6 4 2
SCORES x f d=x-A xc=d/c xcf
55-59 57 5 -10 -2 -10
60-64 62 7 -5 -5 -7
65-69 67 16 0 0 0
70-74 72 6 5 1 6
75-79 77 4 10 2 8
80-84 82 2 15 3 6
N=40 =3
A = 67
= = = 0.075
= 0.075
But - A = .c
= .c + A
= 0.075 x 5 + 67
= 67.375
EXERCISE
1. By using the coding method calculate the weight of the following population
WEIGHT(KG 40-44 45-49 50-54 55-59 60-64 65-69 70-74 75-79
F 2 5 6 8 6 5 3 2
WEIGHT(KG x f d=x-A xc=d/c xcf
40-44 42 2 -15 -3 -6
45-49 47 5 -10 -2 -10
50-54 52 6 -5 -1 -6
55-59 57 8 0 0 0
60-64 62 6 5 1 6
65-69 67 5 10 2 10
70-74 72 3 15 3 9
75-79 77 2 20 4 8
N=37 =11
A = 57
=
=
= 0.297
BUT – A = . c
= .c + A
= 0.297 x 5 + 57
= 58.486
2. Find the mean of the following frequency distribution by using coding method
Class
interval
85-89 90-94 95-99 100-104 105-109 110-114
frequency 4 14 32 28 17 5
Class interval x f d=x-A xc=d/c xcf
85-89 87 4 -10 -2 -8
90-94 92 14 -5 -1 -14
95-99 97 32 0 0 0
100-104 102 28 5 1 28
105-109 107 17 10 2 34
110-114 112 5 15 3 15
N=100 f =55
A = 97
=
=
= 0.55
But
- A = . c
= .c + A
= 0.55 x 5 + 97
= 2.75 + 97
= 99.75
QUARTILES AND PERCENTILES
QUARTILES
Divides the distribution into four (4) equal parts
NOTE
i. The value which corresponds to N/4 is called the lower quartile i.e. Q4)
ii. The value which corresponds to N/2 is called the median i.e.(Q2)
iii. The value which corresponds to 3N/4 is called the upper Quartile i.e.(Q3)
iv. The difference between the upper quartile and the lower quartile is known as the
inter quartile range
Example
From the following distribution find
i) Upper quartile
ii) Lower quartile
iii) Inter quartile range
30,25,66,19,44,45,52,53,37,65,57,44,33,80,76,71,40,50,38,33
Solution
N=20
3/4N= x 20 = 15
Arranging the value in ascending order
19,25.30,33,33,37,38,40,44,44,45,50,52,53,57,65,66,71,76,80
The fifteenth value is 57 i.e. the upper quartile is 57
ii) Lower quartile
N/4=20/4=5
The lower quartile is 33
iii) Inter quartile range
(Upper quartile-lower quartile)
QR =Qu - QL
= 57 - 33
= 24
QUARTILE FOR GROUPED DATA
· Lower quartile (QL)
This is given by
QL = L (L) + c
Where
L (L) =lower boundary of the lower quartile class
N = total number of frequency
na = total frequency below lower quartile class
nc = frequency in the lower quartile class
C = Class size
· UPPER QUARTILE (Qu)
This is given by
Where
Lu = is the lower boundary of upper quartile class
nu = frequency in the upper quartile class
Example
For the given data below
i) Lower ii) upper quartile iii) inter Quartile range
SCORES 11-20 21-30 31-40 41-50 51-60 61-70 71-80 81-90 91-100
F 1 2 7 21 27 22 17 2 1
Solution
i) Lower quartile
QL = Lu + c
N=100
N/4=25
Lower quartile class is 4.50
LL=40.5, na=10, nl=21, c=10
QL = 40.5 + 10
QL =40.5+
QL=40.5+7.14
QL = 47.64
ii) Upper quartile (Qu)
Lu=60.5, na =58, nu=22, c=10
3/4n=3/4 x 100
Qu=60.5+ 10
Qu=60.5+ (0.773x10)
Qu=60.5+7.727
Qu=68.227
iii) Inter-quartile range
QR = QU - QL
= 68.227- 47.64 = 20.59
PERCENTILES FOR GROUPED DATA
Percentiles
Divided the distribution into hundred (100) equal parts iep
1
p
2,
p
3,
P
4,
P
5 ……………………….
p
100
Note
i) The value which corresponds to is called lower percentile
ii) The value which corresponds to is called the median
iii) The value which corresponds is called upper percentile
LOWER PERCENTILE (P1)
This is given by:
Where
Lp1= Lower boundary of the lower percentile class
N= Total numberof frequency
na=Total frequency belowlower percentile class
nl= Frequency in thepercentile class
c= Class size
Also the upper percentile class is given by
Where
L99= Lower boundary of the upperpercentile class
N= Total number offrequency
na=Total frequency belowupperpercentile class
nw= Frequency in the upperpercentile class
c= Class size
Measures of dispersion
The measures of dispersion of a distribution are
i) Range
ii) Variance
iii)Standard deviation
THE RANGE
Is the simplest measure of dispersion. The range of a set of data is the difference between the
highest and the lowest value
Example
Find the range of the following marks 36, 71, 25 ,93 ,84 ,46, 60, 17, 23,59
Solution
The lowest mark is 17
The highest mark 93
The range is 93- 17= 76
Questions
Describe the following terms with illustrations using the data set
3, 5, 2, 9, 2
(a) Range
(b) Mode
Variance and standard deviation
The standard deviation describe dispersion in term of amount or size by which measurement
differ or
deviate from their mean value. The mean of the squares or the deviation is called VARIANCE
denote by that is
The square root of variance gives by the standard deviation (STD) denoted by That is
In case of frequency distribution
The variance for the grouped data is given by
for i = 1, 2, 3……..n
The Standard deviation for the grouped data is given by
for i = 1, 2, 3……..n
It can be also shown that
Similarly may be written as
The corresponding formulae for the standard deviations are
Where
f is the frequency of each particular value
N is the total number of all frequencies
x is any value in a given set of data is the mean of the of the value
ExampleEvaluate the variance and standard deviation of the following frequency distribution:
Intervals 1-4 5-8 9-12 13-16 17-20
Frequency 3 5 9 12 7
Solution
To contract the more detailed frequency distribution table
Mean,
Variance, var(x)=
Standard deviation, STD x=
Exercise
1. Calculate the variance and standard deviation of the following distribution
Value 2 6 10 14 18
Frequency 14 25 19 7 3
2 . Calculate the variance and standard deviation of the following distribution
Value 1 2 3 4 5
Frequency 12 8 4 3 1
3 The frequency distribution table for Msolwa secondary school ground club is a given as
Matches 50-100 100-150 150-200 200-250 250-300 300-
350
Months 5 8 9 14 14 10
Find the variance and standard deviation
Application of statistics
i) Economics
ii) Business
iii) Agriculture
iv) Health
v) Education
vi) Sport and games
STATISTICS

STATISTICS

  • 1.
    STATISTICS SUBTOPICS 1. Collection, organization,and presentation of data 2. Measures of central tendency 3. Measures of dispersion 4. Application of statistics COLLECTION, ORGANIZATION AND PRESENTATION OF DATA Collection of data We collect data by i) Observation ii) Interview iii) Questionnaires iv) Focus group discussion v) Experiments vi) Portfolio Organization of data We organize data by i) Rank order list ii) Frequency distribution table iii) Histogram iv) Frequency polygon
  • 2.
    FREQUENCY DISTRIBUTION TABLE Isthe table which shows data values against their number of occurrence.The number of occurrence are known as the Frequency. Example You are given the following data 41,45,62,65,42,41,62,45,71,76,82,92 Prepare the following distribution table Solution Data (x) Frequency(f) 41 2 42 1 45 2 62 2 65 1 71 1 76 1 82 1 92 1 GROUPED DATA The data within the given interval are grouped together Example Prepare the frequency distribution table of the following data by using class size of 5:- 41,45,62,65,42,62,45,71,41,76,82,92,48,52,57 Solution Class interval Frequency 41-45 5 46-50 1
  • 3.
    51-55 1 56-60 1 61-653 66-70 0 71-75 1 76-80 1 81-85 1 86-90 0 91-95 1 N=15 PRESENTATION OF DATA GRAPHICALLY AND PICTORIALLY a) FREQUENCY POLYGON Is the graph of frequency against class mark data values Example 1 The scores of basic applied mathematics test is given below CLASS INTERVAL FREQUENCY 41-45 2 46-50 3 51-55 4 56-60 8 61-65 11 66-70 16 71-75 14 76-80 8 81-85 6 86-90 4 91-95 3 96-100 1 Draw the frequency polygon for the distribution
  • 4.
    Solution Procedures i) Class marks(find) ii) Plot the graph of frequency against the class marks iii) Join the points by using a ruler iv) Add one class below the lowest class interval and assign it with (0) zero frequency v) Add one class above the highest class interval and assign it with (0) zero frequency vi) Now join the added classes together with procedure (iii) CLASS INTERVAL FREQUENCY CLASS MARK 41-45 2 43 46-50 3 48 51-55 4 53 56-60 8 58 61-65 11 63 66-70 16 68 71-75 14 73 76-80 8 78 81-85 6 83 86-90 4 88 91-95 3 93 96-100 1 98
  • 5.
    b)HISTOGRAM Is the graphof frequency against the class mark or data values represented by rectangles. Example 2: By using the table in example 1 in the previous page, construct the histogram Solution
  • 6.
    MEASURES OF CENTRALTENDENCY a) Mode Is the data with the highest frequency Example 50,34,40,52,34,66,41,67,70,81,90,42,35,45 The mode is 34 THE MODE OF GROUPED DATA Mode= L + Where by L= Lower boundary of the model class
  • 7.
    ∆1=Excess frequency ofthe modal class to the next lower class interval ∆2=Excess frequency of the modal class to the next upper class interval C= class interval /class size Example 1 The scores in a geography examination were recorded as follows SCORES 30-34 30-34 35- 39 40-44 45-49 50-54 55-59 60-64 65-69 70-79 80-84 F 3 5 7 8 16 10 9 8 6 4 3 Find the mode of the following frequency distribution Solution Modal class is 50-54 L=49.5 ∆1=16-8=8 ∆2=16-10=6 C = 5 Mode = L + = 49.5 + = 49.5 + = 49.5 + =49.4+2.9 =52.4
  • 8.
    b) Median This isthe middle data or middle value Example Find the median from the given distribution i) 14, 8, 9, 6,15,16,19 ii) 2,5,6,10,9,7 Solution i) Arrange the given data in ascending data or descending order = 6, 8,9,14,15,16,19 The median is 14 ii) 2,5,6,7,9,10 = = = 6.5 The median is 6.5 THE MEDIAN OF GROUPED DATA Median = L + Where by L=lower boundary of the median class N=total frequency na =Total no of frequency below the median class nm =frequency of the median class C=class size
  • 9.
    Example 2 The scoresof a geography examinations data are as the one in example 1 Find the median of the frequency distribution Given data N=80 N/2=40 Median classes is 55-59 L=54.5, na = 39 nm =10, c=5 Median = L + c =54.5 + =54.5+ = 54.5+0.5 = 55 EXERCISE 1. The scores of mathematics subject of 100 students were recorded as follows SCORES 51-55 56-60 61-65 66-70 71-75 76-80 81-85 86-90 F 2 10 22 34 15 10 6 1 Calculate a) Mode b) Median score
  • 10.
    Solution a) Mode =L + Modal class is 66-70 L = 65.5 = 34 – 22 = 12 = 34– 15 = 19 C = 5 = 65.5 + = 65.5 + =65.5+1.94 = 67.44 b) Median score = L+ N=100 N/2=50 Median class is 66-70 L= 65.5, na=34 nm=34, c=5 =65.5 + = 65.5+(0.47)5 = 65.5+2.35 = 67.85
  • 11.
    2 .The ageof children in month were recorded as follows Age(month 5-10 11-16 17-22 23-28 29-34 35-40 41-46 f 26 28 18 12 9 4 4 Calculate the a) mode b) Median Solution a) Mode = L+ c Modal class is 11-16 l=10.5 ∆1=28-26 = 2 ∆2=28-18=10 c = 6 = 10.5 + = 10.5 + ( 10.5+ ( =10.5 + 1 = 11.5 b) Median age = L + N=100, N/2=50
  • 12.
    Median age=11-16 L= 10.5,na =26 nm=28, c=6 = 10.5+ = 10.5+ (0.86)6 =10.5+5.16 =15.66 C.MEAN Is the ratio of the sum of the data given to the total number of observations. I.e. = = Example Calculate the mean of the following 33, 40, 44,35,46,50 Solution = = = = 41.3 THE MEAN OF GROUPED DATA When dealing with grouped data = Where x is the class mark
  • 13.
    EXAMPLE Calculate the meanscore of the following distribution SCORES 55-59 60-64 65-69 70-74 75-79 80-84 F 5 7 16 6 4 2 Solution SCORES CLASS MARK (x) f fx 55-59 57 5 285 60-64 62 7 434 65-69 67 16 1072 70-74 72 6 432 75-79 77 4 308 80-84 82 2 164 =40 = 2695 Mean= = = 67.38 = 67.38 ASSUMED MEAN METHOD The following method is used X= A + Where A= Assumed Mean f= frequency d = deviation from assumed mean N = total frequency
  • 14.
    From the sameexample 3 let it be Example 4. Calculate the mean by using assumed mean method Solution SCORES x f d=x-A fd 55-59 57 5 -10 -50 60-64 62 7 -5 -35 65-69 67 16 0 0 70-74 72 6 5 30 75-79 77 4 10 40 80-84 82 2 15 30 N=40 =15 Take: A =67 = 67 + = 67 + 0.38 = 67.38 EXERCISE 2 1. Calculate the mean weight of the following population WEIGHT (KG) 40-44 45-49 50-54 55-59 60-64 65-69 70-74 75-79 FREQUENCY 2 5 6 8 6 5 3 2 Solution Mean = SCORES CLASS MARK(x) f fx 40-44 42 2 235 45-49 47 5 312 50-54 52 6 456
  • 15.
    55-59 57 8372 60-64 62 6 335 65-69 67 5 216 70-74 72 3 154 75-79 77 2 ∑fx=2164 2. Find the mean of the following frequency distribution CLASS INTERVAL 85-89 90-94 95-99 100-104 105-109 110-114 F 4 14 32 28 17 5 SCORES CLASS MARK(x) f fx 85-89 87 4 348 90-94 92 14 1288 95-99 97 32 3104 100-104 102 28 2856 105-109 107 17 1819 110-114 112 5 560 100 9975 = = X= 99.75
  • 16.
    THE MEAN BYUSING CODING METHOD PROCEDURES · Choose the convenient value of x nearby the middle of the range · Subtract it from every value of x · Divide by the class size to get the coded value of x i.e. x/c · Find the product of xc and f i.e. xc f · Find the mean of xc i.e. · Find the true mean Example Calculate the mean of the following distribution by using coding method SCORES 55-59 60-64 65-69 70-74 75-79 80-84 F 5 7 16 6 4 2 SCORES x f d=x-A xc=d/c xcf 55-59 57 5 -10 -2 -10 60-64 62 7 -5 -5 -7 65-69 67 16 0 0 0 70-74 72 6 5 1 6 75-79 77 4 10 2 8 80-84 82 2 15 3 6 N=40 =3 A = 67 = = = 0.075 = 0.075 But - A = .c
  • 17.
    = .c +A = 0.075 x 5 + 67 = 67.375 EXERCISE 1. By using the coding method calculate the weight of the following population WEIGHT(KG 40-44 45-49 50-54 55-59 60-64 65-69 70-74 75-79 F 2 5 6 8 6 5 3 2 WEIGHT(KG x f d=x-A xc=d/c xcf 40-44 42 2 -15 -3 -6 45-49 47 5 -10 -2 -10 50-54 52 6 -5 -1 -6 55-59 57 8 0 0 0 60-64 62 6 5 1 6 65-69 67 5 10 2 10 70-74 72 3 15 3 9 75-79 77 2 20 4 8 N=37 =11 A = 57 = = = 0.297 BUT – A = . c = .c + A = 0.297 x 5 + 57
  • 18.
    = 58.486 2. Findthe mean of the following frequency distribution by using coding method Class interval 85-89 90-94 95-99 100-104 105-109 110-114 frequency 4 14 32 28 17 5 Class interval x f d=x-A xc=d/c xcf 85-89 87 4 -10 -2 -8 90-94 92 14 -5 -1 -14 95-99 97 32 0 0 0 100-104 102 28 5 1 28 105-109 107 17 10 2 34 110-114 112 5 15 3 15 N=100 f =55 A = 97 = = = 0.55 But - A = . c = .c + A = 0.55 x 5 + 97 = 2.75 + 97 = 99.75
  • 19.
    QUARTILES AND PERCENTILES QUARTILES Dividesthe distribution into four (4) equal parts NOTE i. The value which corresponds to N/4 is called the lower quartile i.e. Q4) ii. The value which corresponds to N/2 is called the median i.e.(Q2) iii. The value which corresponds to 3N/4 is called the upper Quartile i.e.(Q3) iv. The difference between the upper quartile and the lower quartile is known as the inter quartile range Example From the following distribution find i) Upper quartile
  • 20.
    ii) Lower quartile iii)Inter quartile range 30,25,66,19,44,45,52,53,37,65,57,44,33,80,76,71,40,50,38,33 Solution N=20 3/4N= x 20 = 15 Arranging the value in ascending order 19,25.30,33,33,37,38,40,44,44,45,50,52,53,57,65,66,71,76,80 The fifteenth value is 57 i.e. the upper quartile is 57 ii) Lower quartile N/4=20/4=5 The lower quartile is 33 iii) Inter quartile range (Upper quartile-lower quartile) QR =Qu - QL = 57 - 33 = 24 QUARTILE FOR GROUPED DATA
  • 21.
    · Lower quartile(QL) This is given by QL = L (L) + c Where L (L) =lower boundary of the lower quartile class N = total number of frequency na = total frequency below lower quartile class nc = frequency in the lower quartile class C = Class size · UPPER QUARTILE (Qu) This is given by Where Lu = is the lower boundary of upper quartile class nu = frequency in the upper quartile class Example For the given data below i) Lower ii) upper quartile iii) inter Quartile range SCORES 11-20 21-30 31-40 41-50 51-60 61-70 71-80 81-90 91-100 F 1 2 7 21 27 22 17 2 1 Solution
  • 22.
    i) Lower quartile QL= Lu + c N=100 N/4=25 Lower quartile class is 4.50 LL=40.5, na=10, nl=21, c=10 QL = 40.5 + 10 QL =40.5+ QL=40.5+7.14 QL = 47.64 ii) Upper quartile (Qu) Lu=60.5, na =58, nu=22, c=10 3/4n=3/4 x 100 Qu=60.5+ 10 Qu=60.5+ (0.773x10) Qu=60.5+7.727 Qu=68.227 iii) Inter-quartile range QR = QU - QL
  • 23.
    = 68.227- 47.64= 20.59 PERCENTILES FOR GROUPED DATA Percentiles Divided the distribution into hundred (100) equal parts iep 1 p 2, p 3, P 4, P 5 ………………………. p 100 Note i) The value which corresponds to is called lower percentile ii) The value which corresponds to is called the median iii) The value which corresponds is called upper percentile LOWER PERCENTILE (P1) This is given by: Where Lp1= Lower boundary of the lower percentile class N= Total numberof frequency na=Total frequency belowlower percentile class nl= Frequency in thepercentile class c= Class size Also the upper percentile class is given by
  • 24.
    Where L99= Lower boundaryof the upperpercentile class N= Total number offrequency na=Total frequency belowupperpercentile class nw= Frequency in the upperpercentile class c= Class size Measures of dispersion The measures of dispersion of a distribution are i) Range ii) Variance iii)Standard deviation THE RANGE Is the simplest measure of dispersion. The range of a set of data is the difference between the highest and the lowest value Example Find the range of the following marks 36, 71, 25 ,93 ,84 ,46, 60, 17, 23,59 Solution The lowest mark is 17 The highest mark 93 The range is 93- 17= 76 Questions
  • 25.
    Describe the followingterms with illustrations using the data set 3, 5, 2, 9, 2 (a) Range (b) Mode Variance and standard deviation The standard deviation describe dispersion in term of amount or size by which measurement differ or deviate from their mean value. The mean of the squares or the deviation is called VARIANCE denote by that is The square root of variance gives by the standard deviation (STD) denoted by That is In case of frequency distribution The variance for the grouped data is given by for i = 1, 2, 3……..n The Standard deviation for the grouped data is given by for i = 1, 2, 3……..n It can be also shown that
  • 26.
    Similarly may bewritten as The corresponding formulae for the standard deviations are
  • 27.
    Where f is thefrequency of each particular value N is the total number of all frequencies x is any value in a given set of data is the mean of the of the value ExampleEvaluate the variance and standard deviation of the following frequency distribution: Intervals 1-4 5-8 9-12 13-16 17-20 Frequency 3 5 9 12 7 Solution To contract the more detailed frequency distribution table
  • 28.
    Mean, Variance, var(x)= Standard deviation,STD x= Exercise 1. Calculate the variance and standard deviation of the following distribution Value 2 6 10 14 18 Frequency 14 25 19 7 3 2 . Calculate the variance and standard deviation of the following distribution Value 1 2 3 4 5 Frequency 12 8 4 3 1 3 The frequency distribution table for Msolwa secondary school ground club is a given as Matches 50-100 100-150 150-200 200-250 250-300 300- 350 Months 5 8 9 14 14 10 Find the variance and standard deviation Application of statistics i) Economics ii) Business iii) Agriculture iv) Health v) Education vi) Sport and games