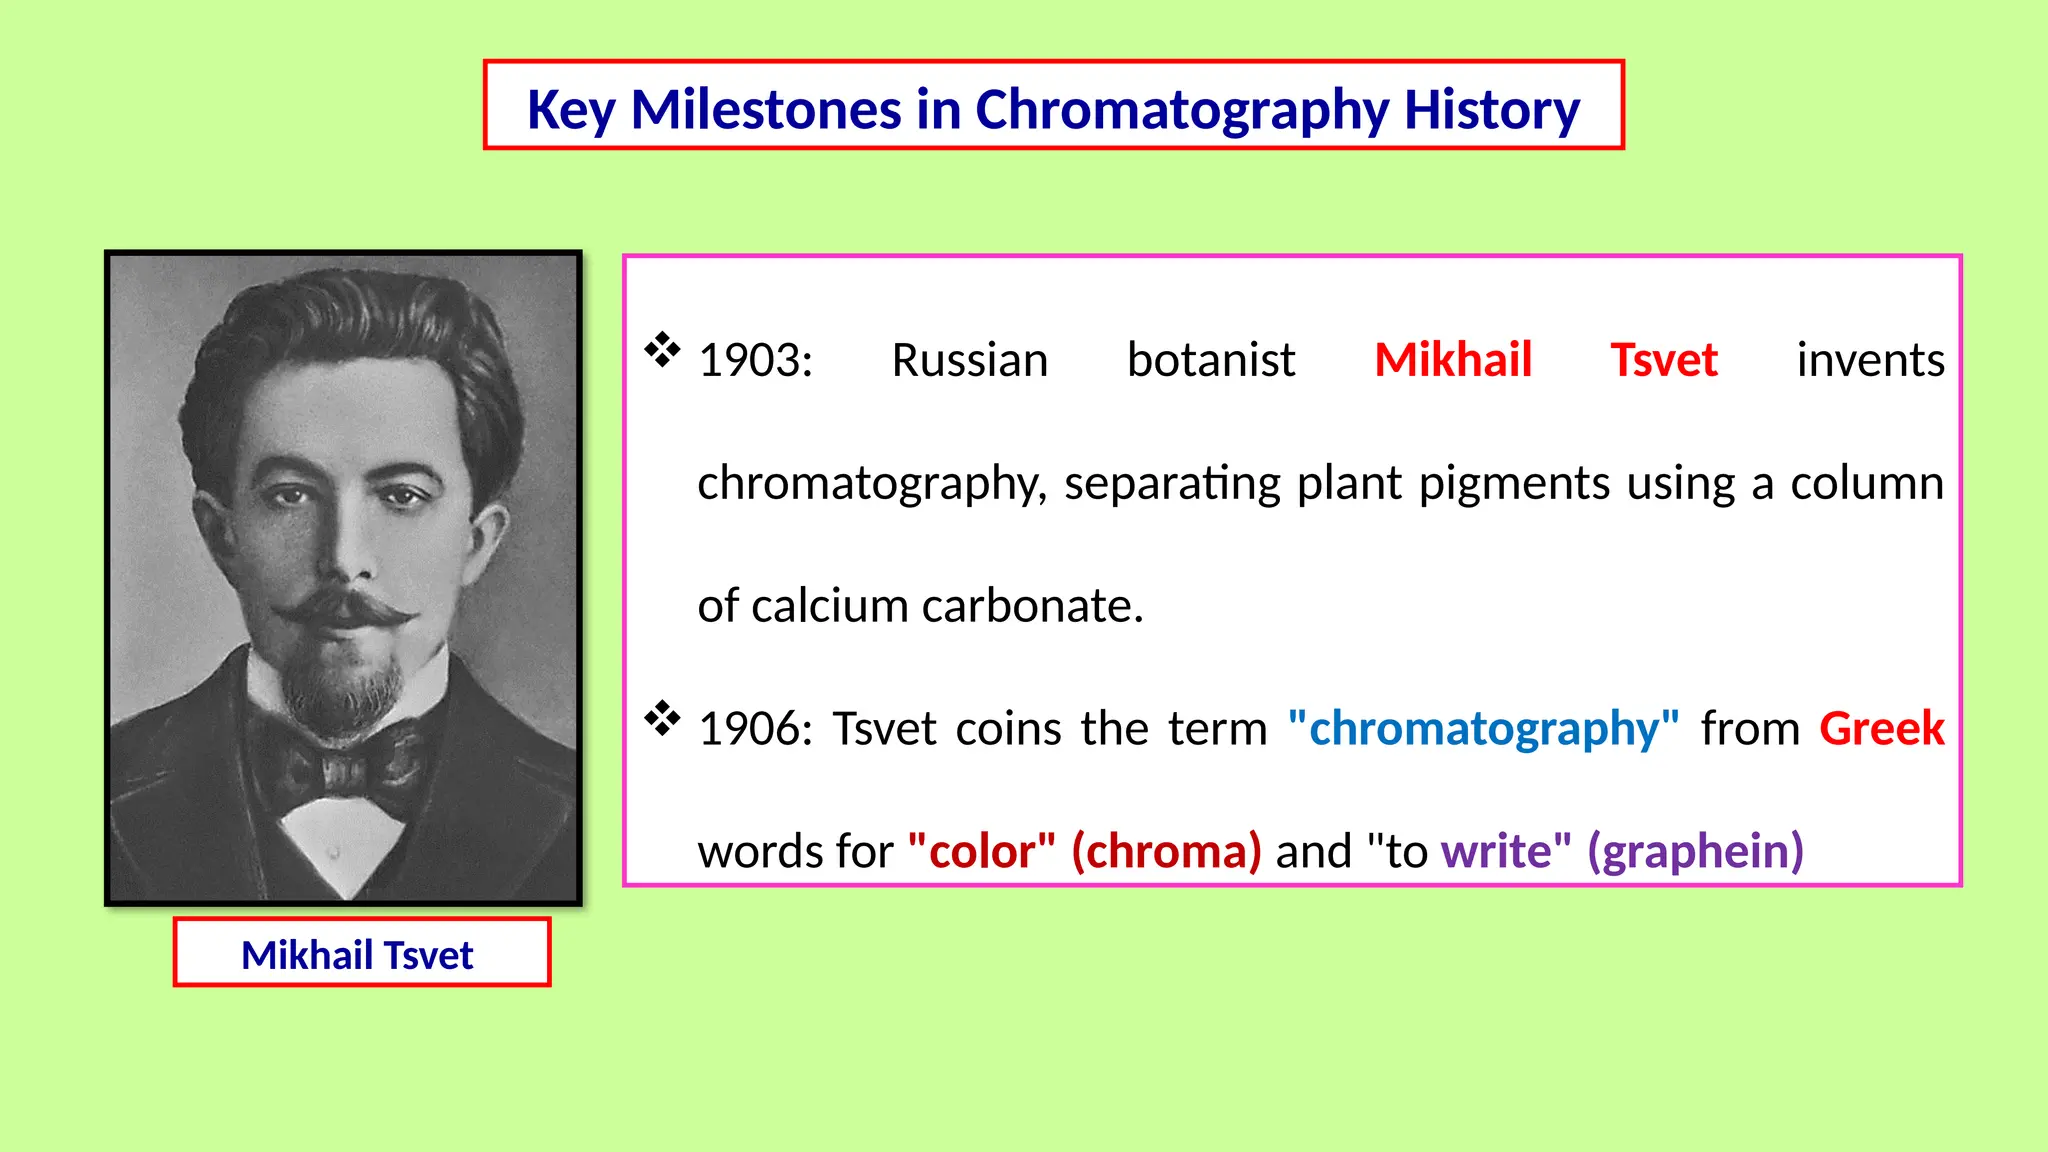
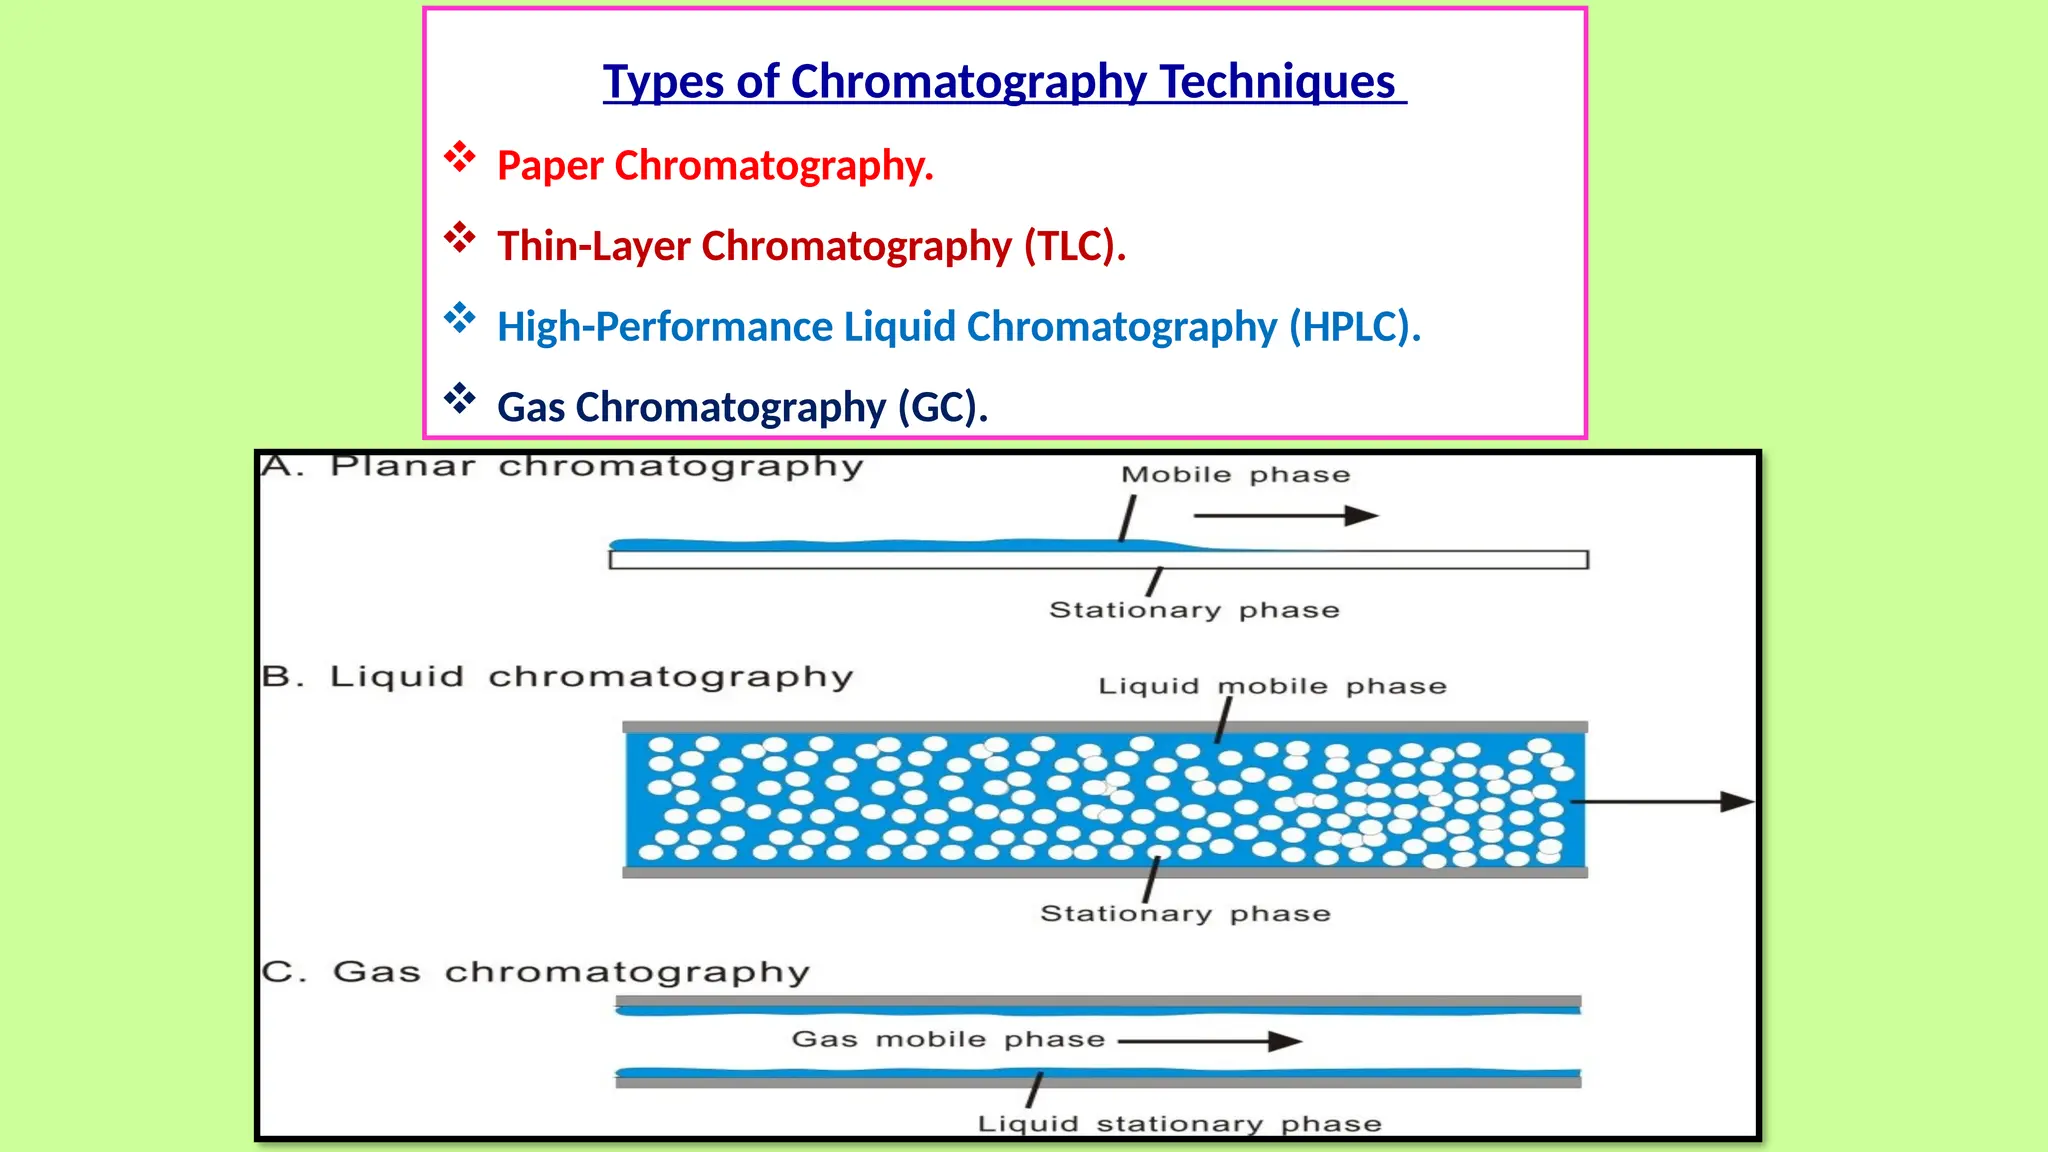
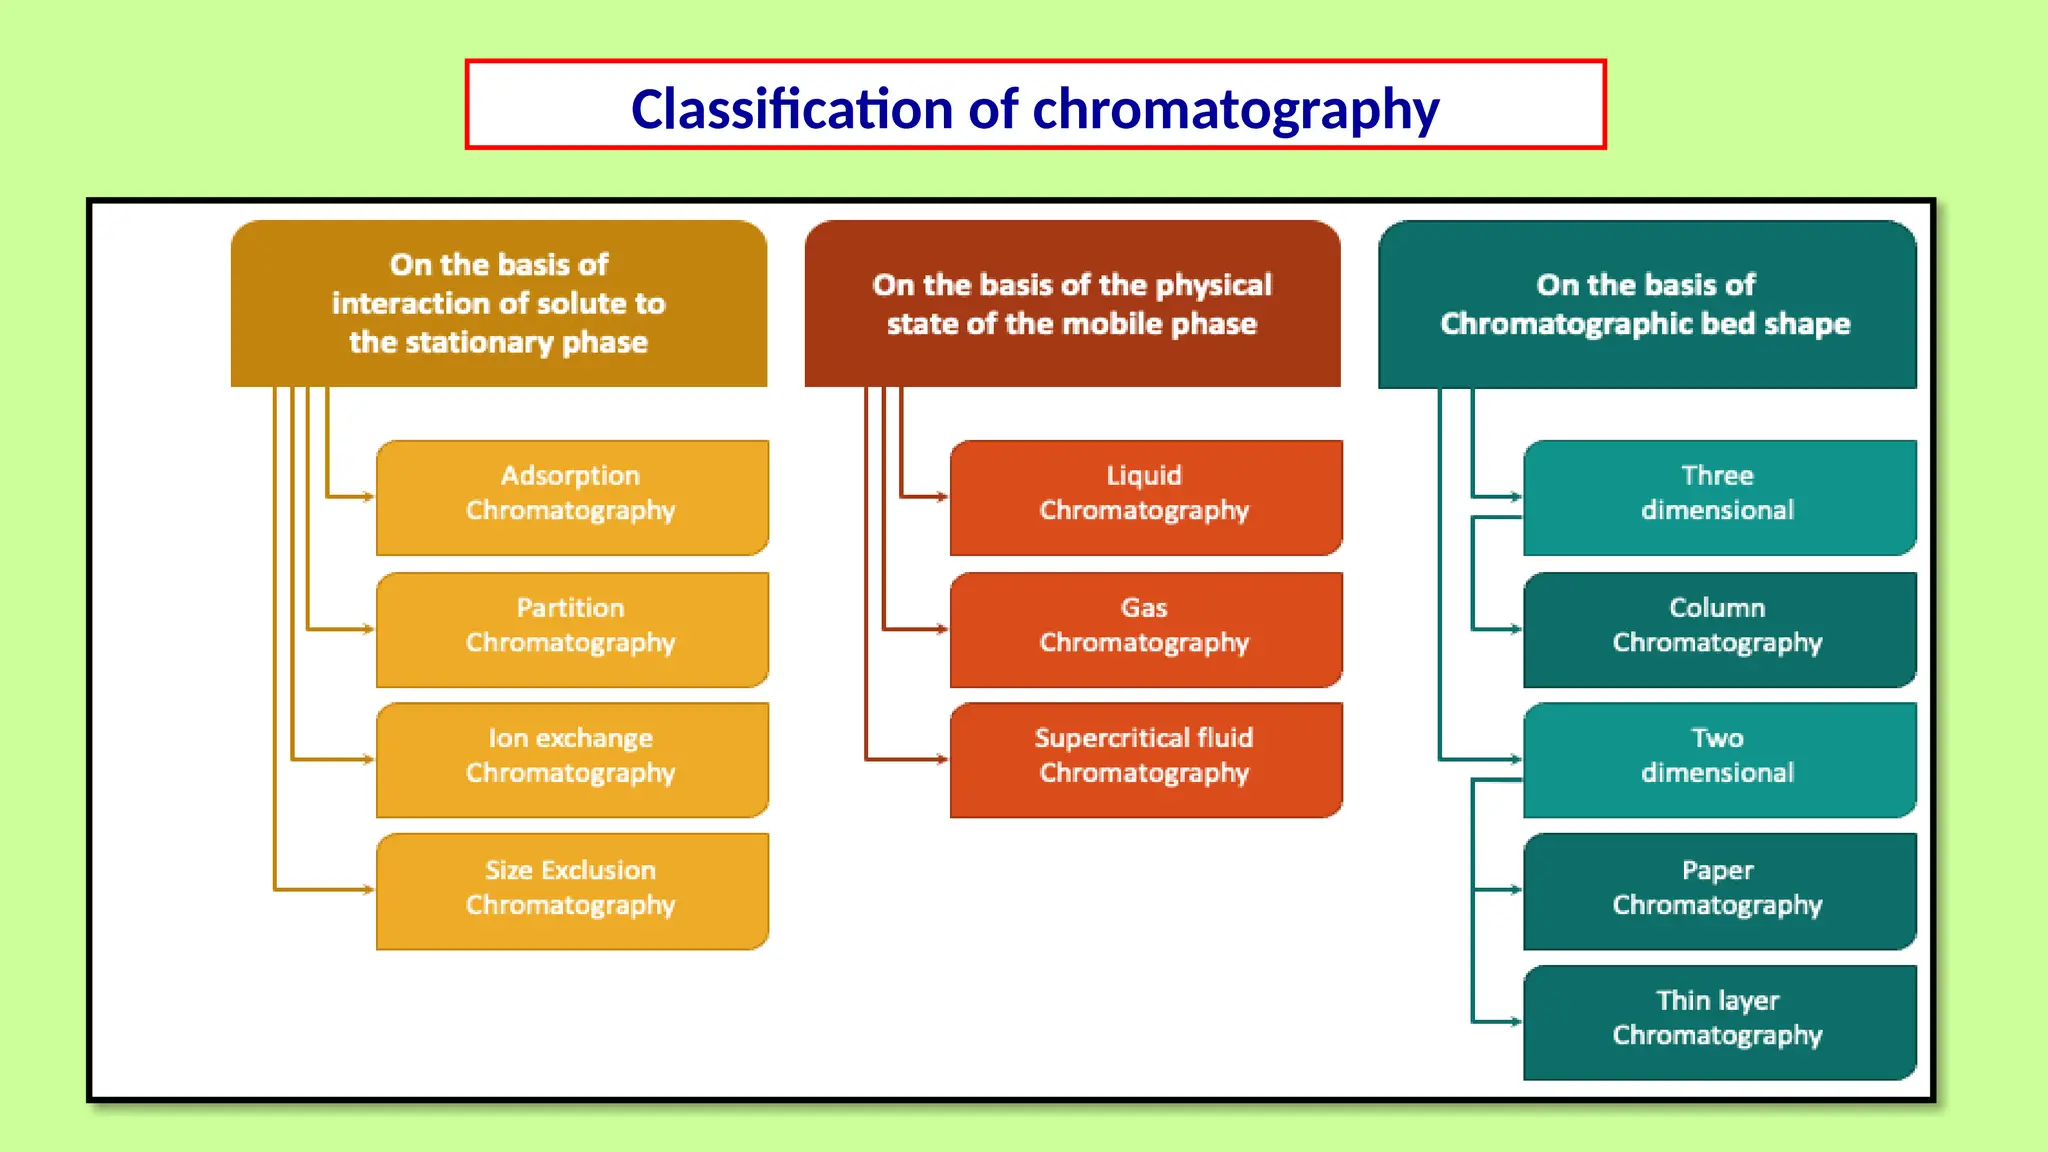
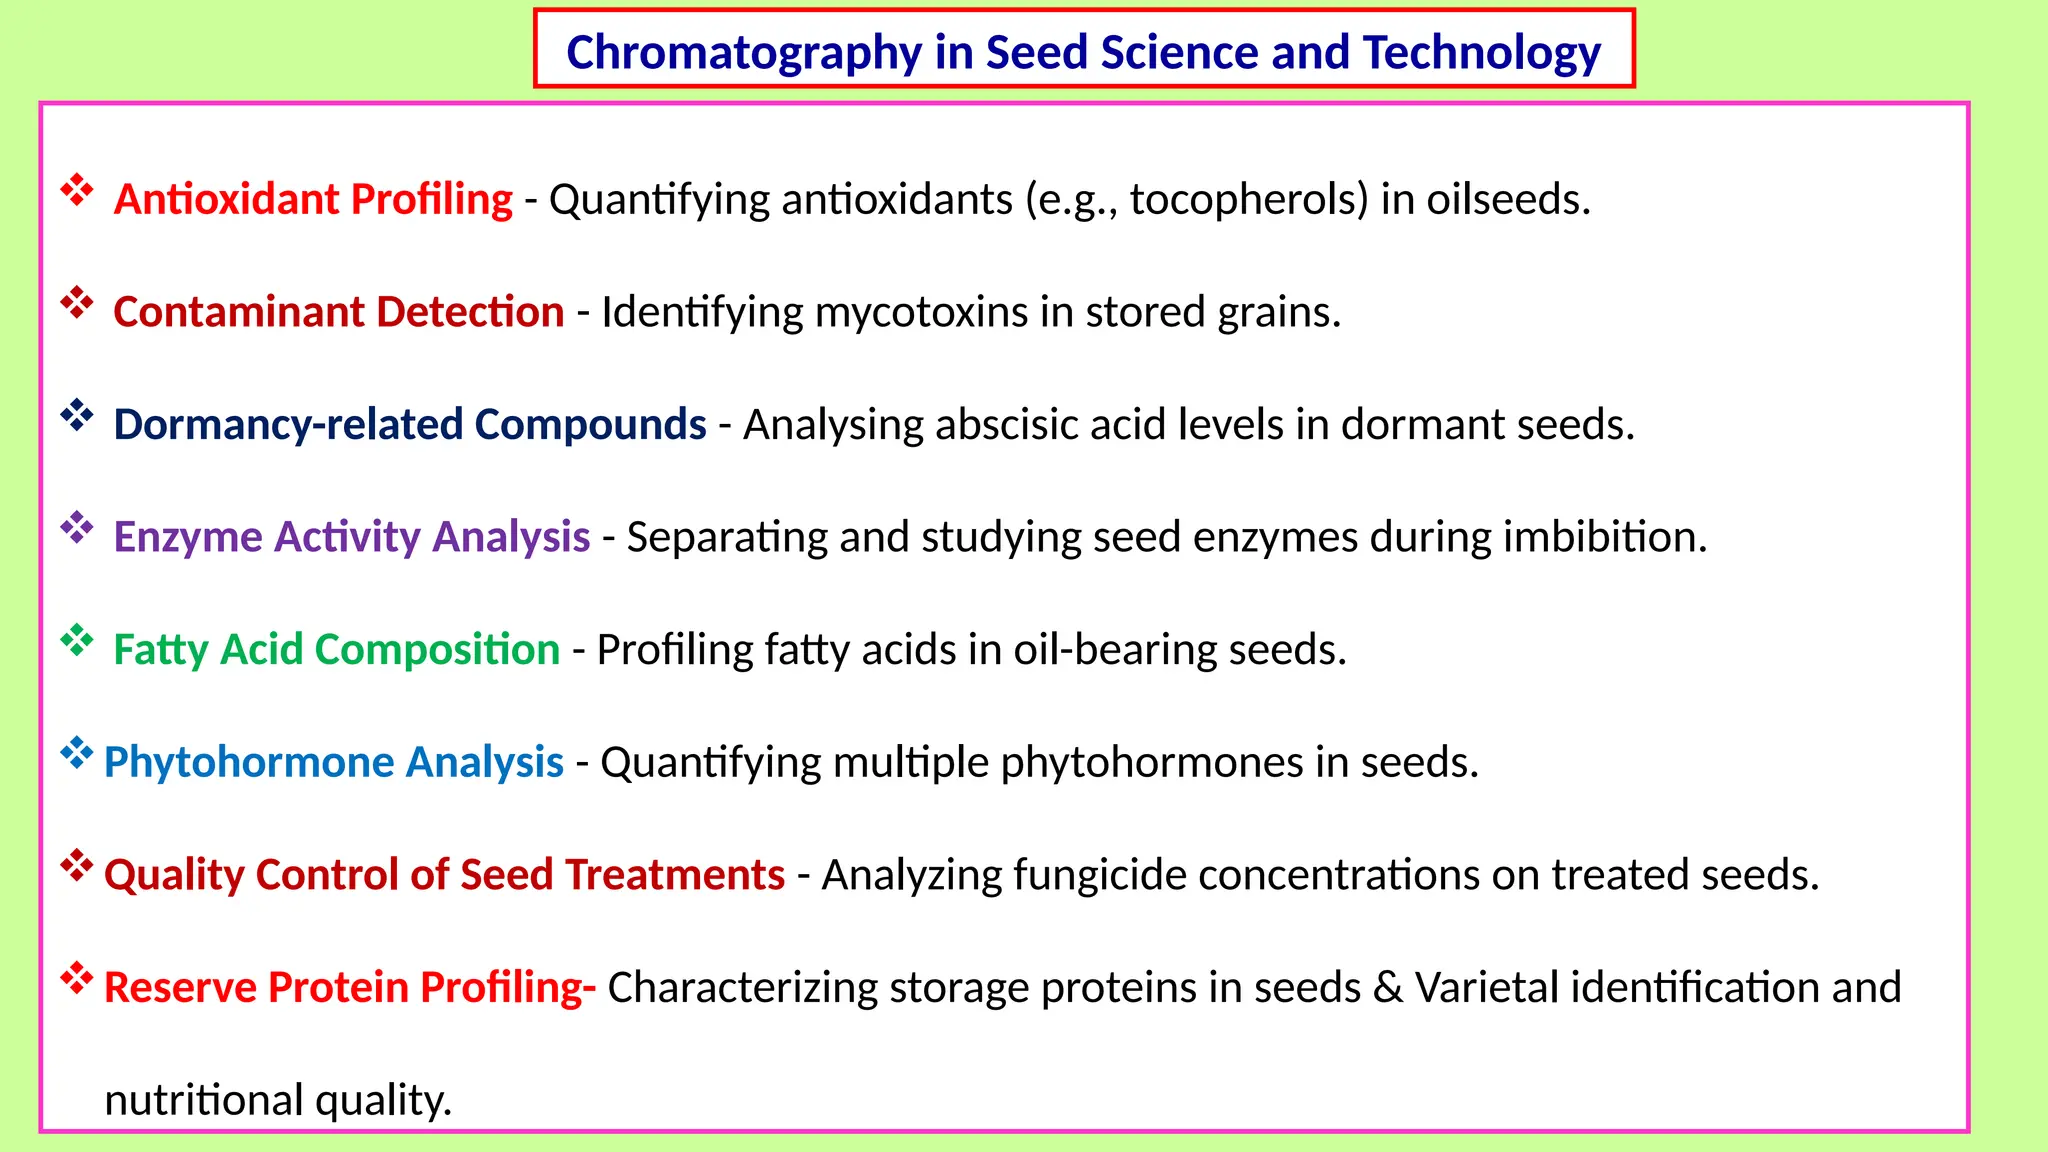
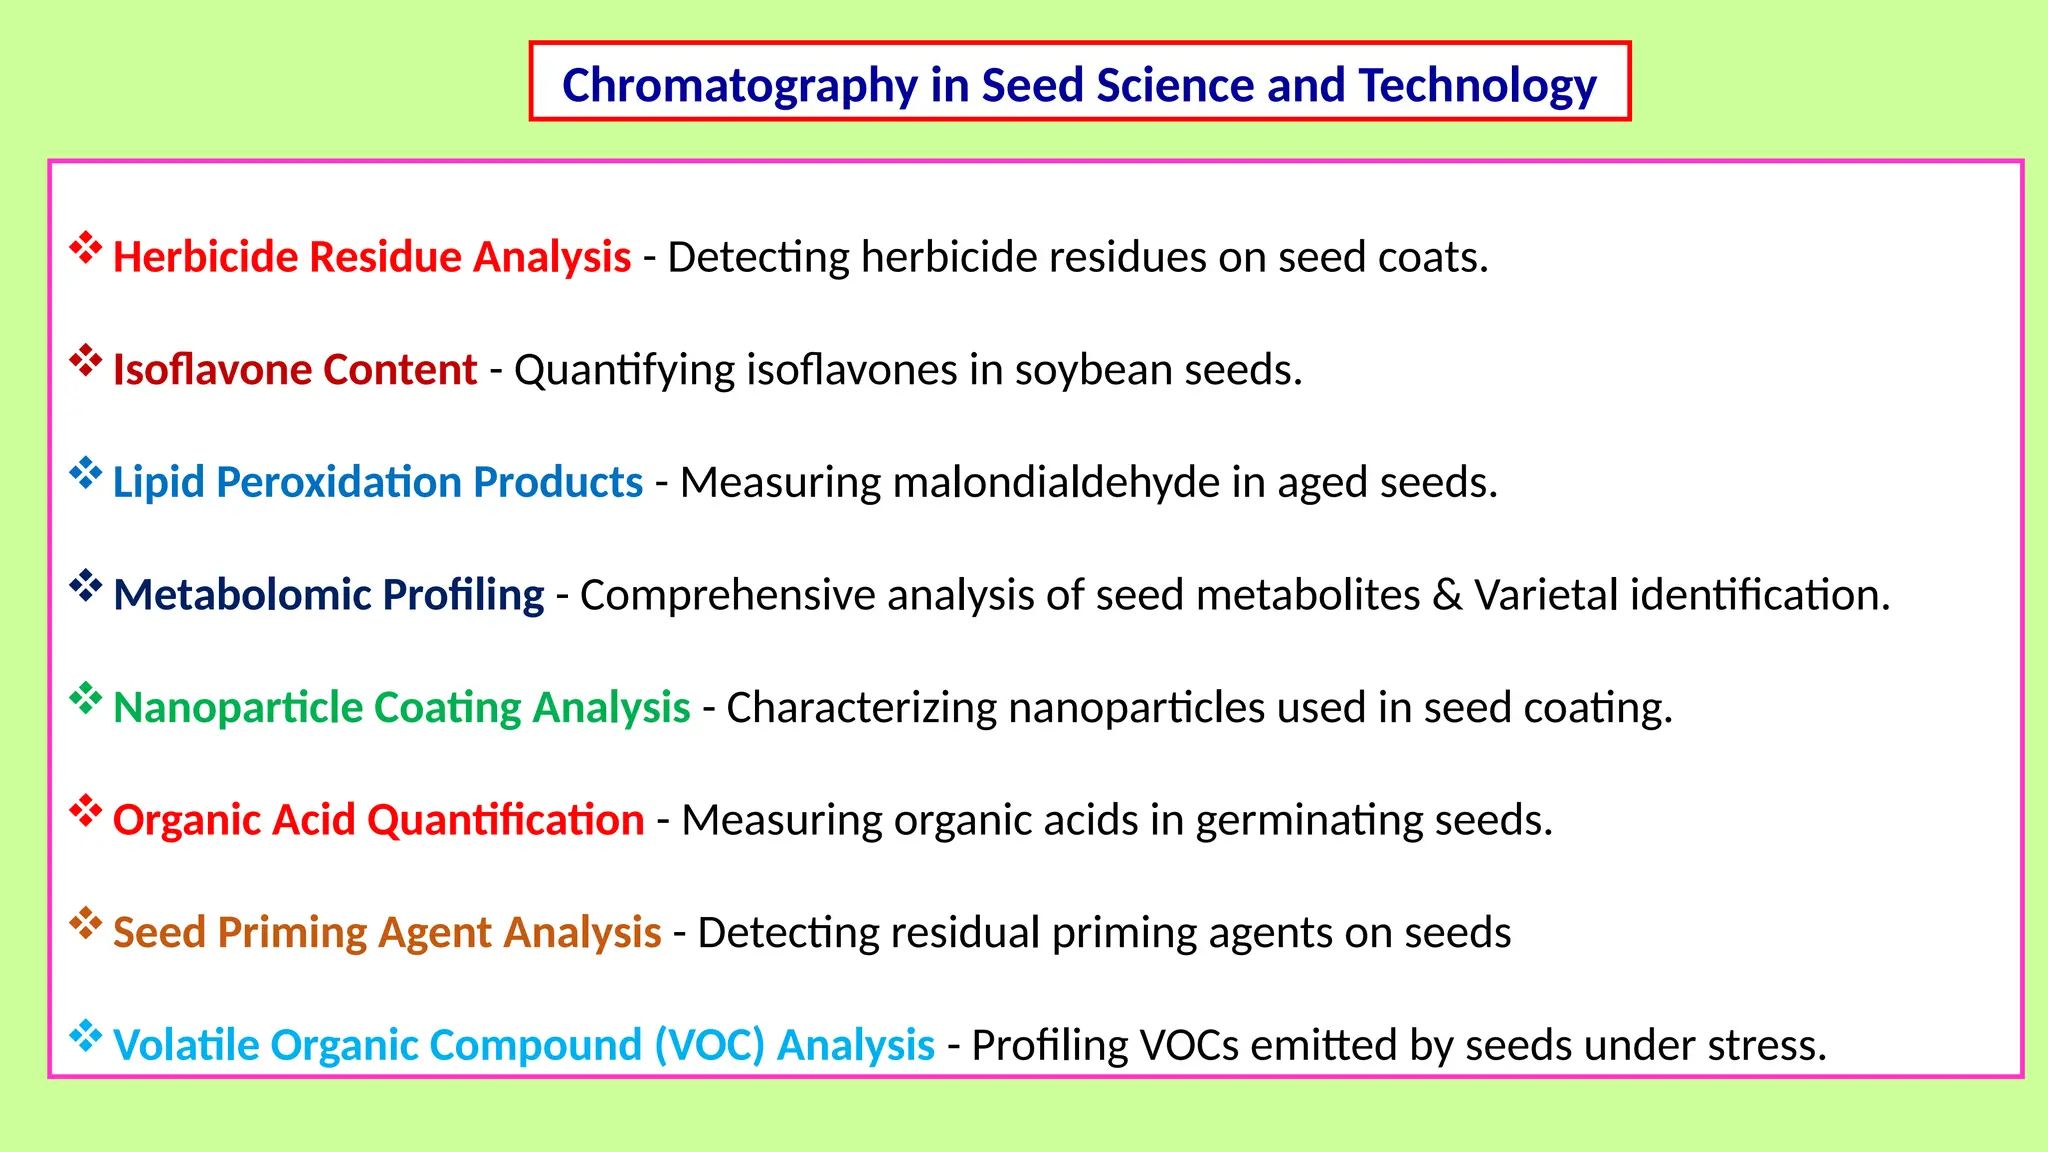
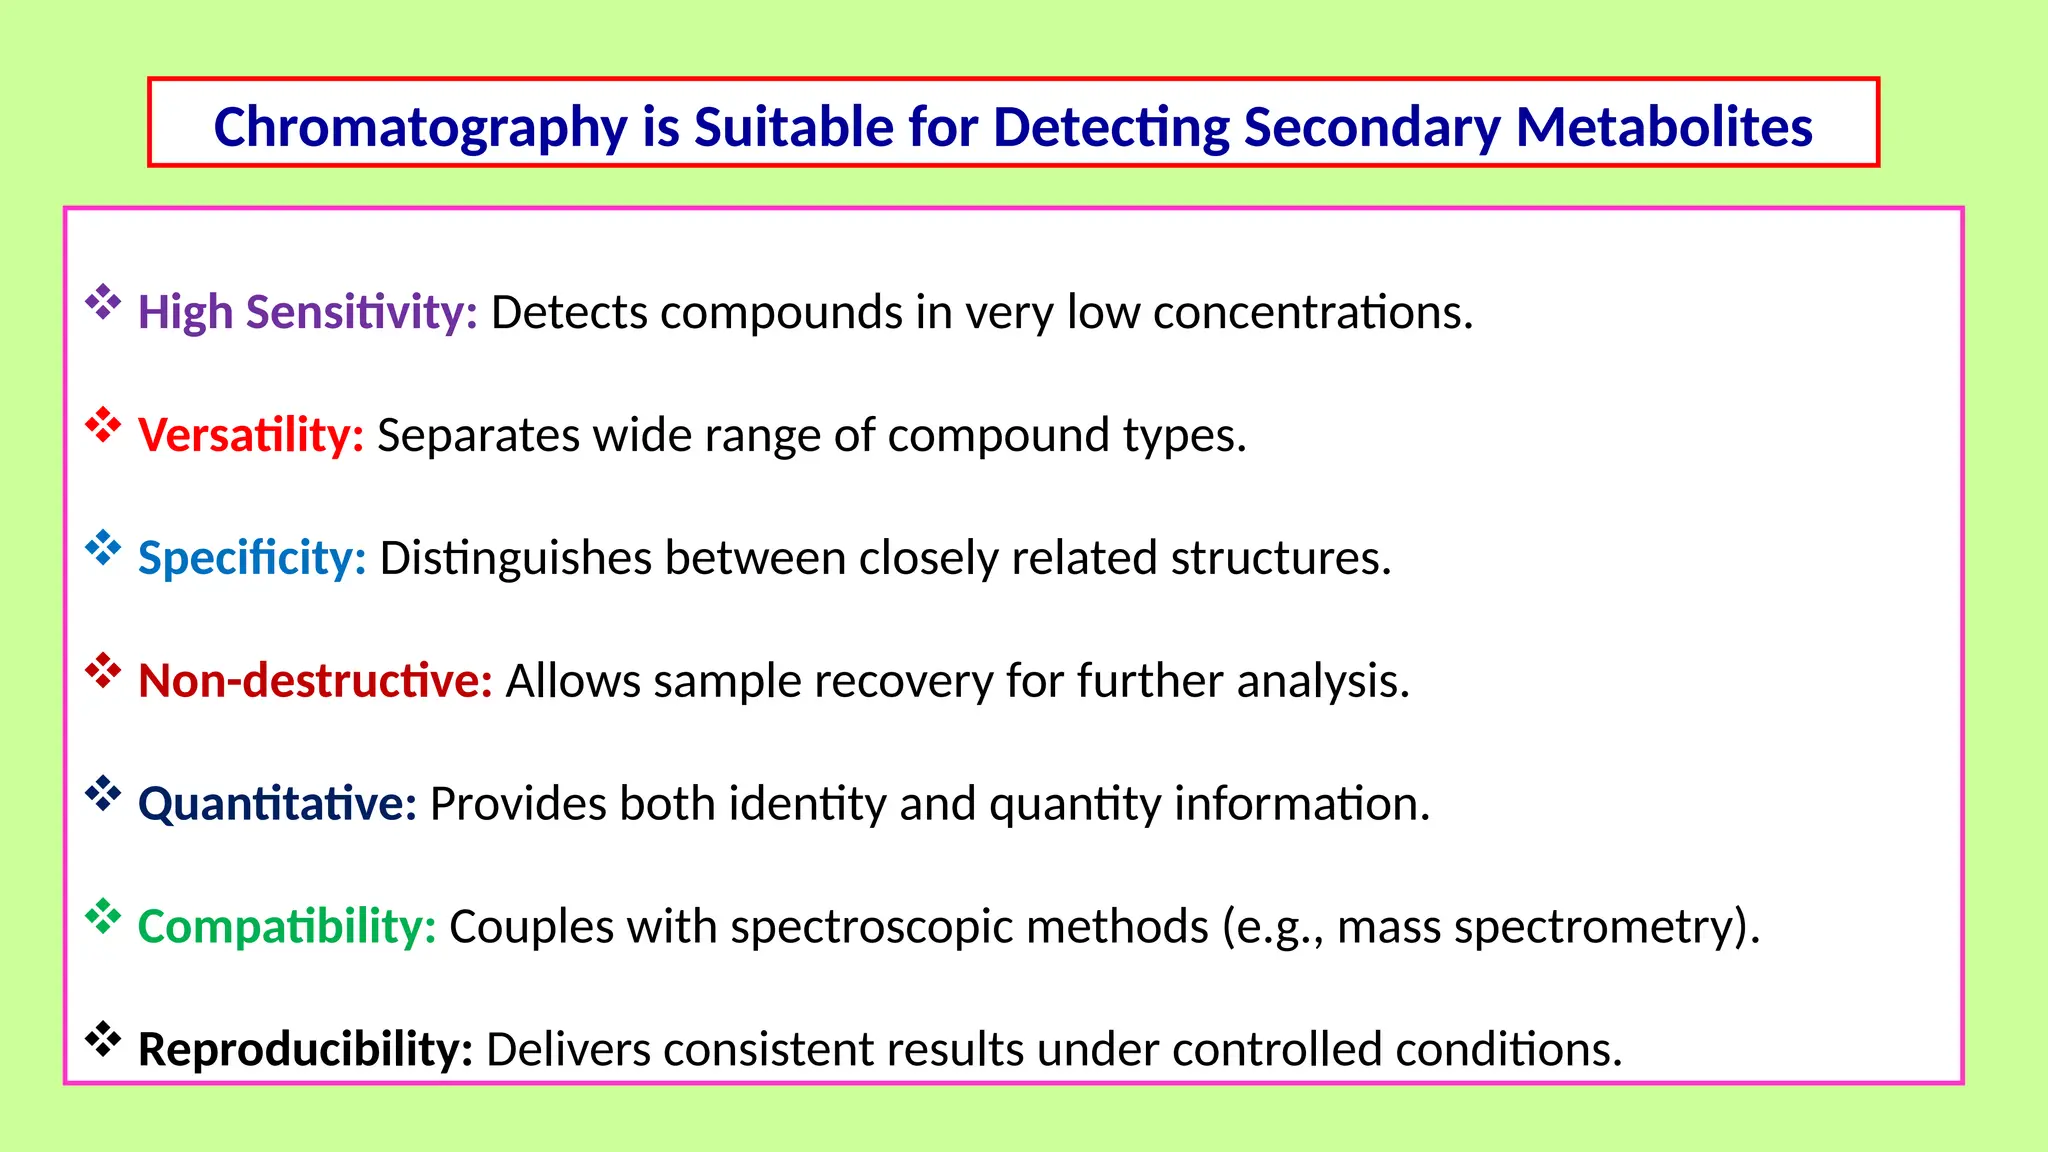
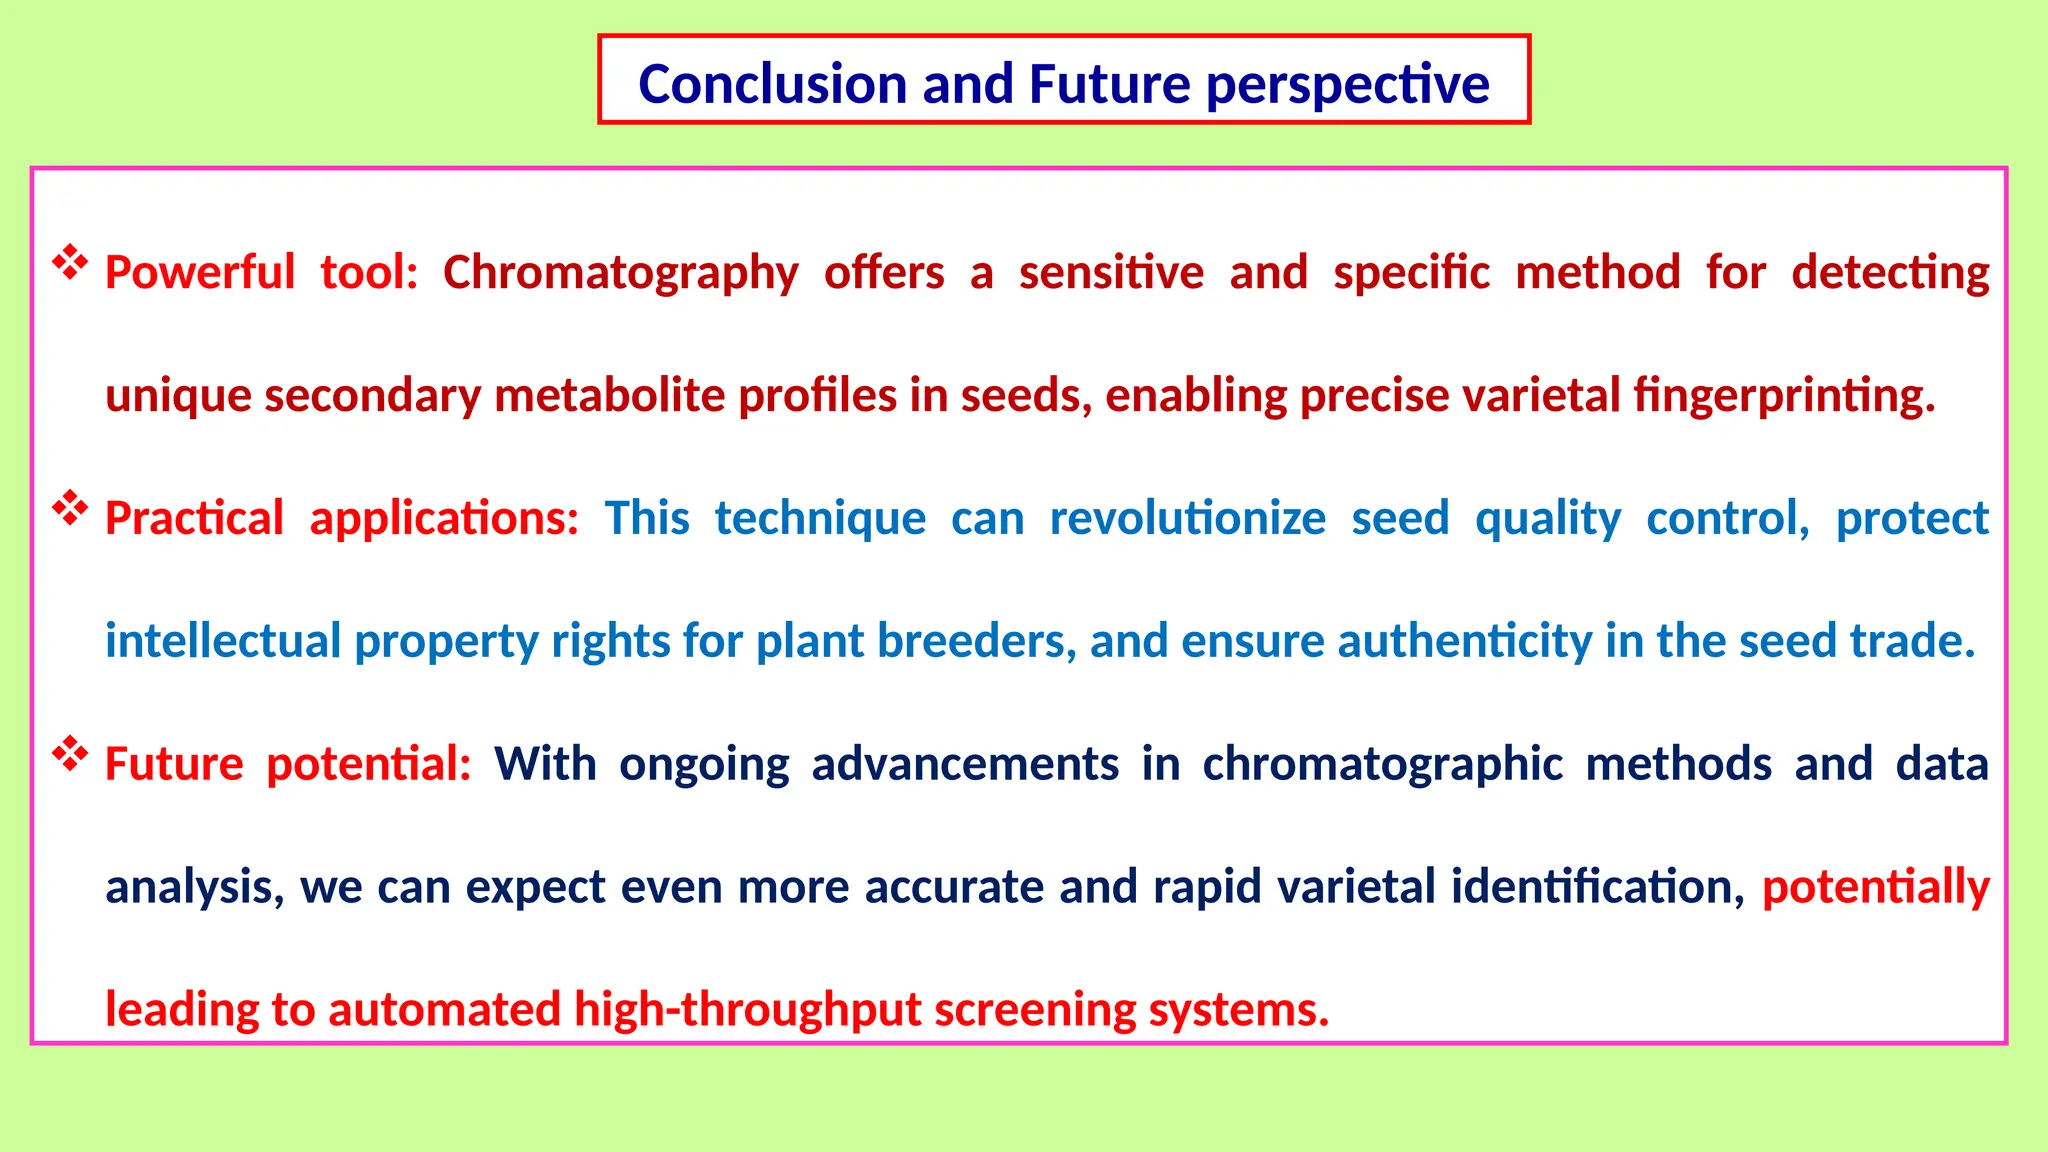
CHROMATOGRAPHY TECHNIQUES TO DETECT THE SECONDARY
METABOLITIES
P. JAYASANKARAN
Ph.D. Scholar
Introduction
 Chromatography, invented more than 100 years ago, is the most widely used
separation technique in the world today.
 It has helped the birth of modern analytical instrumentation and continues to
strongly influence the profiles of our chemical, biochemical and clinical
laboratories.
Unraveling Nature's Chemical Language
Why Chromatography for Secondary Metabolites?
Chromatography: Powerful analytical tool for separating and identifying complex
mixtures.
Secondary Metabolites: Diverse compounds in seeds crucial for plant defense and
adaptation.
 Chromatography decodes the complex array of secondary metabolites in seeds,
providing critical insights into plant defense mechanisms, stress responses, and
potential applications in agricultural innovation.
Key Milestones in Chromatography History
 1903: Russian botanist Mikhail Tsvet invents
chromatography, separating plant pigments using a column
of calcium carbonate.
 1906: Tsvet coins the term "chromatography" from Greek
words for "color" (chroma) and "to write" (graphein)
Mikhail Tsvet
 1940s: Martin and Synge developed partition chromatography, leading to the Nobel Prize in Chemistry (1952).
 1950s: Gas chromatography introduced by James and Martin (1952), followed by high-performance liquid
chromatography (HPLC) in the late 1960s.
 1970s-present: Continuous advancements including capillary electrochromatography, ultra-high-performance
liquid chromatography (UHPLC), and coupling with mass spectrometry.
Martin Synge
Key Milestones in Chromatography History
"Chromatography is a physical method of separation in which the components to be
separated are distributed between two phases, one of which is stationary (stationary phase)
while the other (the mobile phase) moves in a definite direction.” - The International Union
of Pure and Applied Chemistry (IUPAC) (1997)
Definition
Chromatography is a laboratory technique for separating mixtures of chemical substances
into their individual components.
Basic Principles
Two Phases:
1. Stationary phase: Fixed in place (e.g., paper, silica gel).
2. Mobile phase: Moves through the stationary phase (e.g., liquid, gas).
Separation Mechanism:
3. Based on differential partitioning between mobile and stationary phases.
4. Components with greater affinity for the stationary phase move more slowly.
5. Components with greater affinity for the mobile phase move more quickly.
Key Factors:
6. Polarity
7. Molecular size
8. Charge
9. Solubility
 Chromatogram: Graphical representation of
analyte concentration vs. retention time.
 X-axis: Retention time (minutes), Y-axis:
Signal intensity (detector response).
 Used to visualize separation of mixture
components.
 Provides qualitative and quantitative
information about sample composition.
 Enables identification and quantification of
individual compounds in a mixture.
Chromatograms and Their Use
 Good peaks: Symmetrical, narrow, well-resolved, consistent baseline.
 Bad peaks: Asymmetrical, broad, overlapping, tailing, fronting.
 Peak height: Indicates relative concentration of analyte.
 Peak area: Used for quantitative analysis, proportional to amount of analyte.
 Resolution: Measure of separation between adjacent peaks (Rs > 1.5 is desirable).
Analyzing Peaks
Analyzing Peaks
 Retention time: Primary method for compound identification.
 Peak shape: Can indicate purity and potential interferences.
 Use of standards: Compare unknown peaks to known compound retention times.
 Mass spectrometry: Couple with chromatography for definitive identification.
 Database matching: Compare chromatogram patterns with established libraries.
Identifying Compounds Based on Peaks
 Qualitative Analysis = Comparing
Retention Time
 Quantitative Analysis = Comparing
Peak Area/Height
 UV-Vis detector: Measures light absorption, common in HPLC.
 Flame Ionization Detector (FID): Detects organic compounds, widely used in GC.
 Mass Spectrometer (MS): Provides structural information, high sensitivity and selectivity.
 Refractive Index (RI) detector: Universal detector, measures change in refractive index.
 Conductivity detector: Measures electrical conductivity, used for ionic species.
Detectors in Chromatography
Mass Spectrometer (MS): High sensitivity and selectivity
National Institute of Standards and Technology
NIST - Full Mass Spectral Library
Types of Chromatography Techniques
 Paper Chromatography.
 Thin-Layer Chromatography (TLC).
 High-Performance Liquid Chromatography (HPLC).
 Gas Chromatography (GC).
Classification of chromatography
Paper Chromatography
Principles:
 Separation based on differential partitioning between stationary and mobile phases.
 Cellulose fibers in paper act as stationary phase.
 Capillary action moves mobile phase through paper.
 Compounds separate based on polarity and solubility.
Sample application on paper
Paper placement in development chamber
Solvent migration up/across paper
Removal and drying of paper
Visualization of separated compounds
Advantages:
 Simple and inexpensive technique.
 Minimal equipment required.
 Easy to perform and interpret.
 Good for preliminary screening of samples.
 Suitable for educational demonstrations.
 Can handle multiple samples simultaneously.
Limitations:
 Lower resolution compared to modern techniques (HPLC, GC).
 Limited to small sample volumes.
 Mainly qualitative or semi-quantitative.
 Time-consuming for large molecules.
 Less sensitive than advanced chromatographic methods.
 Results can be affected by environmental conditions.
Principles:
 Separation based on differential migration of compounds.
 Capillary action drives mobile phase through stationary phase.
 Retention factor (Rf) used to quantify separation.
Thin-Layer Chromatography (TLC)
Sample application on plate
Plate placement in development chamber
Solvent migration
Plate removal and drying
Visualization (UV light, chemical reagents)
Thin-Layer Chromatography (TLC)
Advantages
 Simple and rapid technique.
 Cost-effective for routine analysis.
 Minimal sample preparation required.
 Multiple samples can be analyzed simultaneously.
 Versatile - applicable to various compound classes.
Limitations
 Lower resolution compared to HPLC.
 Semi-quantitative (quantification less precise).
 Limited to volatile or UV-active compounds for some detection methods.
 Potential for edge effects and inconsistent results.
Principles:
 Separation based on compound interactions with stationary and mobile phases.
 High pressure to drive mobile phase through column.
 Detection based on compound properties (e.g., UV absorption, fluorescence).
High-Performance Liquid Chromatography (HPLC)
Sample injection
Pressurized flow through column
Compound separation
Detection and data acquisition
Chromatogram generation and analysis
High-Performance Liquid Chromatography (HPLC)
Types of HPLC
 Normal-phase HPLC: Polar stationary phase, non-polar mobile phase.
 Reverse-phase HPLC: Non-polar stationary phase, polar mobile phase.
 Ion-exchange HPLC: Charged stationary phase, oppositely charged analytes.
 Size-exclusion HPLC: Separation based on molecular size.
Ion-exchange chromatography
Size Exclusion Chromatography (SEC)
High-Performance Liquid Chromatography (HPLC)
Advantages
 High resolution and sensitivity.
 Excellent reproducibility and precision.
 Wide range of applications (polar and non-polar compounds).
 Automation capabilities for high-throughput analysis.
 Quantitative analysis with good accuracy.
 Can be coupled with various detectors (e.g., MS).
Limitations
 Higher cost compared to some other techniques.
 Complex instrumentation requiring skilled operation.
 Time-consuming method development.
 Sample preparation can be extensive..
Gas Chromatography (GC)
Principles:
 Separation based on compound volatility and interaction with stationary phase.
 Gaseous mobile phase (carrier gas) moves analytes through column.
 Temperature programming for efficient separation.
Sample vaporization in heated injector
Separation in temperature-controlled column
Detection of separated compounds
Data acquisition and chromatogram generation
Gas Chromatography (GC)
Advantages
 High sensitivity for volatile compounds.
 Excellent separation efficiency.
 Fast analysis time.
 Small sample size required.
 Can be easily coupled with mass spectrometry (GC-MS).
Limitations
 Limited to thermally instable compounds.
 Not suitable for high molecular weight or polar compounds.
 Potential for thermal degradation of sensitive compounds.
 Column bleeding at high temperatures can affect baseline.
Technique Sensitivity Specificity Cost Ease of Use
Paper Chromatography Low Low Very Low Very High
Thin-Layer Chromatography (TLC) Moderate Moderate Low High
High-Performance Liquid Chromatography (HPLC) High High High Moderate
Gas Chromatography (GC) Very High High High Moderate
Comparison of Chromatography Techniques
 Sensitivity: Ability to detect low concentrations of analytes.
 Specificity: Ability to distinguish between similar compounds.
Considerations:
 TLC and Paper Chromatography are simpler but less precise.
 HPLC offers versatility for a wide range of compounds.
 GC excels for volatile compounds with high sensitivity.
 Choice depends on specific analytes and research needs.
Uses for chromatography
Case study
24 global soybean genotypes analyzed via GC-MS (TSQ™ 8000 Evo) using
specific temperature program, with compounds identified by NIST library
comparison.
Alghamdi et al., 2018
A typical GC–MS profile of seeds of soybean genotype
Salem et al., 2018
Salem et al., 2018
List of important phytocompounds identified in the methanolic seed extract of soybean genotypes by GC–MS
Pie Diagram showing the percentage of phytochemical groups identified in
24 soybean genotypes
88 compounds identified, categorized into 12 chemical groups Salem et al., 2018
Salem et al., 2018
Genotype-specific findings: Highlighted distinctive characteristics of certain genotypes.
 Indonesian (Ijen and Indo-1): Highest phenolic compounds.
 Australian: Maximum esters compounds.
 3803 and Indo-11: Maximum ketone compounds.
 Giza 111: Maximum heterocyclic compounds.
Prevalent compounds: Listed the most common bioactive compounds found across genotypes.
 Major phyto-compounds: Phenol 2,6-dimethoxy-, 2-Methoxy-4-vinylphenol, Hexadecanoic
acid methyl ester.
 Objective: Discriminate rice varieties using volatile organic compound (VOC) profiles to address
mislabeling and adulteration issues.
 Methodology: Headspace solid-phase microextraction (HS-SPME) coupled with gas chromatography-mass
spectrometry (GC-MS) to analyze VOCs from Wuyoudao 4 (nine sites) and 11 other rice cultivars.
 Multivariate analysis distinguished Wuchang rice from non-Wuchang rice, with PLS-DA showing high fit
(0.90) and prediction (0.85) values; eight biomarkers, including 2-acetyl-1-pyrroline, identified
for variety authentication.
Hu et al., 2023
 Antioxidant Profiling - Quantifying antioxidants (e.g., tocopherols) in oilseeds.
 Contaminant Detection - Identifying mycotoxins in stored grains.
 Dormancy-related Compounds - Analysing abscisic acid levels in dormant seeds.
 Enzyme Activity Analysis - Separating and studying seed enzymes during imbibition.
 Fatty Acid Composition - Profiling fatty acids in oil-bearing seeds.
Phytohormone Analysis - Quantifying multiple phytohormones in seeds.
Quality Control of Seed Treatments - Analyzing fungicide concentrations on treated seeds.
Reserve Protein Profiling- Characterizing storage proteins in seeds & Varietal identification and
nutritional quality.
Chromatography in Seed Science and Technology
Herbicide Residue Analysis - Detecting herbicide residues on seed coats.
Isoflavone Content - Quantifying isoflavones in soybean seeds.
Lipid Peroxidation Products - Measuring malondialdehyde in aged seeds.
Metabolomic Profiling - Comprehensive analysis of seed metabolites & Varietal identification.
Nanoparticle Coating Analysis - Characterizing nanoparticles used in seed coating.
Organic Acid Quantification - Measuring organic acids in germinating seeds.
Seed Priming Agent Analysis - Detecting residual priming agents on seeds
Volatile Organic Compound (VOC) Analysis - Profiling VOCs emitted by seeds under stress.
Chromatography in Seed Science and Technology
 High Sensitivity: Detects compounds in very low concentrations.
 Versatility: Separates wide range of compound types.
 Specificity: Distinguishes between closely related structures.
 Non-destructive: Allows sample recovery for further analysis.
 Quantitative: Provides both identity and quantity information.
 Compatibility: Couples with spectroscopic methods (e.g., mass spectrometry).
 Reproducibility: Delivers consistent results under controlled conditions.
Chromatography is Suitable for Detecting Secondary Metabolites
 Powerful tool: Chromatography offers a sensitive and specific method for detecting
unique secondary metabolite profiles in seeds, enabling precise varietal fingerprinting.
 Practical applications: This technique can revolutionize seed quality control, protect
intellectual property rights for plant breeders, and ensure authenticity in the seed trade.
 Future potential: With ongoing advancements in chromatographic methods and data
analysis, we can expect even more accurate and rapid varietal identification, potentially
leading to automated high-throughput screening systems.
Conclusion and Future perspective
1. Hu, S., Ren, H., Song, Y., Liu, F., Qian, L., Zuo, F., & Meng, L. (2023). Analysis of volatile compounds by GCMS reveals
their rice cultivars. Scientific Reports, 13(1). https://doi.org/10.1038/s41598-023-34797-2.
2. Alghamdi, S. S., Khan, M. A., El-Harty, E. H., Ammar, M. H., Farooq, M., & Migdadi, H. M. (2018). Comparative
phytochemical profiling of different soybean ( Glycine max (L.) Merr) genotypes using GC–MS. Saudi Journal of Biological
Sciences, 25(1), 15–21. https://doi.org/10.1016/j.sjbs.2017.10.014.
3. Staff, L. (2024, February 1). Advancing Agriculture for Future Generations: The Impact of Chromatography on an
Important Field. Chromatography Online.
https://www.chromatographyonline.com/view/advancing-agriculture-for-future-generations-the-impact-of-chromatograp
hy-on-an-important-field
.
4. Hazef, A. A., Goyal, S. S., & Rains, D. (1991). Use of ion chromatography in agricultural research. Journal of
REFERENCES
Thank You !!!

Chromatography Techniques for Secondary Metabolite Analysis

  • 1.
    CHROMATOGRAPHY TECHNIQUES TODETECT THE SECONDARY METABOLITIES P. JAYASANKARAN Ph.D. Scholar
  • 2.
    Introduction  Chromatography, inventedmore than 100 years ago, is the most widely used separation technique in the world today.  It has helped the birth of modern analytical instrumentation and continues to strongly influence the profiles of our chemical, biochemical and clinical laboratories. Unraveling Nature's Chemical Language
  • 3.
    Why Chromatography forSecondary Metabolites? Chromatography: Powerful analytical tool for separating and identifying complex mixtures. Secondary Metabolites: Diverse compounds in seeds crucial for plant defense and adaptation.  Chromatography decodes the complex array of secondary metabolites in seeds, providing critical insights into plant defense mechanisms, stress responses, and potential applications in agricultural innovation.
  • 4.
    Key Milestones inChromatography History  1903: Russian botanist Mikhail Tsvet invents chromatography, separating plant pigments using a column of calcium carbonate.  1906: Tsvet coins the term "chromatography" from Greek words for "color" (chroma) and "to write" (graphein) Mikhail Tsvet
  • 5.
     1940s: Martinand Synge developed partition chromatography, leading to the Nobel Prize in Chemistry (1952).  1950s: Gas chromatography introduced by James and Martin (1952), followed by high-performance liquid chromatography (HPLC) in the late 1960s.  1970s-present: Continuous advancements including capillary electrochromatography, ultra-high-performance liquid chromatography (UHPLC), and coupling with mass spectrometry. Martin Synge Key Milestones in Chromatography History
  • 6.
    "Chromatography is aphysical method of separation in which the components to be separated are distributed between two phases, one of which is stationary (stationary phase) while the other (the mobile phase) moves in a definite direction.” - The International Union of Pure and Applied Chemistry (IUPAC) (1997) Definition Chromatography is a laboratory technique for separating mixtures of chemical substances into their individual components.
  • 7.
    Basic Principles Two Phases: 1.Stationary phase: Fixed in place (e.g., paper, silica gel). 2. Mobile phase: Moves through the stationary phase (e.g., liquid, gas). Separation Mechanism: 3. Based on differential partitioning between mobile and stationary phases. 4. Components with greater affinity for the stationary phase move more slowly. 5. Components with greater affinity for the mobile phase move more quickly. Key Factors: 6. Polarity 7. Molecular size 8. Charge 9. Solubility
  • 9.
     Chromatogram: Graphicalrepresentation of analyte concentration vs. retention time.  X-axis: Retention time (minutes), Y-axis: Signal intensity (detector response).  Used to visualize separation of mixture components.  Provides qualitative and quantitative information about sample composition.  Enables identification and quantification of individual compounds in a mixture. Chromatograms and Their Use
  • 10.
     Good peaks:Symmetrical, narrow, well-resolved, consistent baseline.  Bad peaks: Asymmetrical, broad, overlapping, tailing, fronting.  Peak height: Indicates relative concentration of analyte.  Peak area: Used for quantitative analysis, proportional to amount of analyte.  Resolution: Measure of separation between adjacent peaks (Rs > 1.5 is desirable). Analyzing Peaks
  • 11.
  • 12.
     Retention time:Primary method for compound identification.  Peak shape: Can indicate purity and potential interferences.  Use of standards: Compare unknown peaks to known compound retention times.  Mass spectrometry: Couple with chromatography for definitive identification.  Database matching: Compare chromatogram patterns with established libraries. Identifying Compounds Based on Peaks  Qualitative Analysis = Comparing Retention Time  Quantitative Analysis = Comparing Peak Area/Height
  • 13.
     UV-Vis detector:Measures light absorption, common in HPLC.  Flame Ionization Detector (FID): Detects organic compounds, widely used in GC.  Mass Spectrometer (MS): Provides structural information, high sensitivity and selectivity.  Refractive Index (RI) detector: Universal detector, measures change in refractive index.  Conductivity detector: Measures electrical conductivity, used for ionic species. Detectors in Chromatography
  • 14.
    Mass Spectrometer (MS):High sensitivity and selectivity
  • 15.
    National Institute ofStandards and Technology NIST - Full Mass Spectral Library
  • 16.
    Types of ChromatographyTechniques  Paper Chromatography.  Thin-Layer Chromatography (TLC).  High-Performance Liquid Chromatography (HPLC).  Gas Chromatography (GC).
  • 17.
  • 18.
    Paper Chromatography Principles:  Separationbased on differential partitioning between stationary and mobile phases.  Cellulose fibers in paper act as stationary phase.  Capillary action moves mobile phase through paper.  Compounds separate based on polarity and solubility. Sample application on paper Paper placement in development chamber Solvent migration up/across paper Removal and drying of paper Visualization of separated compounds
  • 19.
    Advantages:  Simple andinexpensive technique.  Minimal equipment required.  Easy to perform and interpret.  Good for preliminary screening of samples.  Suitable for educational demonstrations.  Can handle multiple samples simultaneously. Limitations:  Lower resolution compared to modern techniques (HPLC, GC).  Limited to small sample volumes.  Mainly qualitative or semi-quantitative.  Time-consuming for large molecules.  Less sensitive than advanced chromatographic methods.  Results can be affected by environmental conditions.
  • 20.
    Principles:  Separation basedon differential migration of compounds.  Capillary action drives mobile phase through stationary phase.  Retention factor (Rf) used to quantify separation. Thin-Layer Chromatography (TLC) Sample application on plate Plate placement in development chamber Solvent migration Plate removal and drying Visualization (UV light, chemical reagents)
  • 21.
  • 22.
    Advantages  Simple andrapid technique.  Cost-effective for routine analysis.  Minimal sample preparation required.  Multiple samples can be analyzed simultaneously.  Versatile - applicable to various compound classes. Limitations  Lower resolution compared to HPLC.  Semi-quantitative (quantification less precise).  Limited to volatile or UV-active compounds for some detection methods.  Potential for edge effects and inconsistent results.
  • 23.
    Principles:  Separation basedon compound interactions with stationary and mobile phases.  High pressure to drive mobile phase through column.  Detection based on compound properties (e.g., UV absorption, fluorescence). High-Performance Liquid Chromatography (HPLC) Sample injection Pressurized flow through column Compound separation Detection and data acquisition Chromatogram generation and analysis
  • 24.
  • 26.
    Types of HPLC Normal-phase HPLC: Polar stationary phase, non-polar mobile phase.  Reverse-phase HPLC: Non-polar stationary phase, polar mobile phase.  Ion-exchange HPLC: Charged stationary phase, oppositely charged analytes.  Size-exclusion HPLC: Separation based on molecular size.
  • 27.
  • 28.
  • 29.
  • 30.
    Advantages  High resolutionand sensitivity.  Excellent reproducibility and precision.  Wide range of applications (polar and non-polar compounds).  Automation capabilities for high-throughput analysis.  Quantitative analysis with good accuracy.  Can be coupled with various detectors (e.g., MS). Limitations  Higher cost compared to some other techniques.  Complex instrumentation requiring skilled operation.  Time-consuming method development.  Sample preparation can be extensive..
  • 31.
    Gas Chromatography (GC) Principles: Separation based on compound volatility and interaction with stationary phase.  Gaseous mobile phase (carrier gas) moves analytes through column.  Temperature programming for efficient separation. Sample vaporization in heated injector Separation in temperature-controlled column Detection of separated compounds Data acquisition and chromatogram generation
  • 32.
  • 33.
  • 34.
    Advantages  High sensitivityfor volatile compounds.  Excellent separation efficiency.  Fast analysis time.  Small sample size required.  Can be easily coupled with mass spectrometry (GC-MS). Limitations  Limited to thermally instable compounds.  Not suitable for high molecular weight or polar compounds.  Potential for thermal degradation of sensitive compounds.  Column bleeding at high temperatures can affect baseline.
  • 35.
    Technique Sensitivity SpecificityCost Ease of Use Paper Chromatography Low Low Very Low Very High Thin-Layer Chromatography (TLC) Moderate Moderate Low High High-Performance Liquid Chromatography (HPLC) High High High Moderate Gas Chromatography (GC) Very High High High Moderate Comparison of Chromatography Techniques  Sensitivity: Ability to detect low concentrations of analytes.  Specificity: Ability to distinguish between similar compounds. Considerations:  TLC and Paper Chromatography are simpler but less precise.  HPLC offers versatility for a wide range of compounds.  GC excels for volatile compounds with high sensitivity.  Choice depends on specific analytes and research needs.
  • 36.
  • 37.
  • 38.
    24 global soybeangenotypes analyzed via GC-MS (TSQ™ 8000 Evo) using specific temperature program, with compounds identified by NIST library comparison.
  • 39.
  • 40.
    A typical GC–MSprofile of seeds of soybean genotype Salem et al., 2018
  • 41.
    Salem et al.,2018 List of important phytocompounds identified in the methanolic seed extract of soybean genotypes by GC–MS
  • 42.
    Pie Diagram showingthe percentage of phytochemical groups identified in 24 soybean genotypes 88 compounds identified, categorized into 12 chemical groups Salem et al., 2018
  • 43.
    Salem et al.,2018 Genotype-specific findings: Highlighted distinctive characteristics of certain genotypes.  Indonesian (Ijen and Indo-1): Highest phenolic compounds.  Australian: Maximum esters compounds.  3803 and Indo-11: Maximum ketone compounds.  Giza 111: Maximum heterocyclic compounds. Prevalent compounds: Listed the most common bioactive compounds found across genotypes.  Major phyto-compounds: Phenol 2,6-dimethoxy-, 2-Methoxy-4-vinylphenol, Hexadecanoic acid methyl ester.
  • 44.
     Objective: Discriminaterice varieties using volatile organic compound (VOC) profiles to address mislabeling and adulteration issues.  Methodology: Headspace solid-phase microextraction (HS-SPME) coupled with gas chromatography-mass spectrometry (GC-MS) to analyze VOCs from Wuyoudao 4 (nine sites) and 11 other rice cultivars.
  • 45.
     Multivariate analysisdistinguished Wuchang rice from non-Wuchang rice, with PLS-DA showing high fit (0.90) and prediction (0.85) values; eight biomarkers, including 2-acetyl-1-pyrroline, identified for variety authentication. Hu et al., 2023
  • 46.
     Antioxidant Profiling- Quantifying antioxidants (e.g., tocopherols) in oilseeds.  Contaminant Detection - Identifying mycotoxins in stored grains.  Dormancy-related Compounds - Analysing abscisic acid levels in dormant seeds.  Enzyme Activity Analysis - Separating and studying seed enzymes during imbibition.  Fatty Acid Composition - Profiling fatty acids in oil-bearing seeds. Phytohormone Analysis - Quantifying multiple phytohormones in seeds. Quality Control of Seed Treatments - Analyzing fungicide concentrations on treated seeds. Reserve Protein Profiling- Characterizing storage proteins in seeds & Varietal identification and nutritional quality. Chromatography in Seed Science and Technology
  • 47.
    Herbicide Residue Analysis- Detecting herbicide residues on seed coats. Isoflavone Content - Quantifying isoflavones in soybean seeds. Lipid Peroxidation Products - Measuring malondialdehyde in aged seeds. Metabolomic Profiling - Comprehensive analysis of seed metabolites & Varietal identification. Nanoparticle Coating Analysis - Characterizing nanoparticles used in seed coating. Organic Acid Quantification - Measuring organic acids in germinating seeds. Seed Priming Agent Analysis - Detecting residual priming agents on seeds Volatile Organic Compound (VOC) Analysis - Profiling VOCs emitted by seeds under stress. Chromatography in Seed Science and Technology
  • 48.
     High Sensitivity:Detects compounds in very low concentrations.  Versatility: Separates wide range of compound types.  Specificity: Distinguishes between closely related structures.  Non-destructive: Allows sample recovery for further analysis.  Quantitative: Provides both identity and quantity information.  Compatibility: Couples with spectroscopic methods (e.g., mass spectrometry).  Reproducibility: Delivers consistent results under controlled conditions. Chromatography is Suitable for Detecting Secondary Metabolites
  • 49.
     Powerful tool:Chromatography offers a sensitive and specific method for detecting unique secondary metabolite profiles in seeds, enabling precise varietal fingerprinting.  Practical applications: This technique can revolutionize seed quality control, protect intellectual property rights for plant breeders, and ensure authenticity in the seed trade.  Future potential: With ongoing advancements in chromatographic methods and data analysis, we can expect even more accurate and rapid varietal identification, potentially leading to automated high-throughput screening systems. Conclusion and Future perspective
  • 50.
    1. Hu, S.,Ren, H., Song, Y., Liu, F., Qian, L., Zuo, F., & Meng, L. (2023). Analysis of volatile compounds by GCMS reveals their rice cultivars. Scientific Reports, 13(1). https://doi.org/10.1038/s41598-023-34797-2. 2. Alghamdi, S. S., Khan, M. A., El-Harty, E. H., Ammar, M. H., Farooq, M., & Migdadi, H. M. (2018). Comparative phytochemical profiling of different soybean ( Glycine max (L.) Merr) genotypes using GC–MS. Saudi Journal of Biological Sciences, 25(1), 15–21. https://doi.org/10.1016/j.sjbs.2017.10.014. 3. Staff, L. (2024, February 1). Advancing Agriculture for Future Generations: The Impact of Chromatography on an Important Field. Chromatography Online. https://www.chromatographyonline.com/view/advancing-agriculture-for-future-generations-the-impact-of-chromatograp hy-on-an-important-field . 4. Hazef, A. A., Goyal, S. S., & Rains, D. (1991). Use of ion chromatography in agricultural research. Journal of REFERENCES
  • 51.