Download to read offline
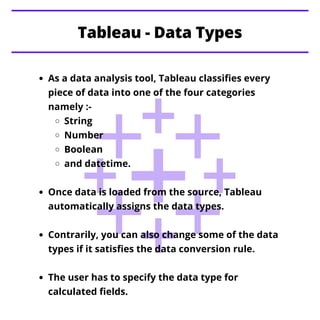
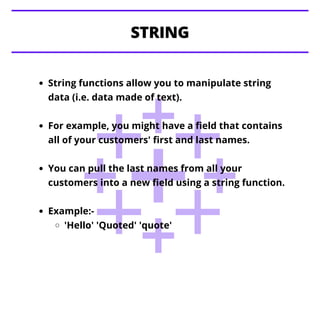
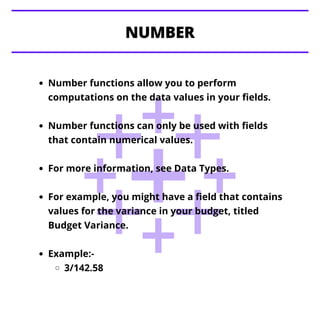
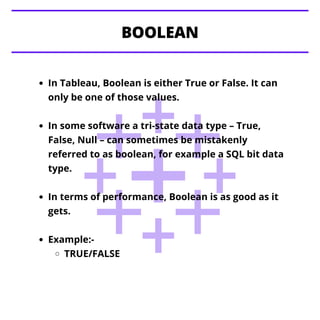
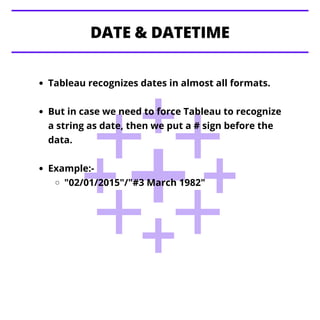


Tableau classifies data into four categories: string, number, boolean, and datetime, automatically assigning types upon data loading, though users can change types as needed. String functions manipulate text data, while number functions perform computations on numerical values; boolean represents true or false states. Tableau also recognizes various date formats, requiring a '#' sign for specific string-to-date conversions.