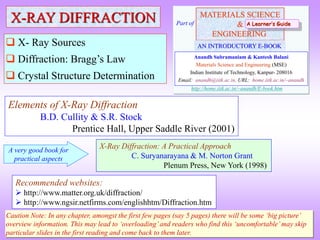
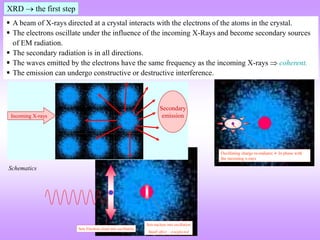
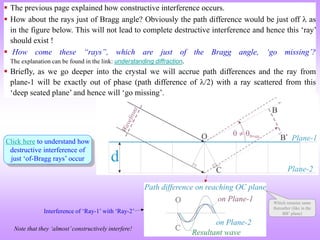
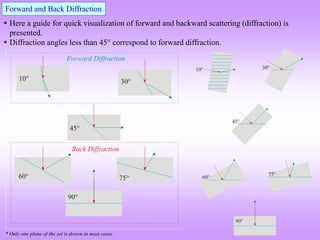
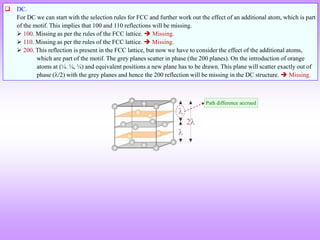
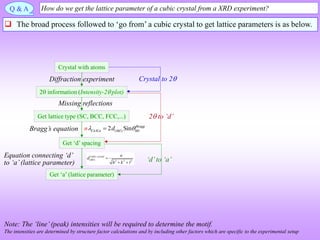
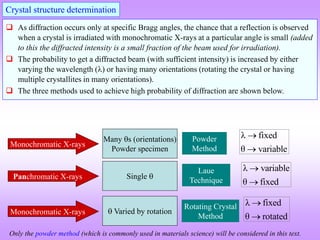
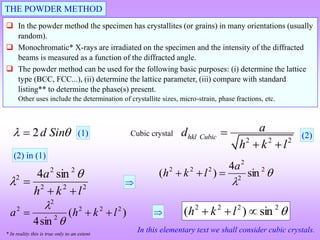
X-ray diffraction is a technique used to analyze the crystal structure of materials. It works by firing X-rays at a crystalline sample. The X-rays cause the electrons in the material to oscillate, re-radiating the electromagnetic waves. These waves undergo constructive and destructive interference based on Bragg's law, which states that for diffraction to occur, the path difference between waves must equal an integer multiple of the wavelength. This produces a diffraction pattern that can be analyzed to determine information about the crystal structure such as the lattice type and parameters. Other signals produced during XRD include fluorescent X-rays and electrons ejected from the material.

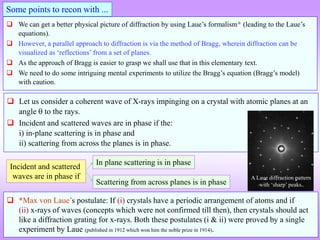
![ Now we shall consider the important topic as to how X-rays interact with a
crystalline array (of atoms, ions etc.) to give rise to the phenomenon known as X-
ray diffraction (XRD).
Let us consider a special case of diffraction → a case where we get ‘sharp[1]
diffraction peaks’.
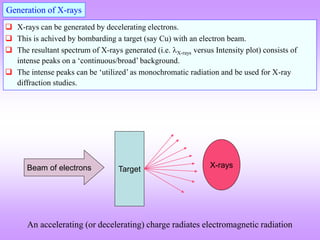
Diffraction (with sharp peaks) (with XRD being a specific case) requires three important conditions to
be satisfied:
Radiation related Coherent, monochromatic, parallel waves& (with wavelength ).
Sample related Crystalline array of scatterers* with spacing of the order of (~) .
Diffraction geometry related Fraunhofer diffraction geometry (& this is actually part of the Fraunhofer geometry)
[1] The intensity- plot looks like a ‘’function (in an ideal situation).
* A quasicrystalline array will also lead to diffraction with sharp peaks (which we shall not consider in this text).
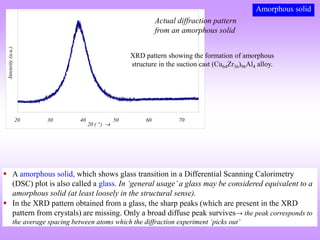
** Amorphous material will give broadened (diffuse) peak (additional factors related to the sample can also give a broad peak).
Diffraction Click here to “Understand Diffraction”
Coherent, monochromatic, parallel wave
Fraunhofer geometry
Diffraction pattern
with sharp peaks
Crystalline*,**
Aspects related to the wave
Aspects related to the material
Aspects related to the diffraction set-up
(diffraction geometry)](https://image.slidesharecdn.com/chapter3cxraydiffraction-230403080829-3e82e049/85/Chapter_3c_X_Ray_Diffraction-ppt-8-320.jpg)
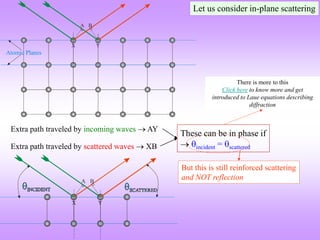
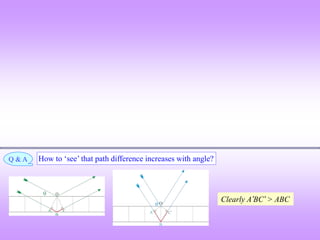
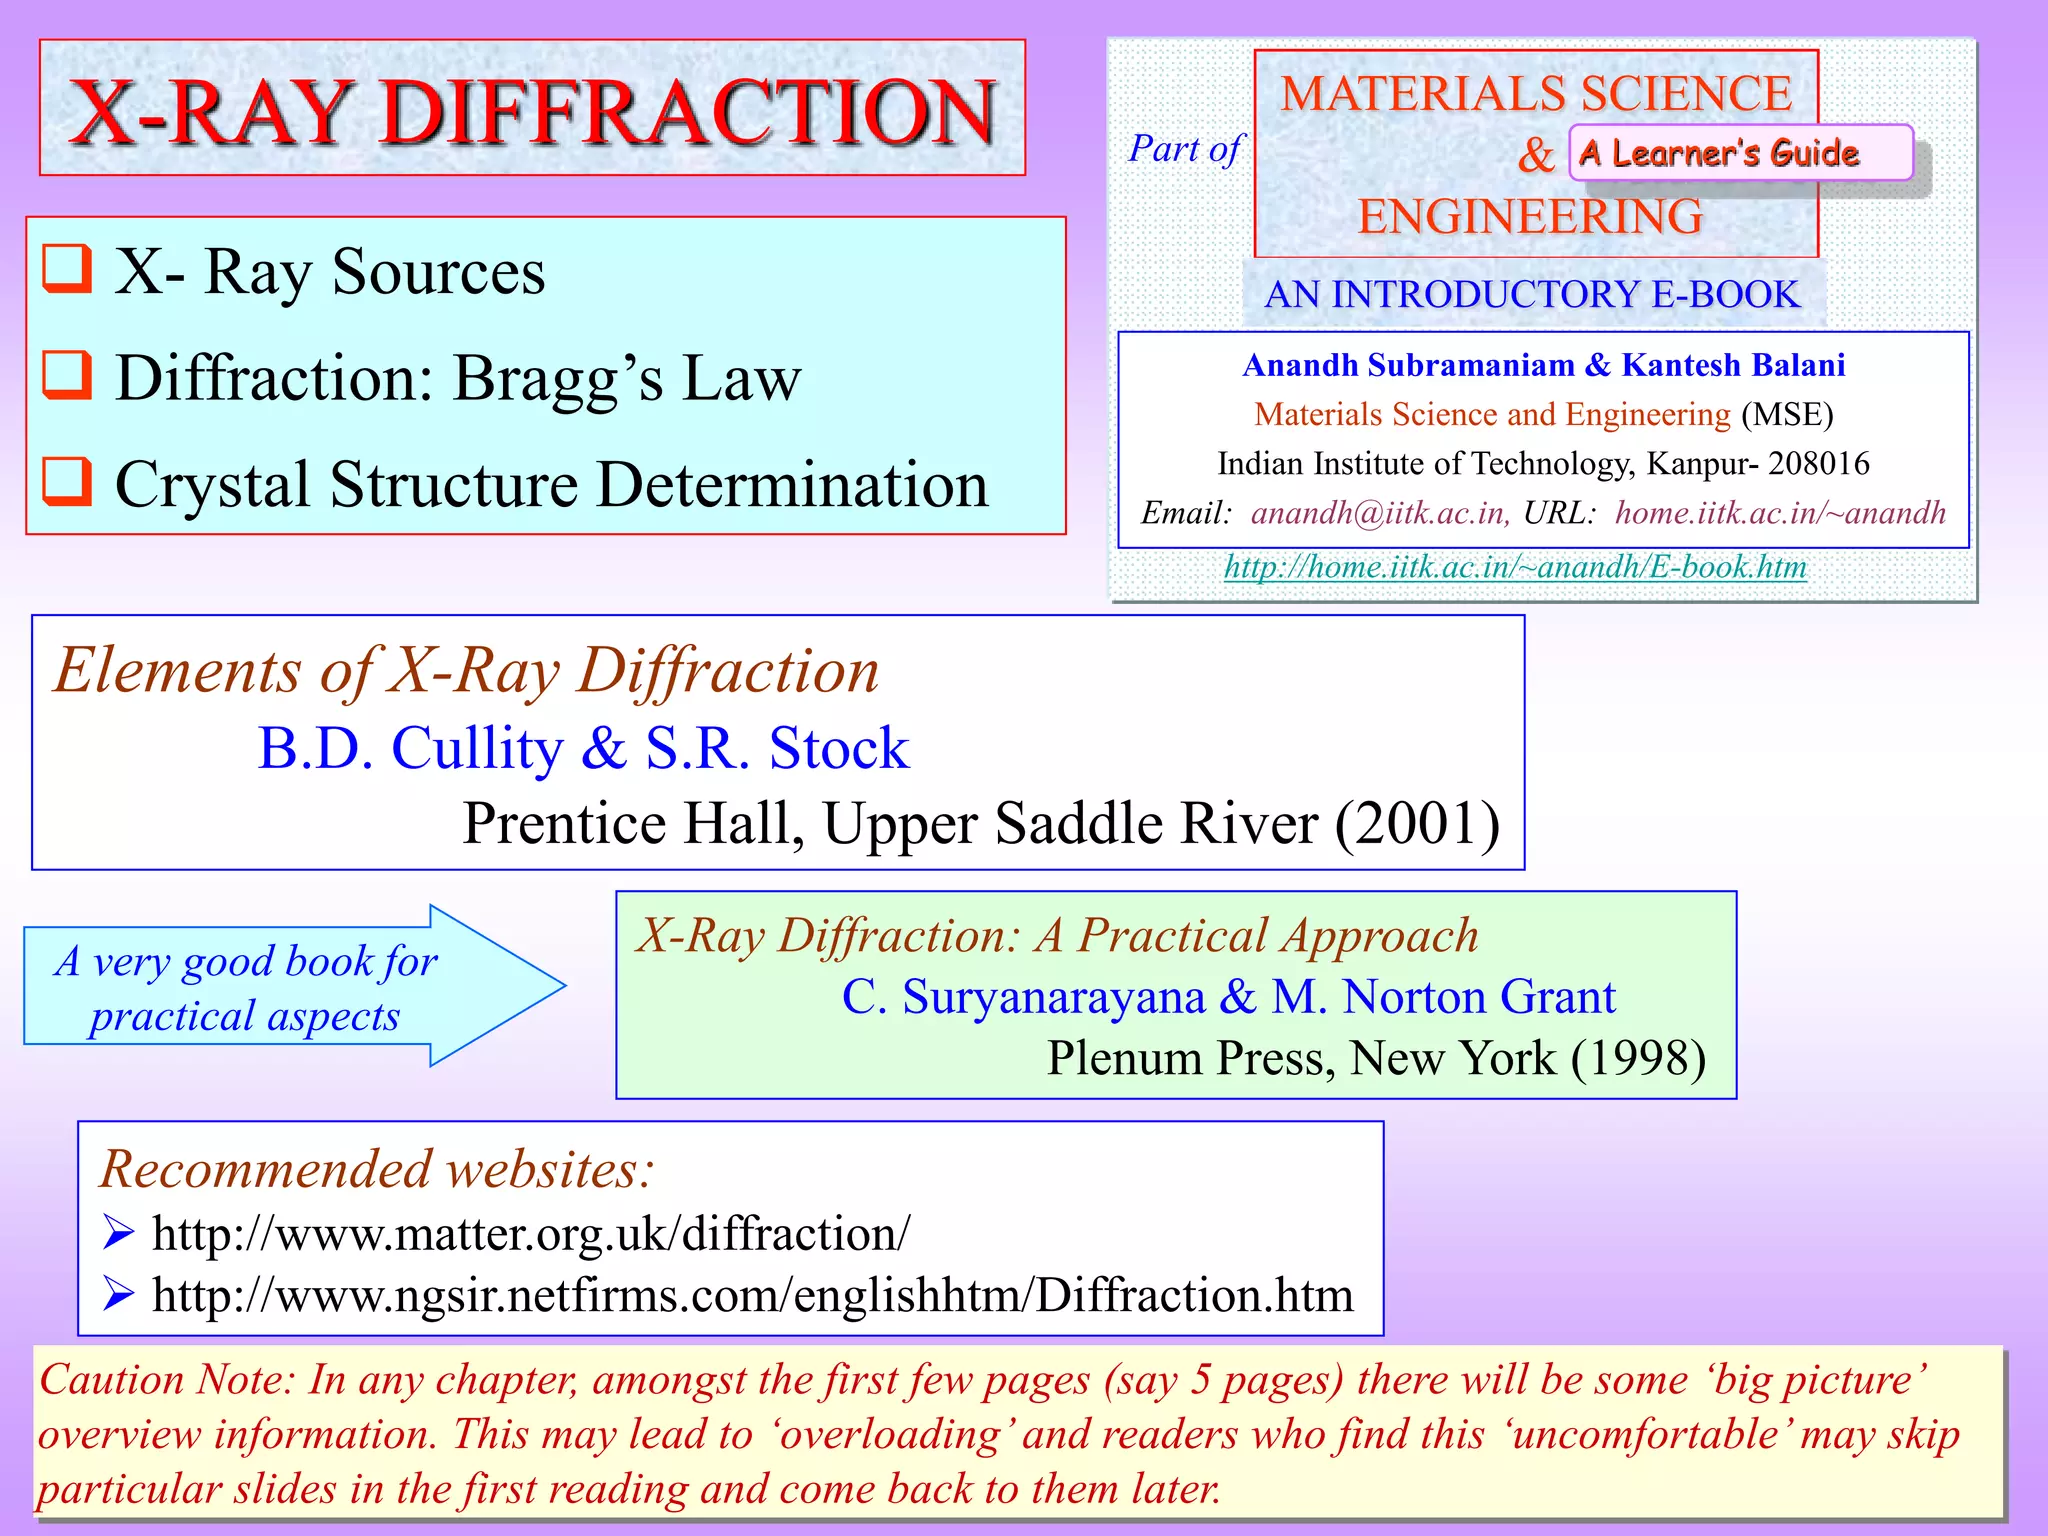
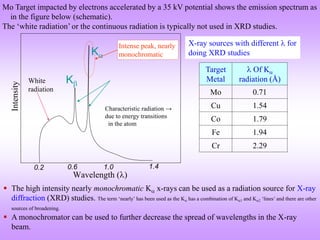
![Laue versus Bragg*
In Laue’s picture constructive and destructive interference at various points in space is
computed using path differences (and hence phase differences) given a crystalline array of
scatterers.
Bragg simplified this picture by considering this process as ‘reflections from atomic planes’.
(More about the Bragg’s viewpoint soon). Click here to know more about the Laue Picture
“The important thing in science is not so much to obtain new facts as to discover
new ways of thinking about them”. William Lawrence Bragg.
*Sir William Henry Bragg and William Lawrence Bragg (this won the father and son team the noble prize in
1915).
[1] http://www.nobelprize.org/nobel_prizes/physics/laureates/1915/index.html
[1]
[1]
Since there are two Braggs involved, wherever we
refer to the law or the equation it has be Braggs’ (and
not Bragg’s as I have done in this chapter)](https://image.slidesharecdn.com/chapter3cxraydiffraction-230403080829-3e82e049/85/Chapter_3c_X_Ray_Diffraction-ppt-16-320.jpg)
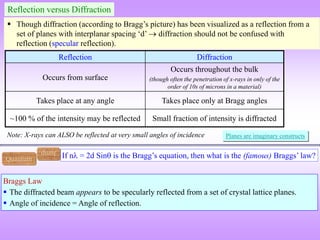
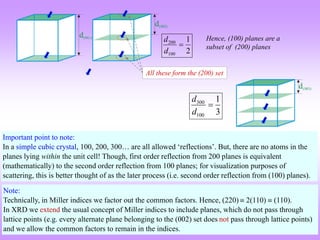
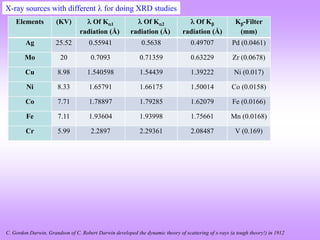
![ “It is difficult to give an explanation of the nature of the semi-transparent layers or planes
that is immediately convincing, as they are a concept rather than a physical reality.
Crystal structures, with their regularly repeating patterns, may be referred to a 3D grid and
the repeating unit of the grid, the unit cell, can be found. The grid may be divided up into
sets of planes in various orientations and it is these planes which are considered in the
derivation of Bragg’s law. In some cases, with simple crystal structures, the planes also
correspond to layers of atoms, but this is not generally the case. See Section 1.5 for further
information. [1]
Some of the assumptions upon which Bragg’s law is based may seem to be rather dubious.
For instance, it is known that diffraction occurs as a result of interaction between X-rays
and atoms. Further, the atoms do not reflect X-rays but scatter or diffract them in all
directions. Nevertheless, the highly simplified treatment that is used in deriving Bragg’s
law gives exactly the same answers as are obtained by a rigorous mathematical treatment.
We therefore happily use terms such as reflexion (often deliberately with this alternative,
but incorrect, spelling!) and bear in mind that we are fortunate to have such a simple and
picturesque, albeit inaccurate, way to describe what in reality is a very complicated
process.” [1]
[1] Anthony R West, Solid State Chemistry and its Applications, Second Edition, John Wiley & Sons Ltd., Chichester, 2014.
More about the Bragg’s viewpoint](https://image.slidesharecdn.com/chapter3cxraydiffraction-230403080829-3e82e049/85/Chapter_3c_X_Ray_Diffraction-ppt-22-320.jpg)

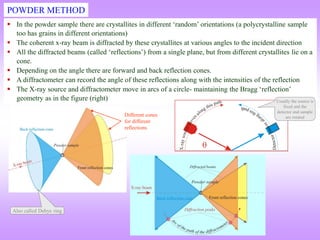
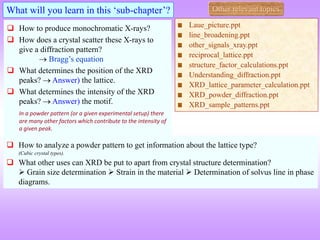
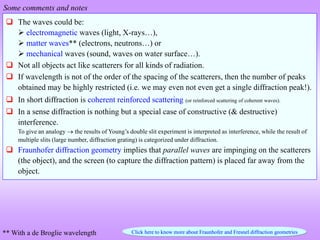
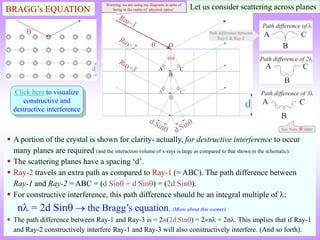
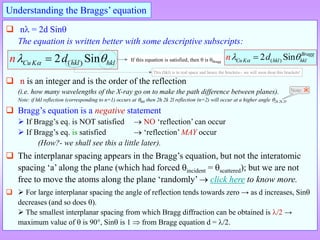
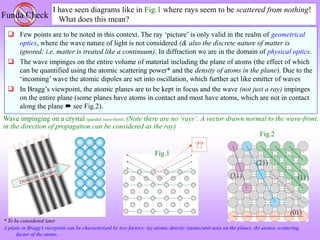
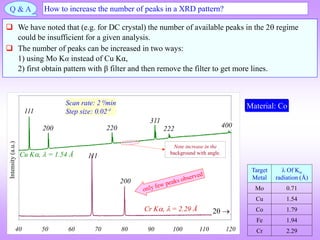
![How to visualize the occurrence of peaks at various angles
It is ‘somewhat difficult’to actually visualize a random assembly of crystallites giving peaks at various angels in a XRD
scan. The figures below are expected to give a ‘visual feel’for the same. [Hypothetical crystal with a = 4Å is assumed with
=1.54Å. Only planes of the type xx0 (like (100,110)are considered].
Random assemblage of
crystallites in a material
As the scan takes place at increasing
angles, planes with suitable ‘d’,
which diffract are ‘picked out’ from
favourably oriented crystallites
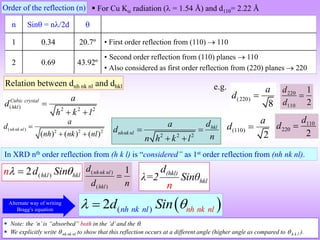
h2 hkl d Sin()
1 100 4.00 0.19 11.10
2 110 2.83 0.27 15.80
3 111 2.31 0.33 19.48
4 200 2.00 0.39 22.64
5 210 1.79 0.43 25.50
6 211 1.63 0.47 28.13
8 220 1.41 0.54 32.99
9 300 1.33 0.58 35.27
10 310 1.26 0.61 37.50
For convenience the source
may be stationary (and the
sample and detector may
rotate– but the effect is
equivalent)](https://image.slidesharecdn.com/chapter3cxraydiffraction-230403080829-3e82e049/85/Chapter_3c_X_Ray_Diffraction-ppt-43-320.jpg)
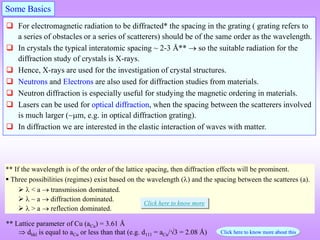
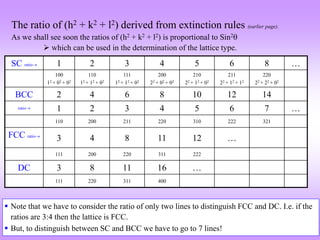
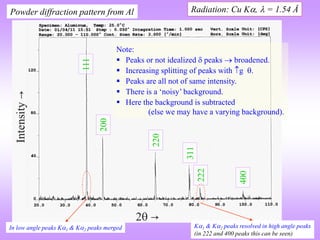
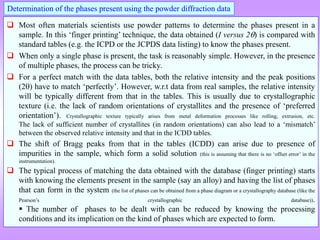
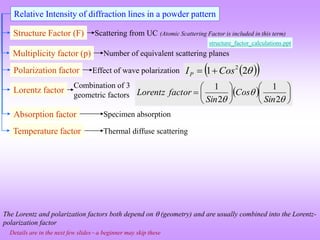
![ In the power diffraction method a 2 versus intensity (I) plot is obtained from the
diffractometer (and associated instrumentation).
The ‘intensity’ is the area under the peak in such a plot (NOT the height of the peak).
The information of importance obtained from such a pattern is the ‘relative intensities*’
and the absolute value of the intensities is of little importance (the longer we irradiate the sample the more will be
the intensity under the peak) (for now).
I is really diffracted energy (as Intensity is Energy/area/time).
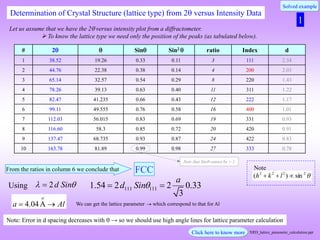
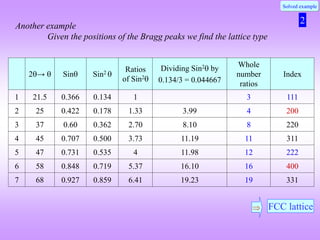
Determination of Crystal Structure from 2 versus Intensity Data in Powder Method
Powder diffraction pattern from Al
Radiation: Cu K, = 1.54 Å
Increasing
Increasing ‘d’
Intensity (I) has units of
[Energy/area/time] → but here
it is plotted as arbitrary units.
The dwell time at each angle should be
sufficient to get a high “peak to
background” ratio.
2 is the angle of deviation of X-rays.
Usually in degrees ()
This is peak (sometimes called a
line- a hangover from Debye
Scherrer camera usage)
* Relative intensity: Intensity of any peak divided by
the intensity of the ‘strongest’peak.
In a powder XRD pattern the
relative intensities of the peaks
are important.
This diffraction pattern resides in reciprocal/Fourier
space & hence, increasing ‘d’ is to the left
Noisy background.](https://image.slidesharecdn.com/chapter3cxraydiffraction-230403080829-3e82e049/85/Chapter_3c_X_Ray_Diffraction-ppt-44-320.jpg)
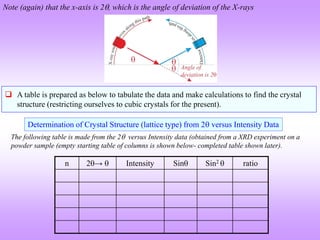
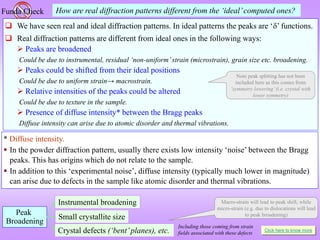
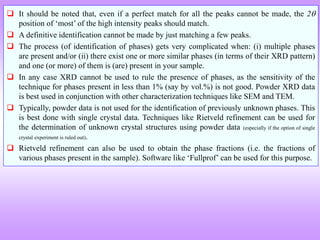
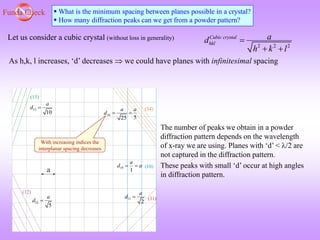
![Funda Check What will determine how many peaks I will get?
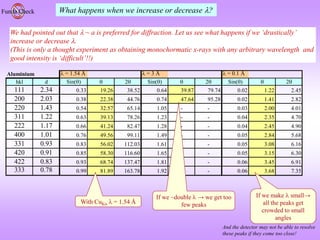
1) smaller the wavelength of the X-rays, more will be the number of peaks possible.
From Bragg’s equation: [=2dSin], (Sin)max will correspond to dmin. (Sin)max=1.
Hence, dmin=/2. Hence, if is small then planes with smaller d spacing (i.e. those which
occur at higher 2 values) will also show up in a XRD patter (powder pattern). Given that
experimentally cannot be greater than 90.
2) Lattice type in SC we will get more peaks as compared to (say) FCC/DC. Other things being
equal.
3) Lower the symmetry of the crystal, more the number of peaks (e.g., in tetragonal crystal
the 100 peak will lie at a different 2 as compared to the 001 peak).
2dSin
min
max
2d
Sin
min
2
d
](https://image.slidesharecdn.com/chapter3cxraydiffraction-230403080829-3e82e049/85/Chapter_3c_X_Ray_Diffraction-ppt-51-320.jpg)
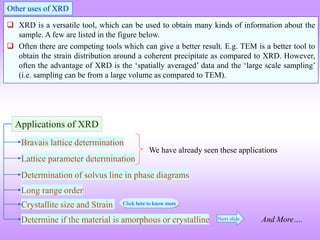
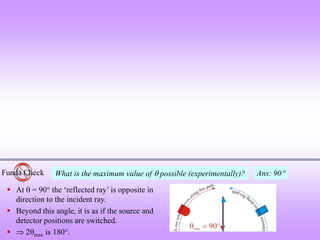
![What is the natural variable for plotting powder diffraction data?
Funda Check
The usual plot is between Intensity and 2. It is not but 2; as this is the angle of deviation
of the incident beam. Could it have not been ?
Usually, the variation of atomic scattering factor (f) is plotted with Sin/.
1
2
hkl
hkl
d
Sin
Braggs’equation can be rewritten as: Hence, Sin/ can also serve as a
‘natural variable’for the abscissa
[Units: /Å1].
Sample: Cu
0.2 0.25 0.3 0.35 0.4 0.45
Sin()/
Intensity
Cu Ka
Cr Ka
Number of lines are limited due to longer wavelength of Cr K
XRD powder pattern taken from a Cu
sample with two sources of radiation:
CuK and CrK .
As expected the peaks coincide if plotted
with Sin/ as the abscissa (as now this is
a measure of dhkl .
Coinciding peaks
Target Metal
Of K
radiation (Å)
Cu K 1.54
Cr K 2.29
111
200](https://image.slidesharecdn.com/chapter3cxraydiffraction-230403080829-3e82e049/85/Chapter_3c_X_Ray_Diffraction-ppt-64-320.jpg)
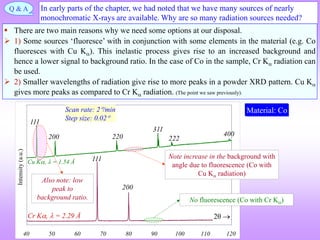
![Q & A What are the ways can we represent dimensions and vectors in a diffraction pattern?
The diffraction pattern resides in the reciprocal space or Fourier space. Reciprocal lattice
points are decorated by intensities to create a reciprocal crystal. We would like to measure
‘distances’ and draw vectors in reciprocal space. Here we consider ways of doing this.
The units in reciprocal space is [m1]. Usually, expressed as Å1 or nm1.
The reciprocal space vectors are vectors in reciprocal space (more details in the link below);
usually marked with a star (*).
There are other ways of representing dimensions/vectors in reciprocal space (as below).
*
b2
*
b1
3
*
b
2
| |
k
4
| | 2 ( ) ( )
G q k Sin Sin
2 ( )
n d Sin
2 ( )
n
d Sin
1 ( )
2
n
Sin
d
](https://image.slidesharecdn.com/chapter3cxraydiffraction-230403080829-3e82e049/85/Chapter_3c_X_Ray_Diffraction-ppt-65-320.jpg)

![Detailed calculation of the intensity of a Bragg peak in a powder pattern
The integrated intensity per unit length of the diffraction line (J/s.m) in the powder
diffraction patterns obtained from a single phase sample can be written as [1]:
2
3 4
0 0
1 2 2
2
32 4
net
I A e
I I I I
r m
(1)
where, A is the cross-sectional area of the incident beam (m2
), λ is the wavelength of the
incident radiation (m), r is the radius of the diffractometer circle (0.185 m under the current
experimental conditions), μ0 is the permeability constant (4π10−7
m.kg/C2
), m is the mass of
the electron (kg), e is the charge on the electron (C) and I0 (= Bi(VVK)n
) is intensity of the
incident beam (J/m2
.s). The term I1 can be written as:
1
n
3 3
0 K
I =Constants(I )(λ )=Constants Bi V-V (λ )
(2)
where, B is a proportionality constant, i and V are the applied current and voltage respectively,
VK is the excitation voltage for the K-shell electron and n is an exponent.
[1] Suryanarayana C and Norton MG. 1998 X-Ray Diffraction A Practical Approach. New York, N.Y: Plenum Press.](https://image.slidesharecdn.com/chapter3cxraydiffraction-230403080829-3e82e049/85/Chapter_3c_X_Ray_Diffraction-ppt-68-320.jpg)


![谷歌留痕技术 [ 𝙩𝙤𝙥 𝟮𝟯𝟯. 𝙘 𝙤𝙢 ]](https://cdn.slidesharecdn.com/ss_thumbnails/top233-260130174328-3833018c-thumbnail.jpg?width=640&height=640&fit=bounds)


