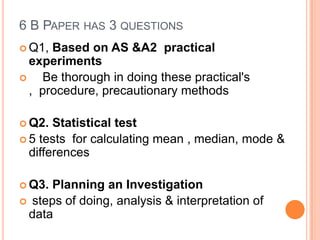
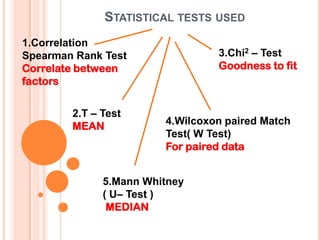
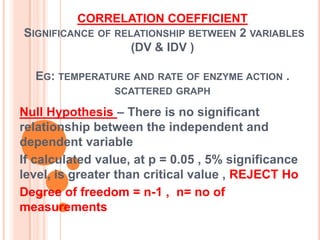
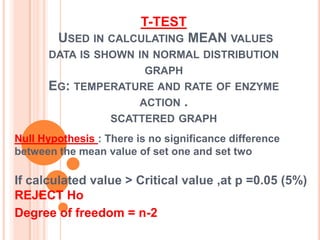
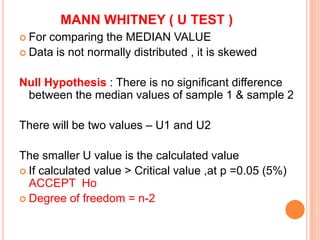
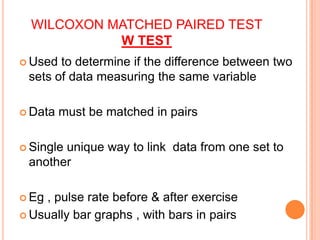
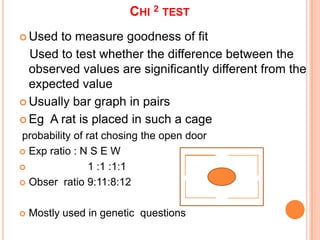
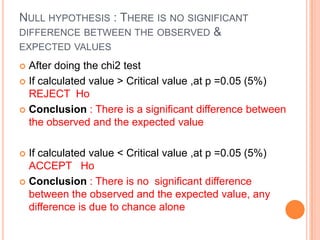
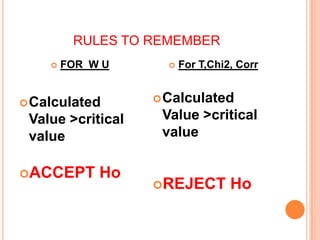
WELCOME

         6BIO8 – paper code


               6B Paper discussion


             By.J.Sharmila Christy
Biology Teacher , Villa International High School, Male’
                                     Republic of Maldives
6 B PAPER HAS 3 QUESTIONS
 Q1, Based on AS &A2 practical
  experiments
    Be thorough in doing these practical's
  , procedure, precautionary methods

 Q2.  Statistical test
 5 tests for calculating mean , median, mode &
  differences

 Q3. Planning an Investigation
 steps of doing, analysis & interpretation of
 data
STATISTICAL TESTS USED
1.Correlation
Spearman Rank Test               3.Chi2 – Test
Correlate between                Goodness to fit
factors


        2.T – Test
        MEAN            4.Wilcoxon paired Match
                        Test( W Test)
                        For paired data


              5.Mann Whitney
              ( U– Test )
               MEDIAN
CORRELATION COEFFICIENT
SIGNIFICANCE OF RELATIONSHIP BETWEEN 2 VARIABLES
                   (DV & IDV )

  EG: TEMPERATURE AND RATE OF ENZYME ACTION .
                 SCATTERED GRAPH

Null Hypothesis – There is no significant
relationship between the independent and
dependent variable
If calculated value, at p = 0.05 , 5% significance
level, is greater than critical value , REJECT Ho
Degree of freedom = n-1 , n= no of
measurements
GRAPH


DV


        IDV
T-TEST
        USED IN CALCULATING MEAN VALUES
      DATA IS SHOWN IN NORMAL DISTRIBUTION
                    GRAPH
      EG: TEMPERATURE AND RATE OF ENZYME
                   ACTION .
                   SCATTERED GRAPH
Null Hypothesis : There is no significance difference
between the mean value of set one and set two

If calculated value > Critical value ,at p =0.05 (5%)
REJECT Ho
Degree of freedom = n-2
MANN WHITNEY ( U TEST )
 Forcomparing the MEDIAN VALUE
 Data is not normally distributed , it is skewed


Null Hypothesis : There is no significant difference
 between the median values of sample 1 & sample 2

There will be two values – U1 and U2

The smaller U value is the calculated value
 If calculated value > Critical value ,at p =0.05 (5%)
  ACCEPT Ho
 Degree of freedom = n-2
Median


         Factor/ unit
WILCOXON MATCHED PAIRED TEST
            W TEST
 Used to determine if the difference between two
 sets of data measuring the same variable

 Data   must be matched in pairs

 Single
       unique way to link data from one set to
 another

 Eg, pulse rate before & after exercise
 Usually bar graphs , with bars in pairs
CHI 2 TEST
 Used to measure goodness of fit
  Used to test whether the difference between the
  observed values are significantly different from the
  expected value
 Usually bar graph in pairs

 Eg A rat is placed in such a cage
probability of rat chosing the open door
 Exp ratio : N S E W

               1 :1 :1:1
 Obser ratio 9:11:8:12


   Mostly used in genetic questions
NULL HYPOTHESIS : THERE IS NO SIGNIFICANT
DIFFERENCE BETWEEN THE OBSERVED &
EXPECTED VALUES
 After doing the chi2 test
 If calculated value > Critical value ,at p =0.05 (5%)
  REJECT Ho
 Conclusion : There is a significant difference between
  the observed and the expected value

 If calculated value < Critical value ,at p =0.05 (5%)
  ACCEPT Ho
 Conclusion : There is no significant difference
  between the observed and the expected value, any
  difference is due to chance alone
RULES TO REMEMBER
       FOR W U         For T,Chi2, Corr


 Calculated        Calculated

 Value >critical    Value >critical
 value              value

ACCEPT      Ho
                   REJECT         Ho

Stats test

  • 1.
    WELCOME 6BIO8 – paper code 6B Paper discussion By.J.Sharmila Christy Biology Teacher , Villa International High School, Male’ Republic of Maldives
  • 2.
    6 B PAPERHAS 3 QUESTIONS  Q1, Based on AS &A2 practical experiments  Be thorough in doing these practical's , procedure, precautionary methods  Q2. Statistical test  5 tests for calculating mean , median, mode & differences  Q3. Planning an Investigation  steps of doing, analysis & interpretation of data
  • 3.
    STATISTICAL TESTS USED 1.Correlation SpearmanRank Test 3.Chi2 – Test Correlate between Goodness to fit factors 2.T – Test MEAN 4.Wilcoxon paired Match Test( W Test) For paired data 5.Mann Whitney ( U– Test ) MEDIAN
  • 4.
    CORRELATION COEFFICIENT SIGNIFICANCE OFRELATIONSHIP BETWEEN 2 VARIABLES (DV & IDV ) EG: TEMPERATURE AND RATE OF ENZYME ACTION . SCATTERED GRAPH Null Hypothesis – There is no significant relationship between the independent and dependent variable If calculated value, at p = 0.05 , 5% significance level, is greater than critical value , REJECT Ho Degree of freedom = n-1 , n= no of measurements
  • 5.
  • 7.
    T-TEST USED IN CALCULATING MEAN VALUES DATA IS SHOWN IN NORMAL DISTRIBUTION GRAPH EG: TEMPERATURE AND RATE OF ENZYME ACTION . SCATTERED GRAPH Null Hypothesis : There is no significance difference between the mean value of set one and set two If calculated value > Critical value ,at p =0.05 (5%) REJECT Ho Degree of freedom = n-2
  • 9.
    MANN WHITNEY (U TEST )  Forcomparing the MEDIAN VALUE  Data is not normally distributed , it is skewed Null Hypothesis : There is no significant difference between the median values of sample 1 & sample 2 There will be two values – U1 and U2 The smaller U value is the calculated value  If calculated value > Critical value ,at p =0.05 (5%) ACCEPT Ho  Degree of freedom = n-2
  • 10.
    Median Factor/ unit
  • 11.
    WILCOXON MATCHED PAIREDTEST W TEST  Used to determine if the difference between two sets of data measuring the same variable  Data must be matched in pairs  Single unique way to link data from one set to another  Eg, pulse rate before & after exercise  Usually bar graphs , with bars in pairs
  • 12.
    CHI 2 TEST Used to measure goodness of fit Used to test whether the difference between the observed values are significantly different from the expected value  Usually bar graph in pairs  Eg A rat is placed in such a cage probability of rat chosing the open door  Exp ratio : N S E W  1 :1 :1:1  Obser ratio 9:11:8:12  Mostly used in genetic questions
  • 13.
    NULL HYPOTHESIS :THERE IS NO SIGNIFICANT DIFFERENCE BETWEEN THE OBSERVED & EXPECTED VALUES  After doing the chi2 test  If calculated value > Critical value ,at p =0.05 (5%) REJECT Ho  Conclusion : There is a significant difference between the observed and the expected value  If calculated value < Critical value ,at p =0.05 (5%) ACCEPT Ho  Conclusion : There is no significant difference between the observed and the expected value, any difference is due to chance alone
  • 14.
    RULES TO REMEMBER  FOR W U  For T,Chi2, Corr  Calculated  Calculated Value >critical Value >critical value value ACCEPT Ho REJECT Ho