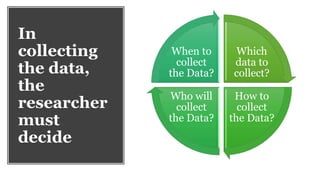
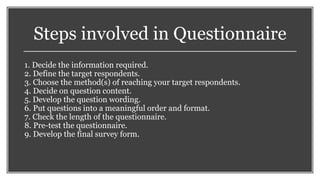
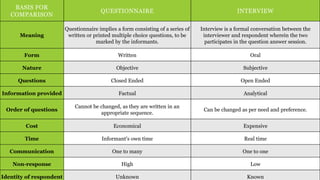
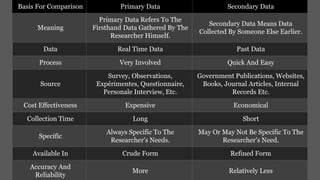
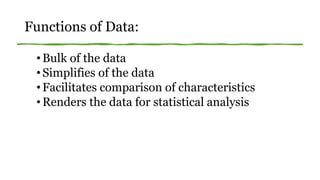
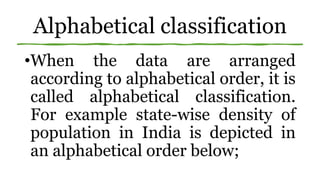
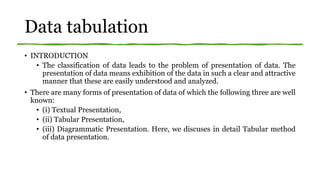
SlideShare a Scribd company logo
CHAPTER 8
DATA COLLECTION
By
Niranjan
H
N
What is Data Collection?
• It is the process by which the researcher collects the
information needed to answer the research problem
• The task of data collection begins after a research
problem has been defined and research design
chalked out.
In
collecting
the data,
the
researcher
must
decide
Which
data to
collect?
How to
collect
the Data?
Who will
collect
the Data?
When to
collect
the Data?
Criteria To
Select
Method
Resources available
Credibility
Analysis and reporting
And the skill of the evaluator
Methods of
Data
collection
Primary
Secondary
Methods Of
Primary
Data
Collection
1. Interviews
2. Surveys & Questionnaires
3. Observation
4. Focus Groups
5. Experiments
1. Interviews
Personal Interview
Telephone Interview
Characteristics
It can be Direct Or Indirect,
Structured Or Unstructured,
Focused Or Unfocused.
Includes a notepad or
recording device to record
conversation.
A cell phone, Laptop, Tablet,
or desktop computer with an
internet connection is
required .
Classifications
• Structured Interviews : In this case, a set of predecided questions are there.
• Unstructured Interviews : In this case, we don’t follow a system of pre-
determined questions.
• Focused Interviews : Attention is focused on the given experience of the
respondent and its possible effects.
• Clinical Interviews : Concerned with broad underlying feelings or
motivations or with the course of an individual’s life experience.
• Group Interviews : a group of 6 to 8 individuals is interviewed.
• Qualitative and quantitative Interviews : divided on the basis of subject
matter i.e., whether qualitative or quantitative.
• Individual Interviews : Interviewer meets a single person and interviews
him.
• Selection Interviews : Done for selection of people for certain Jobs.
Steps for an
effective
Interview
Analyze and
interpret
Analyze and interpret data collected from
the interviewer
Conduct Conduct the Interview
Select Select subject/ Key Responded
Prepare Prepare interview Schedule
Advantages
More information at greater depth can be obtained
Resistance may be overcome by a skilled interviewer
Personal information can be obtained
Better communication
Samples can be collected effectively
Questionnaire can be restructured based on the need
Disadvantages
It is an expensive Method
Interviewer bias
Respondent bias
Time consuming
2. Questionnaires
A Questionnaire is sent ( by post or by mail ) to
the persons concerned with a request to answer
the questions and return the Questionnaire.
A Questionnaire consists of a number of
questions printed in a definite order on a form.
Questionnaire – list of questions framed,
relating to the study.
Ex; Business survey, Economics Survey
Types Of
Questions
Open ended questions
Close ended questions
Characteristics
Of Good
Questionnaire
Should be short and simple
Follow a sequence of questions from easy to difficult
one
Technical terms should be avoided
Should provide adequate space for answers in
questionnaire
Directions regarding the filling of questionnaire should
be given Physical Appearance – Quality of paper, Color
Sequence must be clear
Questionnaire
A set of printed or written
questions with a choice of
answers, devised for the purposes
of a survey or statistical study.
Example: question sheet, set of
questions, survey form.
Queries to be decided while designing a
questionnaire
 What type of information is to collected ?
 What types of questions are to be formulated ?
 What should be the wording of each question ?
 What should be their sequence ?
 What should be the layout of the questionnaire ?
 How to undertake pretesting of the questionnaire?
 How to finalize the QUESTIONNAIRE ?
Steps involved in Questionnaire
1. Decide the information required.
2. Define the target respondents.
3. Choose the method(s) of reaching your target respondents.
4. Decide on question content.
5. Develop the question wording.
6. Put questions into a meaningful order and format.
7. Check the length of the questionnaire.
8. Pre-test the questionnaire.
9. Develop the final survey form.
1. Deciding on the information
required
• It should be noted that one does not start by writing questions. The first
step is to decide 'what are the things one needs to know from the
respondent in order to meet the survey's objectives?
• These, as has been indicated in the opening chapter of this textbook,
should appear in the research brief and the research proposal.
2. Define the target respondents
• in designing the questionnaire, we must take into account factors such as
the age, education, etc. of the target respondents.
3.Choose The Method(s)
Of Reaching Target
Respondents
• Personal Interviews
• Group Or Focus Interviews
• Mailed Questionnaires
• Telephone Interviews.
4. Decide on question content
• Opening questions that are easy to answer and which are not perceived as
being "threatening", and/or are perceived as being interesting, can greatly
assist in gaining the respondent's involvement in the survey and help to
establish a rapport.
• Dummy" questions can disguise the purpose of the survey and/or the
sponsorship of a study
5. Develop the question wording
• Survey questions can be classified into three forms, i.e. closed, open-ended
and open response-option questions. So far only the first of these, i.e.,
closed questions has been discussed. This type of questioning has several
important advantages.
Advantages of close ended
• It provides the respondent with an easy method of indicating his answer -
he does not have to think about how to articulate his answer.· It 'prompts'
the respondent so that the respondent has to rely less on memory in
answering a question.
• Responses can be easily classified, making analysis very straightforward.
• It permits the respondent to specify the answer categories most suitable
for their purposes.
Disadvantages when using such questions
• They do not allow the respondent the opportunity to give a different
response to those suggested.
• They 'suggest' answers that respondents may not have considered before
Open ended Question Advantages
• They allow the respondent to answer in his own words, with no influence
by any specific alternatives suggested by the interviewer.
• They often reveal the issues which are most important to the respondent,
and this may reveal findings which were not originally anticipated when
the survey was initiated.
• Respondents can 'qualify' their answers or emphasize the strength of their
opinions.
Open Ended Question Disadvantages
• Respondents may find it difficult to 'articulate' their responses i.e., to properly
and fully explain their attitudes or motivations.
• Respondents may not give a full answer simply because they may forget to
mention important points. Some respondents need prompting or reminding of
the types of answer they could give.
• Data collected is in the form of verbatim comments - it has to be coded and
reduced to manageable categories. This can be time consuming for analysis and
there are numerous opportunities for error in recording and interpreting the
answers given on the part of interviewers.
• Respondents will tend to answer open questions in different 'dimensions'.
What features of this implement do you
like?
· Performance
· Quality
· Price
· Weight
· Others mentioned:
6. Putting
questions
into a
meaningful
order and
format
Opening questions
Questions flow
Question variety
Closing questions
7. Check the
length of the
questionnaire.
Keep short
as possible
30-
45minutes
8.Piloting the questionnaires
whether the questions as they are worded will achieve the desired
results· whether the questions have been placed in the best order
whether the questions are understood by all classes of respondent
whether additional or specifying questions are needed or whether
some questions should be eliminated
whether the instructions to interviewers are adequate.
9.Develop the final survey form.
All that remains to be done is the mechanical process of laying out
and setting up the questionnaire in its final form.
This will involve grouping and sequencing questions into an
appropriate order, numbering questions, and inserting interviewer
instructions.
Pros of Questionnaire
1. Inexpensive :
• Self administered questionnaire
• Website's questionnaire
• E-mail Questionnaire
2. Questionnaires are practical
• Practical way to gather data
• Targeted Groups
• Pick and choose questions
• For example, KBC Group learned just how practical surveys are.
They were able to spread their quizzes, polls, and questionnaires
during a three-day event. This made collecting real-time feedback
almost effortlessly.
3. Quick Results
• Online and mobile tools
• You don’t need another agency to
deliver you results
• Example:Dajo Associates needed
quality feedback fast. The South
African consulting firm needed a
way to make informed decisions
quickly. An online
questionnaire allowed them to
collect the data they needed in the
shortest time frame possible.
4. Scalability
• Gathers information from a large audience
• Link based Sharing option
• Automated E-mail
• This means that for a relatively low cost, you
can target a city or a country.
• Geography Boundaries are not the limitation
but be aware of culture and language.
5. Comparability
•Qualified data can be used to compare each
other research.
•Measures changes
6. Easy Analysis and
visualization
• Most survey- and questionnaire providers are quantitative in nature
and allow easy analysis of results.
• With built-in tools, it’s easy to analyze your results without a
background in statistics or scientific research.
• Tools like Survey Anyplace offer easy to interpret reports and
visualizations, meaning that you’ll quickly be turning your data into
results. These results can be put in a wide variety of charts and tables
to present them to your boss, colleagues, clients or customers.
7.Questionnaires Don't have time contraints
When using mail-in, online or email questionnaires, there’s no time
limit and there is no one on the other end waiting for an answer.
Respondents can take their time to complete the questionnaire at their
own leisure.
As a bonus, they will often answer more truthfully, as research has
shown that having a researcher present can lead to less honest and
more social desirable answers.
8. Questionnaires can cover every aspect of a topic
Ask As Many Questions As You Like.
10 Questions For Online Surveys
Since They Are Efficient, Cost-effective In Nature And Have An Easy Mode Of
Delivery, There Is No Harm In Creating Multiple Questionnaires, Each
Covering A Subtopic Of The Main Subject, That Build Upon One Another.
Cons of Questionnaire
1. Dishonest answers
• While there are many positives to questionnaires, dishonesty can be an issue.
• Respondents may not be 100% truthful with their answers.
• This can happen for a variety of reasons, including social desirability bias and
attempting to protect privacy.
2. Unanswered questions
Some Questions Will Be
Ignored Or Left Unanswered.
Mark Questions As Required Make Your Questionnaire
Short And Uncomplicated
3. Differences in understanding
and interpretation
• Without someone to explain the questionnaire fully and ensure
everyone has the same understanding, results can be subjective.
• Trouble grasping the questions sometimes
• This miscommunication can lead to skewed results. The best
way to combat this situation is to create simple questions that
are easy to answer.
4. Hard to convey feelings and
emotions
• A survey or questionnaire cannot fully capture
emotional responses or feelings of respondents.
Without administering the questionnaire face-to-face,
there is no way to observe facial expression, reactions or
body language.
• Solution use Likert scale and rating scale
5. Accessibility issues
For Users With A Visual Or Hearing Impairment, Or Other
Impediments Such As Illiteracy.
Always Choose A Questionnaire Platform That Has
Accessibility Options Built In.
6. Questionnaire
or survey fatigue
Survey Response Fatigue:
Frequent survey forms
Survey Taking Fatigue:
Too long questionnaire or
irrelevant content to
respondent.
BASIS FOR
COMPARISON
QUESTIONNAIRE INTERVIEW
Meaning
Questionnaire implies a form consisting of a series of
written or printed multiple choice questions, to be
marked by the informants.
Interview is a formal conversation between the
interviewer and respondent wherein the two
participates in the question answer session.
Form Written Oral
Nature Objective Subjective
Questions Closed Ended Open Ended
Information provided Factual Analytical
Order of questions
Cannot be changed, as they are written in an
appropriate sequence.
Can be changed as per need and preference.
Cost Economical Expensive
Time Informant's own time Real time
Communication One to many One to one
Non-response High Low
Identity of respondent Unknown Known
Observation
Observation is a method that uses
vision/eyes as its main element for
collecting the data. Observation is
watching behavior of persons who
are under observation as it actually
happens without controlling it. It
includes recording information
without asking any questions.
For example
• A researcher can use the observation method in an
organization and record the behavior of the employee
during working hours with his colleagues as well as
with his clients. Are they comfortable with the working
environment and the available resources, will make a
good study for the researcher.
Advantages of the
Observation Method:
1. Directness: The main advantage of observation is its
directness. We can collect data at the time they occur.
2. Natural environment: Data collected in an observation study
describe the observed phenomena as they occur in their
natural settings.
3. Longitudinal analysis: Since the observation is possible to be
conducted in a natural setting, the observer can conduct his
or her study over a much longer period.
4. Non-verbal behavior: Observation is decidedly superior for
collecting data on nonverbal behavior than survey research,
experimentation, or document study.
Disadvantages of the Observation Method:
1. Lack of control: Despite the advantage as achieved from the natural
environment, the observation study, however, has little control over extraneous
variables that may affect the data.
2. Difficulties in quantification: Measurement in observational studies generally
takes the form of observer’s un-quantified perceptions rather than the
quantitative measures often used in the survey and experimental studies.
3. Smallness in sample size: Because observational studies are generally
conducted in-depth, with data that are often subjective and difficult to quantify,
the sample size is usually kept at a minimum. This feature tends to limit the
size of the sample.
4. No opportunity to learn past: In an observational study, there is no way to
know the past. It is also difficult to gather information on such topics as
intentions, opinions, attitudes, or preferences.
Focus Groups
A focus group is a group interview of approximately six to twelve
people who share similar characteristics or common interests. Focus
groups are useful for gathering in-depth information on perceptions,
insights, attitudes, experiences, or beliefs. Focus groups are a
qualitative data collection method, meaning that the data is descriptive
and cannot be measured numerically.
The main methods of data collection during a focus group discussion
include audio and tape recording, note-taking and participant
observation
Advantages of
focus groups
Quick and relatively easy to set
up
The group dynamic can provide
useful information that
individual data collection does
not provide.
Is useful in gaining insight into
a topic that may be more
difficult to gather through other
data collection methods.
Disadvantages of
focus groups
Susceptible to facilitator bias.
The discussion can be dominated or
sidetracked by a few individuals.
Data analysis is time consuming and
needs to be well planned in advance.
Does not provide valid information at the
individual level.
The information is not representative of
other groups.
Experiments
An experiment is a data collection method where a
researcher change some variables and observe
their effect on other variables. The variables that
manipulate are referred to as independent while
the variables that change as a result of
manipulation are dependent variables.
Experimental research can be adapted to different
fields like medical research, agriculture, sociology,
and psychology.
Advantages of Experimental Research
1. It gives researchers a high level of control.
2. It allows researchers to utilize many variations.
3. It can lead to excellent results.
4. It can be used in different fields.
Disadvantages of Experimental Research
1. It can lead to artificial situations
2. It can take a lot of time and money
3. It can be affected by errors
4. It might not be feasible in some situations
SECONDARY DATA
Data gathered and recorded by someone else prior to and for a purpose
other than the current project
Secondary data is data that has been collected for another purpose. It
involves less cost, time and effort
Secondary data is data that is being reused. Usually in a different context.
For example: data from a book.
SOURCES
INTERNAL SOURCES
• Internal sources of secondary data are usually for marketing application-
• Sales Records
• Marketing Activity
• Cost Information
• Distributor reports and feedback
• Customer feedback
EXTERNAL SOURCES
• External sources of secondary data are usually for Financial application-
• Journals
• Books
• Magazines
• Newspaper
• Libraries
• The Internet SOURCES
Advantages of Secondary Data
Ease Of
Access
Low Cost To
Acquire
Clarification
Of Research
Question
May Answer
Research
Question
Disadvantages
of Secondary
Data
Quality of
Research
Not Specific
to
Researcher’s
Needs
Incomplete
Information
Not Timely
Basis For Comparison Primary Data Secondary Data
Meaning
Primary Data Refers To The
Firsthand Data Gathered By The
Researcher Himself.
Secondary Data Means Data
Collected By Someone Else Earlier.
Data Real Time Data Past Data
Process Very Involved Quick And Easy
Source
Survey, Observations,
Expérimentes, Questionnaire,
Personale Interview, Etc.
Government Publications, Websites,
Books, Journal Articles, Internal
Records Etc.
Cost Effectiveness Expensive Economical
Collection Time Long Short
Specific
Always Specific To The
Researcher's Needs.
May Or May Not Be Specific To The
Researcher's Need.
Available In Crude Form Refined Form
Accuracy And
Reliability
More Relatively Less
Classification of data
• Classification is the process of arranging things(either normally or notionally) in
groups or classes according to their resemblances and affinities and give
expressions of the unity attributes that may subsist amongst a diversity
individuals”. – Conner
Functions of Data:
•Bulk of the data
•Simplifies of the data
•Facilitates comparison of characteristics
•Renders the data for statistical analysis
Characteristics of
classification
Unambiguous
Stable
Flexible
Exhaustiveness
Mutually
exclusive
Objectives of
classification
To condense the mass of data
To prepare the data for
tabulation
To study the relationships
To facilitate comparison
Types of
Classification
Geographical (or spatial) classification
Chronological classification
Qualitative classification
Quantitative classification
Alphabetical classification
Geographical (or spatial)
classification
• When the data classified according to
geographical location or region (like
states, cities, regions, zones , areas
etc.) It is called a geographical
classification. For example, the
production of food grains in INDIA
may be presented state- wise in
following manner.
Chronological classification
• When data are observed over a period of time the type of classification is
known as chronological classification ( on the basis of its time of occurrence ).
Various the serious such as National income figures , annual output of wheat
monthly expenditure of a house hold , daily consumptions of milk, etc. Are
some examples of chronological classification . For examples we may present
the figures of population (or production , sales,etc.) as follows……
Qualitative classification
• We may first divide the population in to males and females on the basis of the
attribute ‘sex’, each of this class may be further subdivide into ‘literate’ and
‘illiterate’ on the basis of attribute ‘literacy’ further classification can be made on
the basis of same other attribute ,say , employment.
Quantitative classification
• Quantitative classification is refers to the
classification of data according to some
characteristics that can be measured, such as
height, weight ,income, sales profit,
production,etc. For example, the student of a
college may be classified according to weight as
follows:
Alphabetical classification
•When the data are arranged
according to alphabetical order, it is
called alphabetical classification.
For example state-wise density of
population in India is depicted in
an alphabetical order below;
Scale of measurement
• Nominal, Ordinal, Interval, and Ratio scales can be defined as the 4
measurement scales used to capture and analyze data from survey,
questionnaire, and similar research instruments.
• All of the scales use multiple-choice questions.
• Psychologist Stanley Smith Stevens created these 4 levels of measurement
in 1946.
• Data
• Nominal & Ordinal – Qualitative/Categorical
• Interval & Ratio – Quantitative/Numerical
Scale of
measurement
Nominal Scale
• A nominal scale is the 1st level of measurement scale in which the numbers
serve as “tags” or “labels” to classify or identify the objects. A nominal scale
usually deals with the non-numeric variables or the numbers that
do not have any value
Example:
• An example of a nominal scale measurement is given below:
• What is your gender?
• M- Male
• F- Female
• Here, the variables are used as tags, and the answer to this question should be
either M or F.
• Male may be assigned a number 1, female may be assigned a number 2. The
assignment of number is only for the purpose of identification.
Ordinal Scale
• The ordinal scale is the 2nd level of measurement that reports the
ordering and ranking of data without establishing the degree of
variation between them. Ordinal represents the “order.” Ordinal data is
known as qualitative data or categorical data. It can be grouped, named
and also ranked.
Example:
• Ratings in restaurants
• Rank the following
attributes, while
choosing a restaurant
for dinner. The most
important attribute
may be ranked one,
the next important
may be assigned a
rank of 2 and so on.
Attribute Rank
Food quality
Price
Menu variety
Ambience
Scale
• Volume of production
• Interval Scale
• The interval scale is the 3rd level of measurement
scale. It is defined as a quantitative measurement
scale in which the difference between the two
variables is meaningful. In other words, the
variables are measured in an exact manner,
not as in a relative way in which the presence of zero
is arbitrary.
Example:
Likert
Scale
• How do you rate the work environment of your organization
VERY
GOOD
GOOD NEUTRAL BAD
VERY
BAD
5 4 3 2 1
Ratio Scale
• The ratio scale is the 4th level of measurement
scale, which is quantitative.
• It is a type of variable measurement scale.
• It allows researchers to compare the
differences or intervals.
• The ratio scale has a unique feature. It
possesses the character of the origin or zero
points.
Example:
• What is your weight in Kgs?
• Less than 55 kgs
• 55 – 75 kgs
• 76 – 85 kgs
• 86 – 95 kgs
• More than 95 kgs
SCALE CHARACTERISTICS
EXAMPLE
PERMISSIBLE STATISTICS
Nominal
Numbers are used to
label and classify
objects
Players of Team, Caste,
Religion, Gender, Martial
Status, Brands, Types, etc.,
Percentages', Mode, Chi-Square
test, Contingency coefficient,
Binominal test
Ordinal
Numbers indicate the
relative position of the
objects
Preference ranking, Image
ranking, Social class etc.,
Percentile, Quartiles, Median,
Rank order correlation,
Friedman, ANOVA
Interval
Numbers indicate the
relative position of the
objects
Attitude, opinion, index
number
Product moment, correlation
coefficient test, Z-test, ANOVA,
Regression analysis, Factor
analysis
Ratio
Numbers indicate the
relative position of the
objects
Age, Income, market share,
Sales, cost etc.,
Geometric Mean, Harmonic
Mean and coefficient of
variation.
Preparing the data for analysis
• Data Preparation
• The data collected from the respondents is generally not in the form to be
analyzed directly. After the responses are recorded or received, the next stage
is that of preparation of data i.e. to make the data amenable for appropriate
analysis.
• Data preparation includes editing, coding, and data entry and is the activity
that ensures the accuracy of the data and their conversion from raw form to
reduced and classified forms that are more appropriate for analysis. Preparing
a descriptive statistical summary is another preliminary step leading to an
understanding of the collected data
Data Preparation:
Editing
Coding
Validation of data
Data entry
Classification
Tabulation
EDITING
• The customary first step in analysis is to edit the raw data. Editing
detects errors and omissions, corrects them when possible, and certifies
that maximum data quality standards are achieved. The editor's
purpose is to guarantee that data are:
• 1. Accurate.
• 2. Consistent with the intent of the question and other information in
the survey.
• 3. Uniformly entered.
• 4. Complete.
• 5. Arranged to simplify coding and tabulation
Editing
• Field Editing
• Central Editing
• In large projects, field editing review is a responsibility of the field
supervisor.
• It, should be done soon after the data have been gathered. During
the stress of data collection in a personal interview and paper-
and-pencil recording in an observation, the researcher often uses
ad hoc abbreviations special symbols.
• Soon after the interview, experiment, or observation, the
investigator should review the reporting forms
Central Editing
• It should take place when all forms or schedules have been completed and
returned to the office.
• This type of editing implies that all forms should get a thorough editing by a
single editor in a small study and by a team of editors in case of a large inquiry.
• Editor(s) may correct the obvious errors such as an entry in the wrong place,
entry recorded in months when it should have been recorded in weeks, and the
like. In case of inappropriate on missing replies, the editor can sometimes
determine the proper answer by reviewing the other information in the
schedule. At times, the respondent can be contacted for clarification.
Be familiar with instructions given to
interviewers and coders.
• Do not destroy, erase, or make illegible the original entry by the interviewer;
• Original entries should remain legible.
• Make all editing entries on an instrument in some distinctive color and in a
standardized form.
• Initial all answers changed or supplied.
• Place initials and date of editing on each instrument completed.
ERROR DETECTION
• First step in error detection is to determine whether the software used for data entry and
tabulation will allow the researcher to perform “error edit routines” which identifies the
wrong type of data.
• Example – Say that for a particular field on a given data record, only the codes of 1 or
2 should appear. An error edit routine can display an error message on the data
output if any number other than 1 or 2 has been entered
• Another approach to error detection is for the researcher to review a printed
representation of entered data
• The final approach to error detection is to produce a data/column list for the entered
data. Quick view of this data/column list procedure can indicate to the analyst whether
inappropriate codes were entered into data fields
Data tabulation
• INTRODUCTION
• The classification of data leads to the problem of presentation of data. The
presentation of data means exhibition of the data in such a clear and attractive
manner that these are easily understood and analyzed.
• There are many forms of presentation of data of which the following three are well
known:
• (i) Textual Presentation,
• (ii) Tabular Presentation,
• (iii) Diagrammatic Presentation. Here, we discuses in detail Tabular method
of data presentation.
What is a Table
• A table is a symmetric arrangement of statistical data in rows and columns.
• DEFINITIONS
• “Table involves the orderly and systematic presentation of numerical data in a
form designed to elucidate the problem under consideration.” ---According
Prof. L.R.Connor,”
Features of a good Table
• Title as compatible with the objective of the study
• To facilitate comparison.
• Ideal Size
• Stubs
• Use of Zero
• Heading
• Abbreviation
• Footnote
• Total
• Source of data
• Size of Columns
• Simple, Economical and Attractive
Objectives of Tabulation
• To carry out investigation
• To do comparison
• To locate omissions and errors in the data.
• To use space economically
• To simplify data
• To use it as future reference
Parts of a Table
•Table number
•Title of the table
•Caption and stubs
•Body
•Prefatory or head note
•Footnotes
Types of Tables
•There are three basis of classifying tables.
•I. Purpose of a table
•II. Originality of a table
•III. Construction of a table
I. According to Purpose
• General Purpose Table: General purpose table is that
table which is of general use. It is does not serve any specific
purpose or specific problem under consideration.
• Special Purpose Table: Special Purpose table is that
table which is prepared with some specific purpose in mind.
II. According to Originality
• Original Table: An original table is that in which data
are presented in the same form and way they are
collected.
• Derived Table: A derived table is that in which data
are not presented in the form or way these are collected.
Instead, the data are first converted into ratios or
percentage and then presented.
III. According to Construction
•Simple Table
•Complex Tables
•a. Double or Two-Way Table
•b. Three-Way Table
•c. Manifold (or Higher Order) Table
Simple Table
• In a simple table (also
known as one-way table),
data are presented based
on only one characteristic
Complex Tables
• In a complex table (also known as a manifold table) data are
presented according to two or more characteristics
simultaneously. The complex tables are two-way or three-
way tables according to whether two or three characteristics
are presented simultaneously.
• a. Double or Two-Way Table
• b. Three-Way Table
• c. Manifold (or Higher Order) Table
Double or Two-Way Table
• In such a table, the variable under study is further subdivided into two groups
according to two inter-related characteristics. The two-way table is shown in
Table 1.2.
Three-Way Table
• In such a table, the variable under
study is divided according to three
interrelated characteristics. The
Three- Way Table is shown in
Table 1.3.
Manifold (or Higher Order) Table
• Such tables provide information about a large no of interrelated characteristics in
the data set. Manifold (or Higher Order) Table is shown in Table 1.4.
• CONCLUSION
• With the help of above discussion we can say that table are help us to
represent the data in the form of rows and columns and make it useful for the
purposes.
Reliability and validity test
• Reliability (Cronbach’s Alpha)
• Reliability refers to whether your data collection techniques and analytic
procedures would reproduce consistent findings if they were repeated on
another occasion or if they were replicated by another researcher.
• Don't mix Positive and Negative question
• LIKERT scale variables (only)
Analysis using SPSS
A Commonly accepted rule
Reliability (Cronbach’s Alpha) – Interpretation
Reliability and Scale Statistics
S.No Benefits No. of items Cronbach’s Alpha
1 Monetary 5 Value from spss
2 Non Monetary 5 Value from spss
The Cronbach’s Alpha Value of the monetary benefit is **** which is more
than ***. Hence the reliability of the question is proved. The Cronbach’s
Alpha Value of the non monetary benefit is *** which is more than the value
of ***. Hence the reliability of the question is proved ie., the questionnaire is
reliable for the purpose of data collection.
Validity (Pearson Correlation)
• Validity is about the accuracy of a measure
• Validity is a judgement based on various type of evidence
Go to SPSS
• Transform – Compute Variable – m1 + m2+ m3 + m4+ m5
• Analyse – Corrolate – Bivariate (Move needed variable from left to
right – m1, m2, m3, m4, m5, mtotal) – click ok
• Mtotal values must be > 0.159 is acceptable – Valid
• And also do for nm
DATA ANALYSIS
• Once the data have been collected and prepared for analysis, there
are some basic statistical analysis procedures that researcher will
want to perform
• An obvious need for these statistics comes from the fact that almost all
data sets are disaggregated
• Graphics should be used whenever practical availing information user
to quickly grasp the essence of the information developed in research
project
• Charts also can be an effective visual aid to enhance the
communication process and add clarity and impact to research reports
• i.e Bar Charts,
• Line charts,
• pie or round chart
• Data must be accurately scored and systematically organized to facilitate
data analysis vide
• descriptive analysis,
• univariate ,
• bivariate analysis and
• multivariate analysis
• Descriptive statistics : permit the researcher to describe many pieces of
data with a few indices
• Statistics : indices calculated by the researcher for a sample drawn from a
population
• Parameter : indices calculated by the researcher for an entire population
• (Adults in bangalore city - % that are married, average age)
Types of descriptive statistics
• 1) Graphs
• 2) Measures of Central Tendency
• 3) Measures of central variability
Graphs :
• . Representations of data enabling the researcher to see what
the distribution of scores look like Bar graph, line graph and Pie
or Round chart
Measure of Central Tendency
• Indices enabling the researcher to determine the typical or
average score of a group of scores.
• They are :
• a)Mean –
• The arithmetic average of the sample
• All values of a distribution of responses are summed and divided by the number
of valid responses
• b) Median –
• The middle value of rank ordered distribution
• Exactly half of the responses are above and half are below the median value
• C) Mode –
• The most common value in the set of responses to a question i.e the response most
often given to a question
Measure of Variability
• Indices enabling the researcher to indicate how spread out a group of
scores are They are :
• a)Range
• b) Variance
• c)Standard Deviation
a) Range –
The difference between the highest and lowest score in a distribution
b) Variance –
A summary statistic indicating the degree of variability among participants for
a given variable
The average squared deviation about the mean of distribution of values
c) Standard deviation –
The square root of variance providing an index of variability in the distribution
of scores. It describes the average distance of distribution values from the
mean
How to determine the sample size?
• Sample Size is determined in two steps:
• 1. Calculate the sample size for infinite populations.
• S = Z2 * p * (1-p) /M2
• S = Sample Size for infinite population
• Z = Z score
• P = Population proportion (assumed to be 50% = 0.5)
• M = margin of error
• Z score is determined based on confidence level
• Confidence level: The probability that the value of a parameter falls within a
specified range of values
Confidence Level Z- Value
90% 1.645
95% 1.960
99% 2.576
• If we consider 95% confidence level then Z – score value is 1.96
• Margin of error is a small amount that is allowed for in case of miscalculation or
change of circumstance
• Generally we take margin of error as 5 % i.e m = 0.05
• Z – score = 1.96
• P = 0.5
• M = 0.05
• S = Z2*P*(1-p)/m2
• S = (1.96)2*0.5*(1-0.5)/(0.05)2
• S = 384.16
• So, sample size for the infinite population is ***
• 2. Adjust the sample size to required Population.
• For example, If we want to adjust the sample size to 1,00,000 population
• Then use the following formula for adjusted sample size
• Adjusted sample size = (S) /1 + ((S-1)/Population)
• Adjusted S = 384.16/1+((384.16-1)/100000)
• Adjusted S = 382.69
• Adjusted S = 382.69 =>383
• Finally, we have determined the sample size for 1,00,000 population as 383

More Related Content

What's hot

questionnaire preparation
questionnaire preparationquestionnaire preparation
questionnaire preparation
Booma Thayumanavar
 
Quantitative, qualitative, and mixed method approaches
Quantitative, qualitative, and mixed method approachesQuantitative, qualitative, and mixed method approaches
Quantitative, qualitative, and mixed method approaches
muryantinarima
 
Exploratory Research Design - Meaning and Methods
Exploratory Research Design - Meaning and MethodsExploratory Research Design - Meaning and Methods
Exploratory Research Design - Meaning and Methods
Sundar B N
 
Presentation On Questionnaire
Presentation On QuestionnairePresentation On Questionnaire
Presentation On Questionnaire
Muhammad Usman Memon
 
Research methodology - Analysis of Data
Research methodology - Analysis of DataResearch methodology - Analysis of Data
Research methodology - Analysis of Data
The Stockker
 
Qualitative research - type of data, analysis of qualitative data, software f...
Qualitative research - type of data, analysis of qualitative data, software f...Qualitative research - type of data, analysis of qualitative data, software f...
Qualitative research - type of data, analysis of qualitative data, software f...
Dr.Preeti Tiwari
 
Preparation of questionnaires
Preparation of questionnairesPreparation of questionnaires
Preparation of questionnaires
Jobush Mathew
 
Qualitative Research Method
 Qualitative Research  Method  Qualitative Research  Method
Qualitative Research Method
Kunal Modak
 
Sampling design, sampling errors, sample size determination
Sampling design, sampling errors, sample size determinationSampling design, sampling errors, sample size determination
Sampling design, sampling errors, sample size determination
Vishnupriya T H
 
Primary and Secondary Data collection - Ajay Anoj & Gokul
Primary and Secondary Data collection - Ajay Anoj & GokulPrimary and Secondary Data collection - Ajay Anoj & Gokul
Primary and Secondary Data collection - Ajay Anoj & Gokul
AJAY ANOJ KUMAR
 
Data collection
Data collectionData collection
Data collection
karthik annam
 
Questionnaire Design - Meaning, Types, Layout and Process of Designing Questi...
Questionnaire Design - Meaning, Types, Layout and Process of Designing Questi...Questionnaire Design - Meaning, Types, Layout and Process of Designing Questi...
Questionnaire Design - Meaning, Types, Layout and Process of Designing Questi...
Sundar B N
 
Research design
Research design Research design
Research design
Santosh Bayalkoti
 
Collecting Data Technique
Collecting Data TechniqueCollecting Data Technique
Collecting Data TechniqueAzam Ghaffar
 
Pilot study &pre testing ppt1
Pilot study &pre testing ppt1Pilot study &pre testing ppt1
Pilot study &pre testing ppt1
DrLALWILSON1
 
Data collection method
Data collection methodData collection method
Data collection method
Sanjay Basukala
 
Methods of data collection
Methods of data collectionMethods of data collection
Methods of data collection
Jithin Thomas
 
Research process
Research processResearch process
Research process
Irfan Yaqoob
 

What's hot (20)

questionnaire preparation
questionnaire preparationquestionnaire preparation
questionnaire preparation
 
Quantitative, qualitative, and mixed method approaches
Quantitative, qualitative, and mixed method approachesQuantitative, qualitative, and mixed method approaches
Quantitative, qualitative, and mixed method approaches
 
Chapter 9-METHODS OF DATA COLLECTION
Chapter 9-METHODS OF DATA COLLECTIONChapter 9-METHODS OF DATA COLLECTION
Chapter 9-METHODS OF DATA COLLECTION
 
Exploratory Research Design - Meaning and Methods
Exploratory Research Design - Meaning and MethodsExploratory Research Design - Meaning and Methods
Exploratory Research Design - Meaning and Methods
 
Presentation On Questionnaire
Presentation On QuestionnairePresentation On Questionnaire
Presentation On Questionnaire
 
Research methodology - Analysis of Data
Research methodology - Analysis of DataResearch methodology - Analysis of Data
Research methodology - Analysis of Data
 
Questionnaire
QuestionnaireQuestionnaire
Questionnaire
 
Qualitative research - type of data, analysis of qualitative data, software f...
Qualitative research - type of data, analysis of qualitative data, software f...Qualitative research - type of data, analysis of qualitative data, software f...
Qualitative research - type of data, analysis of qualitative data, software f...
 
Preparation of questionnaires
Preparation of questionnairesPreparation of questionnaires
Preparation of questionnaires
 
Qualitative Research Method
 Qualitative Research  Method  Qualitative Research  Method
Qualitative Research Method
 
Sampling design, sampling errors, sample size determination
Sampling design, sampling errors, sample size determinationSampling design, sampling errors, sample size determination
Sampling design, sampling errors, sample size determination
 
Primary and Secondary Data collection - Ajay Anoj & Gokul
Primary and Secondary Data collection - Ajay Anoj & GokulPrimary and Secondary Data collection - Ajay Anoj & Gokul
Primary and Secondary Data collection - Ajay Anoj & Gokul
 
Data collection
Data collectionData collection
Data collection
 
Questionnaire Design - Meaning, Types, Layout and Process of Designing Questi...
Questionnaire Design - Meaning, Types, Layout and Process of Designing Questi...Questionnaire Design - Meaning, Types, Layout and Process of Designing Questi...
Questionnaire Design - Meaning, Types, Layout and Process of Designing Questi...
 
Research design
Research design Research design
Research design
 
Collecting Data Technique
Collecting Data TechniqueCollecting Data Technique
Collecting Data Technique
 
Pilot study &pre testing ppt1
Pilot study &pre testing ppt1Pilot study &pre testing ppt1
Pilot study &pre testing ppt1
 
Data collection method
Data collection methodData collection method
Data collection method
 
Methods of data collection
Methods of data collectionMethods of data collection
Methods of data collection
 
Research process
Research processResearch process
Research process
 

Similar to Chapter 8 data collection

Tools and techniques for data collection.pptx
Tools and techniques for data collection.pptxTools and techniques for data collection.pptx
Tools and techniques for data collection.pptx
JuruJackline
 
BRS SA 2.0 (2021) - Part 3 of 3.pptx
BRS SA 2.0 (2021) - Part 3 of 3.pptxBRS SA 2.0 (2021) - Part 3 of 3.pptx
BRS SA 2.0 (2021) - Part 3 of 3.pptx
HajiRock
 
Data-collection-methods andtechniques-Abawi-2017.pdf
Data-collection-methods andtechniques-Abawi-2017.pdfData-collection-methods andtechniques-Abawi-2017.pdf
Data-collection-methods andtechniques-Abawi-2017.pdf
MaxWell507618
 
Lesson - Questionnaire.pptx
Lesson         -           Questionnaire.pptxLesson         -           Questionnaire.pptx
Lesson - Questionnaire.pptx
JessaBejer1
 
Survey design 1
Survey design 1Survey design 1
Survey design 1
Bernadeth Ouano
 
Consumer research and in depth interview
Consumer research and in depth interviewConsumer research and in depth interview
Consumer research and in depth interview
Yeshoda Bhargava
 
instruments
instrumentsinstruments
instruments
hayatalakoum1
 
Designing Research Questionnaire & checklist
Designing Research Questionnaire & checklistDesigning Research Questionnaire & checklist
Designing Research Questionnaire & checklist
Dr.Nilima Sonawane
 
Tool design
Tool design Tool design
Lesson - Questionnaire in Research Study.pptx
Lesson - Questionnaire in Research Study.pptxLesson - Questionnaire in Research Study.pptx
Lesson - Questionnaire in Research Study.pptx
JessaBejer1
 
Questionnaire, interview, observation and rating scale
 Questionnaire, interview, observation and rating scale  Questionnaire, interview, observation and rating scale
Questionnaire, interview, observation and rating scale
zunaira rafiq
 
methods of data collection in nursing research
methods of data collection in nursing researchmethods of data collection in nursing research
methods of data collection in nursing research
Pooja Rani
 
Methods of Data Collection_MBA_Research Methodology_Parakramesh Jaroli
Methods of Data Collection_MBA_Research Methodology_Parakramesh JaroliMethods of Data Collection_MBA_Research Methodology_Parakramesh Jaroli
Methods of Data Collection_MBA_Research Methodology_Parakramesh Jaroli
Parakramesh Jaroli
 
Các phương pháp nghiên cứu thị trường - Market research methods
Các phương pháp nghiên cứu thị trường - Market research methodsCác phương pháp nghiên cứu thị trường - Market research methods
Các phương pháp nghiên cứu thị trường - Market research methods
InfoQ - GMO Research
 
Collecting Research Data With Questionnaires And Interviews
Collecting Research Data With Questionnaires And InterviewsCollecting Research Data With Questionnaires And Interviews
Collecting Research Data With Questionnaires And InterviewsAmanda Walker
 
Questionnaire in Market Research.pptx
Questionnaire in Market Research.pptxQuestionnaire in Market Research.pptx
Questionnaire in Market Research.pptx
CHIPPYFRANCIS
 
Tools for data collection
Tools for data collectionTools for data collection
Tools for data collection
shahida baloch
 
Questionnaire design & admin
Questionnaire design & adminQuestionnaire design & admin
Questionnaire design & adminShameem Ali
 
questionnaire_rakhisawlane.ppt
questionnaire_rakhisawlane.pptquestionnaire_rakhisawlane.ppt
questionnaire_rakhisawlane.ppt
RAKHI SAWLANI
 
Survey Research SN.pptx
Survey Research SN.pptxSurvey Research SN.pptx
Survey Research SN.pptx
AdeMuhammad10
 

Similar to Chapter 8 data collection (20)

Tools and techniques for data collection.pptx
Tools and techniques for data collection.pptxTools and techniques for data collection.pptx
Tools and techniques for data collection.pptx
 
BRS SA 2.0 (2021) - Part 3 of 3.pptx
BRS SA 2.0 (2021) - Part 3 of 3.pptxBRS SA 2.0 (2021) - Part 3 of 3.pptx
BRS SA 2.0 (2021) - Part 3 of 3.pptx
 
Data-collection-methods andtechniques-Abawi-2017.pdf
Data-collection-methods andtechniques-Abawi-2017.pdfData-collection-methods andtechniques-Abawi-2017.pdf
Data-collection-methods andtechniques-Abawi-2017.pdf
 
Lesson - Questionnaire.pptx
Lesson         -           Questionnaire.pptxLesson         -           Questionnaire.pptx
Lesson - Questionnaire.pptx
 
Survey design 1
Survey design 1Survey design 1
Survey design 1
 
Consumer research and in depth interview
Consumer research and in depth interviewConsumer research and in depth interview
Consumer research and in depth interview
 
instruments
instrumentsinstruments
instruments
 
Designing Research Questionnaire & checklist
Designing Research Questionnaire & checklistDesigning Research Questionnaire & checklist
Designing Research Questionnaire & checklist
 
Tool design
Tool design Tool design
Tool design
 
Lesson - Questionnaire in Research Study.pptx
Lesson - Questionnaire in Research Study.pptxLesson - Questionnaire in Research Study.pptx
Lesson - Questionnaire in Research Study.pptx
 
Questionnaire, interview, observation and rating scale
 Questionnaire, interview, observation and rating scale  Questionnaire, interview, observation and rating scale
Questionnaire, interview, observation and rating scale
 
methods of data collection in nursing research
methods of data collection in nursing researchmethods of data collection in nursing research
methods of data collection in nursing research
 
Methods of Data Collection_MBA_Research Methodology_Parakramesh Jaroli
Methods of Data Collection_MBA_Research Methodology_Parakramesh JaroliMethods of Data Collection_MBA_Research Methodology_Parakramesh Jaroli
Methods of Data Collection_MBA_Research Methodology_Parakramesh Jaroli
 
Các phương pháp nghiên cứu thị trường - Market research methods
Các phương pháp nghiên cứu thị trường - Market research methodsCác phương pháp nghiên cứu thị trường - Market research methods
Các phương pháp nghiên cứu thị trường - Market research methods
 
Collecting Research Data With Questionnaires And Interviews
Collecting Research Data With Questionnaires And InterviewsCollecting Research Data With Questionnaires And Interviews
Collecting Research Data With Questionnaires And Interviews
 
Questionnaire in Market Research.pptx
Questionnaire in Market Research.pptxQuestionnaire in Market Research.pptx
Questionnaire in Market Research.pptx
 
Tools for data collection
Tools for data collectionTools for data collection
Tools for data collection
 
Questionnaire design & admin
Questionnaire design & adminQuestionnaire design & admin
Questionnaire design & admin
 
questionnaire_rakhisawlane.ppt
questionnaire_rakhisawlane.pptquestionnaire_rakhisawlane.ppt
questionnaire_rakhisawlane.ppt
 
Survey Research SN.pptx
Survey Research SN.pptxSurvey Research SN.pptx
Survey Research SN.pptx
 

More from NiranjanHN3

Chapter 7 sampling methods
Chapter 7 sampling methodsChapter 7 sampling methods
Chapter 7 sampling methods
NiranjanHN3
 
Chapter 6 formulation of hypothesis
Chapter 6 formulation of hypothesisChapter 6 formulation of hypothesis
Chapter 6 formulation of hypothesis
NiranjanHN3
 
Chapter 5 variables and their types
Chapter 5 variables and their typesChapter 5 variables and their types
Chapter 5 variables and their types
NiranjanHN3
 
Chapter 4 research problem
Chapter 4 research problemChapter 4 research problem
Chapter 4 research problem
NiranjanHN3
 
Chapter 3 research design
Chapter 3 research designChapter 3 research design
Chapter 3 research design
NiranjanHN3
 
Chapter 2 research process
Chapter 2 research processChapter 2 research process
Chapter 2 research process
NiranjanHN3
 
Chapter 1 introduction to research
Chapter 1 introduction to researchChapter 1 introduction to research
Chapter 1 introduction to research
NiranjanHN3
 

More from NiranjanHN3 (7)

Chapter 7 sampling methods
Chapter 7 sampling methodsChapter 7 sampling methods
Chapter 7 sampling methods
 
Chapter 6 formulation of hypothesis
Chapter 6 formulation of hypothesisChapter 6 formulation of hypothesis
Chapter 6 formulation of hypothesis
 
Chapter 5 variables and their types
Chapter 5 variables and their typesChapter 5 variables and their types
Chapter 5 variables and their types
 
Chapter 4 research problem
Chapter 4 research problemChapter 4 research problem
Chapter 4 research problem
 
Chapter 3 research design
Chapter 3 research designChapter 3 research design
Chapter 3 research design
 
Chapter 2 research process
Chapter 2 research processChapter 2 research process
Chapter 2 research process
 
Chapter 1 introduction to research
Chapter 1 introduction to researchChapter 1 introduction to research
Chapter 1 introduction to research
 

Recently uploaded

Supporting (UKRI) OA monographs at Salford.pptx
Supporting (UKRI) OA monographs at Salford.pptxSupporting (UKRI) OA monographs at Salford.pptx
Supporting (UKRI) OA monographs at Salford.pptx
Jisc
 
Mule 4.6 & Java 17 Upgrade | MuleSoft Mysore Meetup #46
Mule 4.6 & Java 17 Upgrade | MuleSoft Mysore Meetup #46Mule 4.6 & Java 17 Upgrade | MuleSoft Mysore Meetup #46
Mule 4.6 & Java 17 Upgrade | MuleSoft Mysore Meetup #46
MysoreMuleSoftMeetup
 
Language Across the Curriculm LAC B.Ed.
Language Across the  Curriculm LAC B.Ed.Language Across the  Curriculm LAC B.Ed.
Language Across the Curriculm LAC B.Ed.
Atul Kumar Singh
 
MARUTI SUZUKI- A Successful Joint Venture in India.pptx
MARUTI SUZUKI- A Successful Joint Venture in India.pptxMARUTI SUZUKI- A Successful Joint Venture in India.pptx
MARUTI SUZUKI- A Successful Joint Venture in India.pptx
bennyroshan06
 
Overview on Edible Vaccine: Pros & Cons with Mechanism
Overview on Edible Vaccine: Pros & Cons with MechanismOverview on Edible Vaccine: Pros & Cons with Mechanism
Overview on Edible Vaccine: Pros & Cons with Mechanism
DeeptiGupta154
 
Digital Tools and AI for Teaching Learning and Research
Digital Tools and AI for Teaching Learning and ResearchDigital Tools and AI for Teaching Learning and Research
Digital Tools and AI for Teaching Learning and Research
Vikramjit Singh
 
Fish and Chips - have they had their chips
Fish and Chips - have they had their chipsFish and Chips - have they had their chips
Fish and Chips - have they had their chips
GeoBlogs
 
2024.06.01 Introducing a competency framework for languag learning materials ...
2024.06.01 Introducing a competency framework for languag learning materials ...2024.06.01 Introducing a competency framework for languag learning materials ...
2024.06.01 Introducing a competency framework for languag learning materials ...
Sandy Millin
 
Template Jadual Bertugas Kelas (Boleh Edit)
Template Jadual Bertugas Kelas (Boleh Edit)Template Jadual Bertugas Kelas (Boleh Edit)
Template Jadual Bertugas Kelas (Boleh Edit)
rosedainty
 
The Art Pastor's Guide to Sabbath | Steve Thomason
The Art Pastor's Guide to Sabbath | Steve ThomasonThe Art Pastor's Guide to Sabbath | Steve Thomason
The Art Pastor's Guide to Sabbath | Steve Thomason
Steve Thomason
 
Polish students' mobility in the Czech Republic
Polish students' mobility in the Czech RepublicPolish students' mobility in the Czech Republic
Polish students' mobility in the Czech Republic
Anna Sz.
 
The Roman Empire A Historical Colossus.pdf
The Roman Empire A Historical Colossus.pdfThe Roman Empire A Historical Colossus.pdf
The Roman Empire A Historical Colossus.pdf
kaushalkr1407
 
The Challenger.pdf DNHS Official Publication
The Challenger.pdf DNHS Official PublicationThe Challenger.pdf DNHS Official Publication
The Challenger.pdf DNHS Official Publication
Delapenabediema
 
How to Split Bills in the Odoo 17 POS Module
How to Split Bills in the Odoo 17 POS ModuleHow to Split Bills in the Odoo 17 POS Module
How to Split Bills in the Odoo 17 POS Module
Celine George
 
How to Make a Field invisible in Odoo 17
How to Make a Field invisible in Odoo 17How to Make a Field invisible in Odoo 17
How to Make a Field invisible in Odoo 17
Celine George
 
Synthetic Fiber Construction in lab .pptx
Synthetic Fiber Construction in lab .pptxSynthetic Fiber Construction in lab .pptx
Synthetic Fiber Construction in lab .pptx
Pavel ( NSTU)
 
Basic phrases for greeting and assisting costumers
Basic phrases for greeting and assisting costumersBasic phrases for greeting and assisting costumers
Basic phrases for greeting and assisting costumers
PedroFerreira53928
 
Palestine last event orientationfvgnh .pptx
Palestine last event orientationfvgnh .pptxPalestine last event orientationfvgnh .pptx
Palestine last event orientationfvgnh .pptx
RaedMohamed3
 
1.4 modern child centered education - mahatma gandhi-2.pptx
1.4 modern child centered education - mahatma gandhi-2.pptx1.4 modern child centered education - mahatma gandhi-2.pptx
1.4 modern child centered education - mahatma gandhi-2.pptx
JosvitaDsouza2
 
Phrasal Verbs.XXXXXXXXXXXXXXXXXXXXXXXXXX
Phrasal Verbs.XXXXXXXXXXXXXXXXXXXXXXXXXXPhrasal Verbs.XXXXXXXXXXXXXXXXXXXXXXXXXX
Phrasal Verbs.XXXXXXXXXXXXXXXXXXXXXXXXXX
MIRIAMSALINAS13
 

Recently uploaded (20)

Supporting (UKRI) OA monographs at Salford.pptx
Supporting (UKRI) OA monographs at Salford.pptxSupporting (UKRI) OA monographs at Salford.pptx
Supporting (UKRI) OA monographs at Salford.pptx
 
Mule 4.6 & Java 17 Upgrade | MuleSoft Mysore Meetup #46
Mule 4.6 & Java 17 Upgrade | MuleSoft Mysore Meetup #46Mule 4.6 & Java 17 Upgrade | MuleSoft Mysore Meetup #46
Mule 4.6 & Java 17 Upgrade | MuleSoft Mysore Meetup #46
 
Language Across the Curriculm LAC B.Ed.
Language Across the  Curriculm LAC B.Ed.Language Across the  Curriculm LAC B.Ed.
Language Across the Curriculm LAC B.Ed.
 
MARUTI SUZUKI- A Successful Joint Venture in India.pptx
MARUTI SUZUKI- A Successful Joint Venture in India.pptxMARUTI SUZUKI- A Successful Joint Venture in India.pptx
MARUTI SUZUKI- A Successful Joint Venture in India.pptx
 
Overview on Edible Vaccine: Pros & Cons with Mechanism
Overview on Edible Vaccine: Pros & Cons with MechanismOverview on Edible Vaccine: Pros & Cons with Mechanism
Overview on Edible Vaccine: Pros & Cons with Mechanism
 
Digital Tools and AI for Teaching Learning and Research
Digital Tools and AI for Teaching Learning and ResearchDigital Tools and AI for Teaching Learning and Research
Digital Tools and AI for Teaching Learning and Research
 
Fish and Chips - have they had their chips
Fish and Chips - have they had their chipsFish and Chips - have they had their chips
Fish and Chips - have they had their chips
 
2024.06.01 Introducing a competency framework for languag learning materials ...
2024.06.01 Introducing a competency framework for languag learning materials ...2024.06.01 Introducing a competency framework for languag learning materials ...
2024.06.01 Introducing a competency framework for languag learning materials ...
 
Template Jadual Bertugas Kelas (Boleh Edit)
Template Jadual Bertugas Kelas (Boleh Edit)Template Jadual Bertugas Kelas (Boleh Edit)
Template Jadual Bertugas Kelas (Boleh Edit)
 
The Art Pastor's Guide to Sabbath | Steve Thomason
The Art Pastor's Guide to Sabbath | Steve ThomasonThe Art Pastor's Guide to Sabbath | Steve Thomason
The Art Pastor's Guide to Sabbath | Steve Thomason
 
Polish students' mobility in the Czech Republic
Polish students' mobility in the Czech RepublicPolish students' mobility in the Czech Republic
Polish students' mobility in the Czech Republic
 
The Roman Empire A Historical Colossus.pdf
The Roman Empire A Historical Colossus.pdfThe Roman Empire A Historical Colossus.pdf
The Roman Empire A Historical Colossus.pdf
 
The Challenger.pdf DNHS Official Publication
The Challenger.pdf DNHS Official PublicationThe Challenger.pdf DNHS Official Publication
The Challenger.pdf DNHS Official Publication
 
How to Split Bills in the Odoo 17 POS Module
How to Split Bills in the Odoo 17 POS ModuleHow to Split Bills in the Odoo 17 POS Module
How to Split Bills in the Odoo 17 POS Module
 
How to Make a Field invisible in Odoo 17
How to Make a Field invisible in Odoo 17How to Make a Field invisible in Odoo 17
How to Make a Field invisible in Odoo 17
 
Synthetic Fiber Construction in lab .pptx
Synthetic Fiber Construction in lab .pptxSynthetic Fiber Construction in lab .pptx
Synthetic Fiber Construction in lab .pptx
 
Basic phrases for greeting and assisting costumers
Basic phrases for greeting and assisting costumersBasic phrases for greeting and assisting costumers
Basic phrases for greeting and assisting costumers
 
Palestine last event orientationfvgnh .pptx
Palestine last event orientationfvgnh .pptxPalestine last event orientationfvgnh .pptx
Palestine last event orientationfvgnh .pptx
 
1.4 modern child centered education - mahatma gandhi-2.pptx
1.4 modern child centered education - mahatma gandhi-2.pptx1.4 modern child centered education - mahatma gandhi-2.pptx
1.4 modern child centered education - mahatma gandhi-2.pptx
 
Phrasal Verbs.XXXXXXXXXXXXXXXXXXXXXXXXXX
Phrasal Verbs.XXXXXXXXXXXXXXXXXXXXXXXXXXPhrasal Verbs.XXXXXXXXXXXXXXXXXXXXXXXXXX
Phrasal Verbs.XXXXXXXXXXXXXXXXXXXXXXXXXX
 

Chapter 8 data collection

  • 2. What is Data Collection? • It is the process by which the researcher collects the information needed to answer the research problem • The task of data collection begins after a research problem has been defined and research design chalked out.
  • 3. In collecting the data, the researcher must decide Which data to collect? How to collect the Data? Who will collect the Data? When to collect the Data?
  • 4. Criteria To Select Method Resources available Credibility Analysis and reporting And the skill of the evaluator
  • 6. Methods Of Primary Data Collection 1. Interviews 2. Surveys & Questionnaires 3. Observation 4. Focus Groups 5. Experiments
  • 8. Characteristics It can be Direct Or Indirect, Structured Or Unstructured, Focused Or Unfocused. Includes a notepad or recording device to record conversation. A cell phone, Laptop, Tablet, or desktop computer with an internet connection is required .
  • 9. Classifications • Structured Interviews : In this case, a set of predecided questions are there. • Unstructured Interviews : In this case, we don’t follow a system of pre- determined questions. • Focused Interviews : Attention is focused on the given experience of the respondent and its possible effects. • Clinical Interviews : Concerned with broad underlying feelings or motivations or with the course of an individual’s life experience. • Group Interviews : a group of 6 to 8 individuals is interviewed. • Qualitative and quantitative Interviews : divided on the basis of subject matter i.e., whether qualitative or quantitative. • Individual Interviews : Interviewer meets a single person and interviews him. • Selection Interviews : Done for selection of people for certain Jobs.
  • 10. Steps for an effective Interview Analyze and interpret Analyze and interpret data collected from the interviewer Conduct Conduct the Interview Select Select subject/ Key Responded Prepare Prepare interview Schedule
  • 11. Advantages More information at greater depth can be obtained Resistance may be overcome by a skilled interviewer Personal information can be obtained Better communication Samples can be collected effectively Questionnaire can be restructured based on the need
  • 12. Disadvantages It is an expensive Method Interviewer bias Respondent bias Time consuming
  • 13. 2. Questionnaires A Questionnaire is sent ( by post or by mail ) to the persons concerned with a request to answer the questions and return the Questionnaire. A Questionnaire consists of a number of questions printed in a definite order on a form. Questionnaire – list of questions framed, relating to the study. Ex; Business survey, Economics Survey
  • 14. Types Of Questions Open ended questions Close ended questions
  • 15. Characteristics Of Good Questionnaire Should be short and simple Follow a sequence of questions from easy to difficult one Technical terms should be avoided Should provide adequate space for answers in questionnaire Directions regarding the filling of questionnaire should be given Physical Appearance – Quality of paper, Color Sequence must be clear
  • 16. Questionnaire A set of printed or written questions with a choice of answers, devised for the purposes of a survey or statistical study. Example: question sheet, set of questions, survey form.
  • 17. Queries to be decided while designing a questionnaire  What type of information is to collected ?  What types of questions are to be formulated ?  What should be the wording of each question ?  What should be their sequence ?  What should be the layout of the questionnaire ?  How to undertake pretesting of the questionnaire?  How to finalize the QUESTIONNAIRE ?
  • 18. Steps involved in Questionnaire 1. Decide the information required. 2. Define the target respondents. 3. Choose the method(s) of reaching your target respondents. 4. Decide on question content. 5. Develop the question wording. 6. Put questions into a meaningful order and format. 7. Check the length of the questionnaire. 8. Pre-test the questionnaire. 9. Develop the final survey form.
  • 19. 1. Deciding on the information required • It should be noted that one does not start by writing questions. The first step is to decide 'what are the things one needs to know from the respondent in order to meet the survey's objectives? • These, as has been indicated in the opening chapter of this textbook, should appear in the research brief and the research proposal.
  • 20. 2. Define the target respondents • in designing the questionnaire, we must take into account factors such as the age, education, etc. of the target respondents.
  • 21. 3.Choose The Method(s) Of Reaching Target Respondents • Personal Interviews • Group Or Focus Interviews • Mailed Questionnaires • Telephone Interviews.
  • 22. 4. Decide on question content • Opening questions that are easy to answer and which are not perceived as being "threatening", and/or are perceived as being interesting, can greatly assist in gaining the respondent's involvement in the survey and help to establish a rapport. • Dummy" questions can disguise the purpose of the survey and/or the sponsorship of a study
  • 23. 5. Develop the question wording • Survey questions can be classified into three forms, i.e. closed, open-ended and open response-option questions. So far only the first of these, i.e., closed questions has been discussed. This type of questioning has several important advantages.
  • 24. Advantages of close ended • It provides the respondent with an easy method of indicating his answer - he does not have to think about how to articulate his answer.· It 'prompts' the respondent so that the respondent has to rely less on memory in answering a question. • Responses can be easily classified, making analysis very straightforward. • It permits the respondent to specify the answer categories most suitable for their purposes.
  • 25. Disadvantages when using such questions • They do not allow the respondent the opportunity to give a different response to those suggested. • They 'suggest' answers that respondents may not have considered before
  • 26. Open ended Question Advantages • They allow the respondent to answer in his own words, with no influence by any specific alternatives suggested by the interviewer. • They often reveal the issues which are most important to the respondent, and this may reveal findings which were not originally anticipated when the survey was initiated. • Respondents can 'qualify' their answers or emphasize the strength of their opinions.
  • 27. Open Ended Question Disadvantages • Respondents may find it difficult to 'articulate' their responses i.e., to properly and fully explain their attitudes or motivations. • Respondents may not give a full answer simply because they may forget to mention important points. Some respondents need prompting or reminding of the types of answer they could give. • Data collected is in the form of verbatim comments - it has to be coded and reduced to manageable categories. This can be time consuming for analysis and there are numerous opportunities for error in recording and interpreting the answers given on the part of interviewers. • Respondents will tend to answer open questions in different 'dimensions'.
  • 28. What features of this implement do you like? · Performance · Quality · Price · Weight · Others mentioned:
  • 29. 6. Putting questions into a meaningful order and format Opening questions Questions flow Question variety Closing questions
  • 30. 7. Check the length of the questionnaire. Keep short as possible 30- 45minutes
  • 31. 8.Piloting the questionnaires whether the questions as they are worded will achieve the desired results· whether the questions have been placed in the best order whether the questions are understood by all classes of respondent whether additional or specifying questions are needed or whether some questions should be eliminated whether the instructions to interviewers are adequate.
  • 32. 9.Develop the final survey form. All that remains to be done is the mechanical process of laying out and setting up the questionnaire in its final form. This will involve grouping and sequencing questions into an appropriate order, numbering questions, and inserting interviewer instructions.
  • 33. Pros of Questionnaire 1. Inexpensive : • Self administered questionnaire • Website's questionnaire • E-mail Questionnaire
  • 34. 2. Questionnaires are practical • Practical way to gather data • Targeted Groups • Pick and choose questions • For example, KBC Group learned just how practical surveys are. They were able to spread their quizzes, polls, and questionnaires during a three-day event. This made collecting real-time feedback almost effortlessly.
  • 35. 3. Quick Results • Online and mobile tools • You don’t need another agency to deliver you results • Example:Dajo Associates needed quality feedback fast. The South African consulting firm needed a way to make informed decisions quickly. An online questionnaire allowed them to collect the data they needed in the shortest time frame possible.
  • 36. 4. Scalability • Gathers information from a large audience • Link based Sharing option • Automated E-mail • This means that for a relatively low cost, you can target a city or a country. • Geography Boundaries are not the limitation but be aware of culture and language.
  • 37. 5. Comparability •Qualified data can be used to compare each other research. •Measures changes
  • 38. 6. Easy Analysis and visualization • Most survey- and questionnaire providers are quantitative in nature and allow easy analysis of results. • With built-in tools, it’s easy to analyze your results without a background in statistics or scientific research. • Tools like Survey Anyplace offer easy to interpret reports and visualizations, meaning that you’ll quickly be turning your data into results. These results can be put in a wide variety of charts and tables to present them to your boss, colleagues, clients or customers.
  • 39. 7.Questionnaires Don't have time contraints When using mail-in, online or email questionnaires, there’s no time limit and there is no one on the other end waiting for an answer. Respondents can take their time to complete the questionnaire at their own leisure. As a bonus, they will often answer more truthfully, as research has shown that having a researcher present can lead to less honest and more social desirable answers.
  • 40. 8. Questionnaires can cover every aspect of a topic Ask As Many Questions As You Like. 10 Questions For Online Surveys Since They Are Efficient, Cost-effective In Nature And Have An Easy Mode Of Delivery, There Is No Harm In Creating Multiple Questionnaires, Each Covering A Subtopic Of The Main Subject, That Build Upon One Another.
  • 41. Cons of Questionnaire 1. Dishonest answers • While there are many positives to questionnaires, dishonesty can be an issue. • Respondents may not be 100% truthful with their answers. • This can happen for a variety of reasons, including social desirability bias and attempting to protect privacy.
  • 42. 2. Unanswered questions Some Questions Will Be Ignored Or Left Unanswered. Mark Questions As Required Make Your Questionnaire Short And Uncomplicated
  • 43. 3. Differences in understanding and interpretation • Without someone to explain the questionnaire fully and ensure everyone has the same understanding, results can be subjective. • Trouble grasping the questions sometimes • This miscommunication can lead to skewed results. The best way to combat this situation is to create simple questions that are easy to answer.
  • 44. 4. Hard to convey feelings and emotions • A survey or questionnaire cannot fully capture emotional responses or feelings of respondents. Without administering the questionnaire face-to-face, there is no way to observe facial expression, reactions or body language. • Solution use Likert scale and rating scale
  • 45. 5. Accessibility issues For Users With A Visual Or Hearing Impairment, Or Other Impediments Such As Illiteracy. Always Choose A Questionnaire Platform That Has Accessibility Options Built In.
  • 46. 6. Questionnaire or survey fatigue Survey Response Fatigue: Frequent survey forms Survey Taking Fatigue: Too long questionnaire or irrelevant content to respondent.
  • 47. BASIS FOR COMPARISON QUESTIONNAIRE INTERVIEW Meaning Questionnaire implies a form consisting of a series of written or printed multiple choice questions, to be marked by the informants. Interview is a formal conversation between the interviewer and respondent wherein the two participates in the question answer session. Form Written Oral Nature Objective Subjective Questions Closed Ended Open Ended Information provided Factual Analytical Order of questions Cannot be changed, as they are written in an appropriate sequence. Can be changed as per need and preference. Cost Economical Expensive Time Informant's own time Real time Communication One to many One to one Non-response High Low Identity of respondent Unknown Known
  • 48. Observation Observation is a method that uses vision/eyes as its main element for collecting the data. Observation is watching behavior of persons who are under observation as it actually happens without controlling it. It includes recording information without asking any questions.
  • 49. For example • A researcher can use the observation method in an organization and record the behavior of the employee during working hours with his colleagues as well as with his clients. Are they comfortable with the working environment and the available resources, will make a good study for the researcher.
  • 50. Advantages of the Observation Method: 1. Directness: The main advantage of observation is its directness. We can collect data at the time they occur. 2. Natural environment: Data collected in an observation study describe the observed phenomena as they occur in their natural settings. 3. Longitudinal analysis: Since the observation is possible to be conducted in a natural setting, the observer can conduct his or her study over a much longer period. 4. Non-verbal behavior: Observation is decidedly superior for collecting data on nonverbal behavior than survey research, experimentation, or document study.
  • 51. Disadvantages of the Observation Method: 1. Lack of control: Despite the advantage as achieved from the natural environment, the observation study, however, has little control over extraneous variables that may affect the data. 2. Difficulties in quantification: Measurement in observational studies generally takes the form of observer’s un-quantified perceptions rather than the quantitative measures often used in the survey and experimental studies. 3. Smallness in sample size: Because observational studies are generally conducted in-depth, with data that are often subjective and difficult to quantify, the sample size is usually kept at a minimum. This feature tends to limit the size of the sample. 4. No opportunity to learn past: In an observational study, there is no way to know the past. It is also difficult to gather information on such topics as intentions, opinions, attitudes, or preferences.
  • 52. Focus Groups A focus group is a group interview of approximately six to twelve people who share similar characteristics or common interests. Focus groups are useful for gathering in-depth information on perceptions, insights, attitudes, experiences, or beliefs. Focus groups are a qualitative data collection method, meaning that the data is descriptive and cannot be measured numerically. The main methods of data collection during a focus group discussion include audio and tape recording, note-taking and participant observation
  • 53. Advantages of focus groups Quick and relatively easy to set up The group dynamic can provide useful information that individual data collection does not provide. Is useful in gaining insight into a topic that may be more difficult to gather through other data collection methods.
  • 54. Disadvantages of focus groups Susceptible to facilitator bias. The discussion can be dominated or sidetracked by a few individuals. Data analysis is time consuming and needs to be well planned in advance. Does not provide valid information at the individual level. The information is not representative of other groups.
  • 55. Experiments An experiment is a data collection method where a researcher change some variables and observe their effect on other variables. The variables that manipulate are referred to as independent while the variables that change as a result of manipulation are dependent variables. Experimental research can be adapted to different fields like medical research, agriculture, sociology, and psychology.
  • 56. Advantages of Experimental Research 1. It gives researchers a high level of control. 2. It allows researchers to utilize many variations. 3. It can lead to excellent results. 4. It can be used in different fields.
  • 57. Disadvantages of Experimental Research 1. It can lead to artificial situations 2. It can take a lot of time and money 3. It can be affected by errors 4. It might not be feasible in some situations
  • 58.
  • 59. SECONDARY DATA Data gathered and recorded by someone else prior to and for a purpose other than the current project Secondary data is data that has been collected for another purpose. It involves less cost, time and effort Secondary data is data that is being reused. Usually in a different context. For example: data from a book.
  • 60. SOURCES INTERNAL SOURCES • Internal sources of secondary data are usually for marketing application- • Sales Records • Marketing Activity • Cost Information • Distributor reports and feedback • Customer feedback
  • 61. EXTERNAL SOURCES • External sources of secondary data are usually for Financial application- • Journals • Books • Magazines • Newspaper • Libraries • The Internet SOURCES
  • 62. Advantages of Secondary Data Ease Of Access Low Cost To Acquire Clarification Of Research Question May Answer Research Question
  • 63. Disadvantages of Secondary Data Quality of Research Not Specific to Researcher’s Needs Incomplete Information Not Timely
  • 64. Basis For Comparison Primary Data Secondary Data Meaning Primary Data Refers To The Firsthand Data Gathered By The Researcher Himself. Secondary Data Means Data Collected By Someone Else Earlier. Data Real Time Data Past Data Process Very Involved Quick And Easy Source Survey, Observations, Expérimentes, Questionnaire, Personale Interview, Etc. Government Publications, Websites, Books, Journal Articles, Internal Records Etc. Cost Effectiveness Expensive Economical Collection Time Long Short Specific Always Specific To The Researcher's Needs. May Or May Not Be Specific To The Researcher's Need. Available In Crude Form Refined Form Accuracy And Reliability More Relatively Less
  • 65. Classification of data • Classification is the process of arranging things(either normally or notionally) in groups or classes according to their resemblances and affinities and give expressions of the unity attributes that may subsist amongst a diversity individuals”. – Conner
  • 66. Functions of Data: •Bulk of the data •Simplifies of the data •Facilitates comparison of characteristics •Renders the data for statistical analysis
  • 68. Objectives of classification To condense the mass of data To prepare the data for tabulation To study the relationships To facilitate comparison
  • 69. Types of Classification Geographical (or spatial) classification Chronological classification Qualitative classification Quantitative classification Alphabetical classification
  • 70. Geographical (or spatial) classification • When the data classified according to geographical location or region (like states, cities, regions, zones , areas etc.) It is called a geographical classification. For example, the production of food grains in INDIA may be presented state- wise in following manner.
  • 71. Chronological classification • When data are observed over a period of time the type of classification is known as chronological classification ( on the basis of its time of occurrence ). Various the serious such as National income figures , annual output of wheat monthly expenditure of a house hold , daily consumptions of milk, etc. Are some examples of chronological classification . For examples we may present the figures of population (or production , sales,etc.) as follows……
  • 72. Qualitative classification • We may first divide the population in to males and females on the basis of the attribute ‘sex’, each of this class may be further subdivide into ‘literate’ and ‘illiterate’ on the basis of attribute ‘literacy’ further classification can be made on the basis of same other attribute ,say , employment.
  • 73. Quantitative classification • Quantitative classification is refers to the classification of data according to some characteristics that can be measured, such as height, weight ,income, sales profit, production,etc. For example, the student of a college may be classified according to weight as follows:
  • 74.
  • 75. Alphabetical classification •When the data are arranged according to alphabetical order, it is called alphabetical classification. For example state-wise density of population in India is depicted in an alphabetical order below;
  • 76.
  • 77. Scale of measurement • Nominal, Ordinal, Interval, and Ratio scales can be defined as the 4 measurement scales used to capture and analyze data from survey, questionnaire, and similar research instruments. • All of the scales use multiple-choice questions. • Psychologist Stanley Smith Stevens created these 4 levels of measurement in 1946. • Data • Nominal & Ordinal – Qualitative/Categorical • Interval & Ratio – Quantitative/Numerical
  • 79. Nominal Scale • A nominal scale is the 1st level of measurement scale in which the numbers serve as “tags” or “labels” to classify or identify the objects. A nominal scale usually deals with the non-numeric variables or the numbers that do not have any value
  • 80. Example: • An example of a nominal scale measurement is given below: • What is your gender? • M- Male • F- Female • Here, the variables are used as tags, and the answer to this question should be either M or F. • Male may be assigned a number 1, female may be assigned a number 2. The assignment of number is only for the purpose of identification.
  • 81. Ordinal Scale • The ordinal scale is the 2nd level of measurement that reports the ordering and ranking of data without establishing the degree of variation between them. Ordinal represents the “order.” Ordinal data is known as qualitative data or categorical data. It can be grouped, named and also ranked.
  • 82. Example: • Ratings in restaurants • Rank the following attributes, while choosing a restaurant for dinner. The most important attribute may be ranked one, the next important may be assigned a rank of 2 and so on. Attribute Rank Food quality Price Menu variety Ambience
  • 83. Scale • Volume of production • Interval Scale • The interval scale is the 3rd level of measurement scale. It is defined as a quantitative measurement scale in which the difference between the two variables is meaningful. In other words, the variables are measured in an exact manner, not as in a relative way in which the presence of zero is arbitrary.
  • 84. Example: Likert Scale • How do you rate the work environment of your organization VERY GOOD GOOD NEUTRAL BAD VERY BAD 5 4 3 2 1
  • 85. Ratio Scale • The ratio scale is the 4th level of measurement scale, which is quantitative. • It is a type of variable measurement scale. • It allows researchers to compare the differences or intervals. • The ratio scale has a unique feature. It possesses the character of the origin or zero points.
  • 86. Example: • What is your weight in Kgs? • Less than 55 kgs • 55 – 75 kgs • 76 – 85 kgs • 86 – 95 kgs • More than 95 kgs
  • 87. SCALE CHARACTERISTICS EXAMPLE PERMISSIBLE STATISTICS Nominal Numbers are used to label and classify objects Players of Team, Caste, Religion, Gender, Martial Status, Brands, Types, etc., Percentages', Mode, Chi-Square test, Contingency coefficient, Binominal test Ordinal Numbers indicate the relative position of the objects Preference ranking, Image ranking, Social class etc., Percentile, Quartiles, Median, Rank order correlation, Friedman, ANOVA Interval Numbers indicate the relative position of the objects Attitude, opinion, index number Product moment, correlation coefficient test, Z-test, ANOVA, Regression analysis, Factor analysis Ratio Numbers indicate the relative position of the objects Age, Income, market share, Sales, cost etc., Geometric Mean, Harmonic Mean and coefficient of variation.
  • 88. Preparing the data for analysis • Data Preparation • The data collected from the respondents is generally not in the form to be analyzed directly. After the responses are recorded or received, the next stage is that of preparation of data i.e. to make the data amenable for appropriate analysis. • Data preparation includes editing, coding, and data entry and is the activity that ensures the accuracy of the data and their conversion from raw form to reduced and classified forms that are more appropriate for analysis. Preparing a descriptive statistical summary is another preliminary step leading to an understanding of the collected data
  • 89. Data Preparation: Editing Coding Validation of data Data entry Classification Tabulation
  • 90. EDITING • The customary first step in analysis is to edit the raw data. Editing detects errors and omissions, corrects them when possible, and certifies that maximum data quality standards are achieved. The editor's purpose is to guarantee that data are: • 1. Accurate. • 2. Consistent with the intent of the question and other information in the survey. • 3. Uniformly entered. • 4. Complete. • 5. Arranged to simplify coding and tabulation
  • 91. Editing • Field Editing • Central Editing • In large projects, field editing review is a responsibility of the field supervisor. • It, should be done soon after the data have been gathered. During the stress of data collection in a personal interview and paper- and-pencil recording in an observation, the researcher often uses ad hoc abbreviations special symbols. • Soon after the interview, experiment, or observation, the investigator should review the reporting forms
  • 92. Central Editing • It should take place when all forms or schedules have been completed and returned to the office. • This type of editing implies that all forms should get a thorough editing by a single editor in a small study and by a team of editors in case of a large inquiry. • Editor(s) may correct the obvious errors such as an entry in the wrong place, entry recorded in months when it should have been recorded in weeks, and the like. In case of inappropriate on missing replies, the editor can sometimes determine the proper answer by reviewing the other information in the schedule. At times, the respondent can be contacted for clarification.
  • 93. Be familiar with instructions given to interviewers and coders. • Do not destroy, erase, or make illegible the original entry by the interviewer; • Original entries should remain legible. • Make all editing entries on an instrument in some distinctive color and in a standardized form. • Initial all answers changed or supplied. • Place initials and date of editing on each instrument completed.
  • 94.
  • 95.
  • 96.
  • 97. ERROR DETECTION • First step in error detection is to determine whether the software used for data entry and tabulation will allow the researcher to perform “error edit routines” which identifies the wrong type of data. • Example – Say that for a particular field on a given data record, only the codes of 1 or 2 should appear. An error edit routine can display an error message on the data output if any number other than 1 or 2 has been entered • Another approach to error detection is for the researcher to review a printed representation of entered data • The final approach to error detection is to produce a data/column list for the entered data. Quick view of this data/column list procedure can indicate to the analyst whether inappropriate codes were entered into data fields
  • 98. Data tabulation • INTRODUCTION • The classification of data leads to the problem of presentation of data. The presentation of data means exhibition of the data in such a clear and attractive manner that these are easily understood and analyzed. • There are many forms of presentation of data of which the following three are well known: • (i) Textual Presentation, • (ii) Tabular Presentation, • (iii) Diagrammatic Presentation. Here, we discuses in detail Tabular method of data presentation.
  • 99. What is a Table • A table is a symmetric arrangement of statistical data in rows and columns. • DEFINITIONS • “Table involves the orderly and systematic presentation of numerical data in a form designed to elucidate the problem under consideration.” ---According Prof. L.R.Connor,”
  • 100. Features of a good Table • Title as compatible with the objective of the study • To facilitate comparison. • Ideal Size • Stubs • Use of Zero • Heading • Abbreviation • Footnote • Total • Source of data • Size of Columns • Simple, Economical and Attractive
  • 101. Objectives of Tabulation • To carry out investigation • To do comparison • To locate omissions and errors in the data. • To use space economically • To simplify data • To use it as future reference
  • 102. Parts of a Table •Table number •Title of the table •Caption and stubs •Body •Prefatory or head note •Footnotes
  • 103.
  • 104. Types of Tables •There are three basis of classifying tables. •I. Purpose of a table •II. Originality of a table •III. Construction of a table
  • 105.
  • 106. I. According to Purpose • General Purpose Table: General purpose table is that table which is of general use. It is does not serve any specific purpose or specific problem under consideration. • Special Purpose Table: Special Purpose table is that table which is prepared with some specific purpose in mind.
  • 107. II. According to Originality • Original Table: An original table is that in which data are presented in the same form and way they are collected. • Derived Table: A derived table is that in which data are not presented in the form or way these are collected. Instead, the data are first converted into ratios or percentage and then presented.
  • 108. III. According to Construction •Simple Table •Complex Tables •a. Double or Two-Way Table •b. Three-Way Table •c. Manifold (or Higher Order) Table
  • 109. Simple Table • In a simple table (also known as one-way table), data are presented based on only one characteristic
  • 110. Complex Tables • In a complex table (also known as a manifold table) data are presented according to two or more characteristics simultaneously. The complex tables are two-way or three- way tables according to whether two or three characteristics are presented simultaneously. • a. Double or Two-Way Table • b. Three-Way Table • c. Manifold (or Higher Order) Table
  • 111. Double or Two-Way Table • In such a table, the variable under study is further subdivided into two groups according to two inter-related characteristics. The two-way table is shown in Table 1.2.
  • 112. Three-Way Table • In such a table, the variable under study is divided according to three interrelated characteristics. The Three- Way Table is shown in Table 1.3.
  • 113. Manifold (or Higher Order) Table • Such tables provide information about a large no of interrelated characteristics in the data set. Manifold (or Higher Order) Table is shown in Table 1.4. • CONCLUSION • With the help of above discussion we can say that table are help us to represent the data in the form of rows and columns and make it useful for the purposes.
  • 114.
  • 115. Reliability and validity test • Reliability (Cronbach’s Alpha) • Reliability refers to whether your data collection techniques and analytic procedures would reproduce consistent findings if they were repeated on another occasion or if they were replicated by another researcher. • Don't mix Positive and Negative question • LIKERT scale variables (only)
  • 116. Analysis using SPSS A Commonly accepted rule
  • 117. Reliability (Cronbach’s Alpha) – Interpretation Reliability and Scale Statistics S.No Benefits No. of items Cronbach’s Alpha 1 Monetary 5 Value from spss 2 Non Monetary 5 Value from spss The Cronbach’s Alpha Value of the monetary benefit is **** which is more than ***. Hence the reliability of the question is proved. The Cronbach’s Alpha Value of the non monetary benefit is *** which is more than the value of ***. Hence the reliability of the question is proved ie., the questionnaire is reliable for the purpose of data collection.
  • 118. Validity (Pearson Correlation) • Validity is about the accuracy of a measure • Validity is a judgement based on various type of evidence
  • 119.
  • 120. Go to SPSS • Transform – Compute Variable – m1 + m2+ m3 + m4+ m5 • Analyse – Corrolate – Bivariate (Move needed variable from left to right – m1, m2, m3, m4, m5, mtotal) – click ok • Mtotal values must be > 0.159 is acceptable – Valid • And also do for nm
  • 121. DATA ANALYSIS • Once the data have been collected and prepared for analysis, there are some basic statistical analysis procedures that researcher will want to perform • An obvious need for these statistics comes from the fact that almost all data sets are disaggregated • Graphics should be used whenever practical availing information user to quickly grasp the essence of the information developed in research project • Charts also can be an effective visual aid to enhance the communication process and add clarity and impact to research reports • i.e Bar Charts, • Line charts, • pie or round chart
  • 122. • Data must be accurately scored and systematically organized to facilitate data analysis vide • descriptive analysis, • univariate , • bivariate analysis and • multivariate analysis • Descriptive statistics : permit the researcher to describe many pieces of data with a few indices • Statistics : indices calculated by the researcher for a sample drawn from a population • Parameter : indices calculated by the researcher for an entire population • (Adults in bangalore city - % that are married, average age)
  • 123. Types of descriptive statistics • 1) Graphs • 2) Measures of Central Tendency • 3) Measures of central variability
  • 124. Graphs : • . Representations of data enabling the researcher to see what the distribution of scores look like Bar graph, line graph and Pie or Round chart
  • 125. Measure of Central Tendency • Indices enabling the researcher to determine the typical or average score of a group of scores. • They are : • a)Mean – • The arithmetic average of the sample • All values of a distribution of responses are summed and divided by the number of valid responses • b) Median – • The middle value of rank ordered distribution • Exactly half of the responses are above and half are below the median value • C) Mode – • The most common value in the set of responses to a question i.e the response most often given to a question
  • 126. Measure of Variability • Indices enabling the researcher to indicate how spread out a group of scores are They are : • a)Range • b) Variance • c)Standard Deviation
  • 127. a) Range – The difference between the highest and lowest score in a distribution b) Variance – A summary statistic indicating the degree of variability among participants for a given variable The average squared deviation about the mean of distribution of values c) Standard deviation – The square root of variance providing an index of variability in the distribution of scores. It describes the average distance of distribution values from the mean
  • 128. How to determine the sample size? • Sample Size is determined in two steps: • 1. Calculate the sample size for infinite populations. • S = Z2 * p * (1-p) /M2 • S = Sample Size for infinite population • Z = Z score • P = Population proportion (assumed to be 50% = 0.5) • M = margin of error • Z score is determined based on confidence level • Confidence level: The probability that the value of a parameter falls within a specified range of values Confidence Level Z- Value 90% 1.645 95% 1.960 99% 2.576
  • 129. • If we consider 95% confidence level then Z – score value is 1.96 • Margin of error is a small amount that is allowed for in case of miscalculation or change of circumstance • Generally we take margin of error as 5 % i.e m = 0.05 • Z – score = 1.96 • P = 0.5 • M = 0.05 • S = Z2*P*(1-p)/m2 • S = (1.96)2*0.5*(1-0.5)/(0.05)2 • S = 384.16 • So, sample size for the infinite population is ***
  • 130. • 2. Adjust the sample size to required Population. • For example, If we want to adjust the sample size to 1,00,000 population • Then use the following formula for adjusted sample size • Adjusted sample size = (S) /1 + ((S-1)/Population) • Adjusted S = 384.16/1+((384.16-1)/100000) • Adjusted S = 382.69 • Adjusted S = 382.69 =>383 • Finally, we have determined the sample size for 1,00,000 population as 383