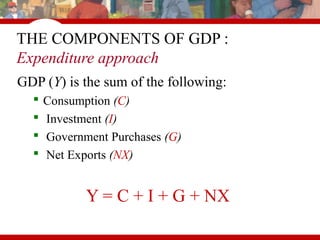
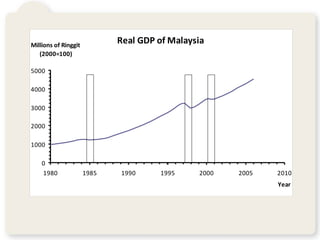
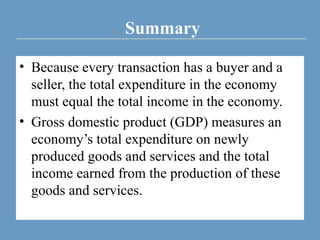
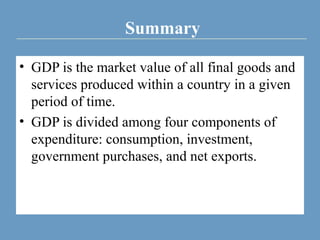
CHAPTE
R
6
Measuring a Nation’s Income
Microeconomics is the study of how individual
households and firms make decisions and how
they interact with one another in markets.
– Eg price of proton cars, demand for pizza and supply of rice …
Macroeconomics is the study of the economy as
a whole. Its goal is to explain the economic
changes that affect many households, firms,
and markets at once.
– Eg economic growth (real GDP growth), inflation and
unemployment …
Measuring a Nation’s Income
Macroeconomics answers questions like the
following:
 Why is average income high in some countries and
low in others?
 Why do prices rise rapidly in some time periods
while they are more stable in others?
 Why do production and employment expand in
some years and contract in others?
Nation’s Income
•Is the aggregate income of the country earned
by its nationals through the production of goods
and services for a certain period of time.
THE ECONOMY’S INCOME AND
EXPENDITURE
• When judging whether the economy is doing
well or poorly, it is natural to look at the total
income that everyone in the economy is
earning.
THE ECONOMY’S INCOME AND
EXPENDITURE
• For an economy as a whole, income must
equal expenditure because:
– Every transaction has a buyer and a seller.
– Every ringgit of spending by some buyer is a
ringgit of income for some seller.
Income = Expenditure
Figure 1 The Circular-Flow Diagram
Spending
Goods and
services
bought
Revenue
Goods
and services
sold
Labor, land,
and capital
Income
= Flow of inputs
and outputs
= Flow of dollars
Factors of
production
Wages, rent,
and profit
FIRMS
•Produce and sell
goods and services
•Hire and use factors
of production
•Buy and consume
goods and services
•Own and sell factors
of production
HOUSEHOLDS
•Households sell
•Firms buy
MARKETS
FOR
FACTORS OF PRODUCTION
•Firms sell
•Households buy
MARKETS
FOR
GOODS AND SERVICES
THE MEASUREMENT OF GROSS
DOMESTIC PRODUCT
• Gross domestic product (GDP) is a measure of
the income and expenditures of an economy.
• GDP is the total market value of all final goods
and services produced within a country in a
given period of time.
THE MEASUREMENT OF GROSS
DOMESTIC PRODUCT
• The equality of income and expenditure can be
illustrated with the circular-flow diagram.
THE MEASUREMENT OF GROSS
DOMESTIC PRODUCT
• “GDP is the Market Value . . .”
– Output is valued at market prices.
• “. . . Of All. . .”
– Includes all items produced in the economy and legally
sold in markets
• “. . . Final . . .”
– It records only the value of final goods, not intermediate
goods (the value is counted only once).
• “. . . Goods and Services . . .”
– It includes both tangible goods (food, clothing, cars) and
intangible services (haircuts, housecleaning, doctor visits).
THE MEASUREMENT OF GROSS
DOMESTIC PRODUCT
• “. . . Produced . . .”
– It includes goods and services currently produced, not
transactions involving goods produced in the past.
• “ . . . Within a Country . . .”
– It measures the value of production within the geographic
confines of a country.
• “. . . In a Given Period of Time.”
– It measures the value of production that takes place within
a specific interval of time, usually a year or a quarter (three
months).
THE COMPONENTS OF GDP
• GDP includes all items produced in the
economy and sold legally in markets.
• What Is Not Counted in GDP?
– GDP excludes most items that are produced and
consumed at home and that never enter the
marketplace.
– It excludes items produced and sold illicitly, such
as illegal drugs.
THE COMPONENTS OF GDP :
Expenditure approach
GDP (Y) is the sum of the following:
 Consumption (C)
 Investment (I)
 Government Purchases (G)
 Net Exports (NX)
Y = C + I + G + NX
• Consumption (C):
• The spending by households on goods and
services, with the exception of purchases of new
housing.
• Investment (I):
• The spending on capital equipment, inventories,
and structures, including new housing.
THE COMPONENTS OF GDP :
Expenditure approach
• Government Purchases (G):
– The spending on goods and services by state and
federal governments.
– Does not include transfer payments because they
are not made in exchange for currently produced
goods or services.
• Net Exports (NX):
– Exports minus imports.
THE COMPONENTS OF GDP :
Expenditure approach
• http://www.epu.gov.my/documents/10124/225
7e64f-b08d-41b7-bed0-b6e6498c38a3
Malaysia’s GDP and Its Components (2007)
Consumption, C Investment, I
Government purchases, G Net exports, NX
REAL VERSUS NOMINAL GDP
• Nominal GDP values the production of goods
and services at current prices.
• Real GDP values the production of goods and
services at constant prices.
REAL VERSUS NOMINAL GDP
• An accurate view of the economy requires
adjusting nominal to real GDP by using the
GDP deflator.
Table 2 Real and Nominal GDP
Prices and Quantities
Year Price of Quantity of Price of Quantity of
Fish balls Fish balls Chicken sausages Chicken sausages
2006 20 sen 100 50 sen 40
2007 40 sen 150 75 sen 80
2008 60 sen 200 RM1 120
Table 2 Real and Nominal GDP
Calculating Nominal GDP
2006 (20 sen per fish ball x 100 fish balls) + 50 sen per sausage x 40 sausages) = RM40
2007 (40 sen per fish ball x 150 fish balls) + 75 sen per sausage x 80 sausages) = RM120
2008 (60 sen per fish ball x 200 fish balls) + RM1 per sausage x 120 sausages) = RM240
Table 2 Real and Nominal GDP
Calculating Real GDP (base year 2006)
2006 (20 sen per fish ball x 100 fish balls) + 50 sen per sausage x 40 sausages) = RM40
2007 (20 sen per fish ball x 150 fish balls) + 50 sen per sausage x 80 sausages) = RM70
2008 (20 sen per fish ball x 200 fish balls) + 50 sen per sausage x 120 sausages) = RM100
The GDP Deflator
• The GDP deflator is a measure of the price
level calculated as the ratio of nominal GDP to
real GDP times 100.
• It tells us what portion of the rise in nominal
GDP that is attributable to a rise in prices rather
than a rise in the quantities produced.
The GDP Deflator
• The GDP deflator is calculated as follows:
G D P d e f l a t o r =
N o m i n a l G D P
R e a l G D P
× 1 0 0
The GDP Deflator
• Nominal GDP is converted to real GDP as
follows:
R e a l G D P
N o m i n a l G D P
G D P d e f l a t o r
2 0 X X
2 0 X X
2 0 X X
= × 1 0 0
Table 2 Real and Nominal GDP
Calculating the GDP deflator
2006 (RM40 / RM40) x 100 = 100
2007 (RM120/RM70) x 100 = 171
2008 (RM240/RM100) x 100 = 240
Real GDP of Malaysia
0
1000
2000
3000
4000
5000
1980 1985 1990 1995 2000 2005 2010
Year
Millions of Ringgit
(2000=100)
IS GDP A GOOD MEASURE OF
ECONOMIC WELL-BEING?
• GDP is the best single measure of the
economic well-being of a society.
• GDP per person tells us the income and
expenditure of the average person in the
economy.
• Higher GDP per person indicates a higher
standard of living.
• GDP is not a perfect measure of the happiness
or quality of life, however.
GDP AND ECONOMIC
WELL-BEING
• Some things that contribute to well-being are
not included in GDP.
– The value of leisure.
– The value of a clean environment.
– The value of almost all activity that takes place
outside of markets, such as the value of the time
parents spend with their children and the value of
volunteer work.
GDP per capita Life Expectancy Adult Literay Internet users
(PPP US$) (years) (% of ages 15 and above) (per 1,000 people)
Country 2005 2005 1995 - 2005 2005
United States 41,890 77.9 99.0% 630
United Kingdom 33,238 79.0 99.0 473
Japan 31,267 82.3 99.0 668
Singapore 29,663 79.4 92.5 571
Germany 29,461 79.1 99.0 455
Malaysia 10,887 73.7 88.7 435
China 6,757 72.5 90.9 85
Indonesia 3,843 69.7 90.4 73
India 3,452 63.7 61.0 55
Vietnam 3,071 73.7 90.3 129
Nigeria 1,128 46.5 69.1 38
Sierra Leone 806 41.8 34.8 2
Source : Human Development Report 2007/2008, United Nations.
Institutional Structures of Growth
–Strong property rights
–Patents and copyrights
–Efficient financial institutions
–Literacy and widespread education
–Free trade
–Competitive market system
LO3
Determinants of Growth
• Supply factors
–Increases in quantity and quality
of natural resources
–Increases in quality and quantity
of human resources
–Increases in the supply (or stock)
of capital goods
–Improvements in technology
LO3
Determinants of Growth
• Demand factor
–Households, businesses, and
government must purchase the
economy’s expanding output
• Efficiency factor
–Must achieve economic efficiency
and full employment
LO3
Summary
• Because every transaction has a buyer and a
seller, the total expenditure in the economy
must equal the total income in the economy.
• Gross domestic product (GDP) measures an
economy’s total expenditure on newly
produced goods and services and the total
income earned from the production of these
goods and services.
Summary
• GDP is the market value of all final goods and
services produced within a country in a given
period of time.
• GDP is divided among four components of
expenditure: consumption, investment,
government purchases, and net exports.
Summary
• Nominal GDP uses current prices to value the
economy’s production. Real GDP uses
constant base-year prices to value the
economy’s production of goods and services.
• The GDP deflator—calculated from the ratio
of nominal to real GDP—measures the level of
prices in the economy.
Summary
• GDP is a good measure of economic well-
being because people prefer higher to lower
incomes.
• It is not a perfect measure of well-being
because some things, such as leisure time and
a clean environment, are not measured by
GDP.

Chapter 6 national income

  • 1.
  • 2.
    Measuring a Nation’sIncome Microeconomics is the study of how individual households and firms make decisions and how they interact with one another in markets. – Eg price of proton cars, demand for pizza and supply of rice … Macroeconomics is the study of the economy as a whole. Its goal is to explain the economic changes that affect many households, firms, and markets at once. – Eg economic growth (real GDP growth), inflation and unemployment …
  • 3.
    Measuring a Nation’sIncome Macroeconomics answers questions like the following:  Why is average income high in some countries and low in others?  Why do prices rise rapidly in some time periods while they are more stable in others?  Why do production and employment expand in some years and contract in others?
  • 4.
    Nation’s Income •Is theaggregate income of the country earned by its nationals through the production of goods and services for a certain period of time.
  • 5.
    THE ECONOMY’S INCOMEAND EXPENDITURE • When judging whether the economy is doing well or poorly, it is natural to look at the total income that everyone in the economy is earning.
  • 6.
    THE ECONOMY’S INCOMEAND EXPENDITURE • For an economy as a whole, income must equal expenditure because: – Every transaction has a buyer and a seller. – Every ringgit of spending by some buyer is a ringgit of income for some seller. Income = Expenditure
  • 7.
    Figure 1 TheCircular-Flow Diagram Spending Goods and services bought Revenue Goods and services sold Labor, land, and capital Income = Flow of inputs and outputs = Flow of dollars Factors of production Wages, rent, and profit FIRMS •Produce and sell goods and services •Hire and use factors of production •Buy and consume goods and services •Own and sell factors of production HOUSEHOLDS •Households sell •Firms buy MARKETS FOR FACTORS OF PRODUCTION •Firms sell •Households buy MARKETS FOR GOODS AND SERVICES
  • 8.
    THE MEASUREMENT OFGROSS DOMESTIC PRODUCT • Gross domestic product (GDP) is a measure of the income and expenditures of an economy. • GDP is the total market value of all final goods and services produced within a country in a given period of time.
  • 9.
    THE MEASUREMENT OFGROSS DOMESTIC PRODUCT • The equality of income and expenditure can be illustrated with the circular-flow diagram.
  • 10.
    THE MEASUREMENT OFGROSS DOMESTIC PRODUCT • “GDP is the Market Value . . .” – Output is valued at market prices. • “. . . Of All. . .” – Includes all items produced in the economy and legally sold in markets • “. . . Final . . .” – It records only the value of final goods, not intermediate goods (the value is counted only once). • “. . . Goods and Services . . .” – It includes both tangible goods (food, clothing, cars) and intangible services (haircuts, housecleaning, doctor visits).
  • 11.
    THE MEASUREMENT OFGROSS DOMESTIC PRODUCT • “. . . Produced . . .” – It includes goods and services currently produced, not transactions involving goods produced in the past. • “ . . . Within a Country . . .” – It measures the value of production within the geographic confines of a country. • “. . . In a Given Period of Time.” – It measures the value of production that takes place within a specific interval of time, usually a year or a quarter (three months).
  • 12.
    THE COMPONENTS OFGDP • GDP includes all items produced in the economy and sold legally in markets. • What Is Not Counted in GDP? – GDP excludes most items that are produced and consumed at home and that never enter the marketplace. – It excludes items produced and sold illicitly, such as illegal drugs.
  • 13.
    THE COMPONENTS OFGDP : Expenditure approach GDP (Y) is the sum of the following:  Consumption (C)  Investment (I)  Government Purchases (G)  Net Exports (NX) Y = C + I + G + NX
  • 14.
    • Consumption (C): •The spending by households on goods and services, with the exception of purchases of new housing. • Investment (I): • The spending on capital equipment, inventories, and structures, including new housing. THE COMPONENTS OF GDP : Expenditure approach
  • 15.
    • Government Purchases(G): – The spending on goods and services by state and federal governments. – Does not include transfer payments because they are not made in exchange for currently produced goods or services. • Net Exports (NX): – Exports minus imports. THE COMPONENTS OF GDP : Expenditure approach
  • 16.
  • 17.
    Malaysia’s GDP andIts Components (2007) Consumption, C Investment, I Government purchases, G Net exports, NX
  • 18.
    REAL VERSUS NOMINALGDP • Nominal GDP values the production of goods and services at current prices. • Real GDP values the production of goods and services at constant prices.
  • 19.
    REAL VERSUS NOMINALGDP • An accurate view of the economy requires adjusting nominal to real GDP by using the GDP deflator.
  • 20.
    Table 2 Realand Nominal GDP Prices and Quantities Year Price of Quantity of Price of Quantity of Fish balls Fish balls Chicken sausages Chicken sausages 2006 20 sen 100 50 sen 40 2007 40 sen 150 75 sen 80 2008 60 sen 200 RM1 120
  • 21.
    Table 2 Realand Nominal GDP Calculating Nominal GDP 2006 (20 sen per fish ball x 100 fish balls) + 50 sen per sausage x 40 sausages) = RM40 2007 (40 sen per fish ball x 150 fish balls) + 75 sen per sausage x 80 sausages) = RM120 2008 (60 sen per fish ball x 200 fish balls) + RM1 per sausage x 120 sausages) = RM240
  • 22.
    Table 2 Realand Nominal GDP Calculating Real GDP (base year 2006) 2006 (20 sen per fish ball x 100 fish balls) + 50 sen per sausage x 40 sausages) = RM40 2007 (20 sen per fish ball x 150 fish balls) + 50 sen per sausage x 80 sausages) = RM70 2008 (20 sen per fish ball x 200 fish balls) + 50 sen per sausage x 120 sausages) = RM100
  • 23.
    The GDP Deflator •The GDP deflator is a measure of the price level calculated as the ratio of nominal GDP to real GDP times 100. • It tells us what portion of the rise in nominal GDP that is attributable to a rise in prices rather than a rise in the quantities produced.
  • 24.
    The GDP Deflator •The GDP deflator is calculated as follows: G D P d e f l a t o r = N o m i n a l G D P R e a l G D P × 1 0 0
  • 25.
    The GDP Deflator •Nominal GDP is converted to real GDP as follows: R e a l G D P N o m i n a l G D P G D P d e f l a t o r 2 0 X X 2 0 X X 2 0 X X = × 1 0 0
  • 26.
    Table 2 Realand Nominal GDP Calculating the GDP deflator 2006 (RM40 / RM40) x 100 = 100 2007 (RM120/RM70) x 100 = 171 2008 (RM240/RM100) x 100 = 240
  • 27.
    Real GDP ofMalaysia 0 1000 2000 3000 4000 5000 1980 1985 1990 1995 2000 2005 2010 Year Millions of Ringgit (2000=100)
  • 28.
    IS GDP AGOOD MEASURE OF ECONOMIC WELL-BEING? • GDP is the best single measure of the economic well-being of a society. • GDP per person tells us the income and expenditure of the average person in the economy. • Higher GDP per person indicates a higher standard of living. • GDP is not a perfect measure of the happiness or quality of life, however.
  • 29.
    GDP AND ECONOMIC WELL-BEING •Some things that contribute to well-being are not included in GDP. – The value of leisure. – The value of a clean environment. – The value of almost all activity that takes place outside of markets, such as the value of the time parents spend with their children and the value of volunteer work.
  • 30.
    GDP per capitaLife Expectancy Adult Literay Internet users (PPP US$) (years) (% of ages 15 and above) (per 1,000 people) Country 2005 2005 1995 - 2005 2005 United States 41,890 77.9 99.0% 630 United Kingdom 33,238 79.0 99.0 473 Japan 31,267 82.3 99.0 668 Singapore 29,663 79.4 92.5 571 Germany 29,461 79.1 99.0 455 Malaysia 10,887 73.7 88.7 435 China 6,757 72.5 90.9 85 Indonesia 3,843 69.7 90.4 73 India 3,452 63.7 61.0 55 Vietnam 3,071 73.7 90.3 129 Nigeria 1,128 46.5 69.1 38 Sierra Leone 806 41.8 34.8 2 Source : Human Development Report 2007/2008, United Nations.
  • 31.
    Institutional Structures ofGrowth –Strong property rights –Patents and copyrights –Efficient financial institutions –Literacy and widespread education –Free trade –Competitive market system LO3
  • 32.
    Determinants of Growth •Supply factors –Increases in quantity and quality of natural resources –Increases in quality and quantity of human resources –Increases in the supply (or stock) of capital goods –Improvements in technology LO3
  • 33.
    Determinants of Growth •Demand factor –Households, businesses, and government must purchase the economy’s expanding output • Efficiency factor –Must achieve economic efficiency and full employment LO3
  • 34.
    Summary • Because everytransaction has a buyer and a seller, the total expenditure in the economy must equal the total income in the economy. • Gross domestic product (GDP) measures an economy’s total expenditure on newly produced goods and services and the total income earned from the production of these goods and services.
  • 35.
    Summary • GDP isthe market value of all final goods and services produced within a country in a given period of time. • GDP is divided among four components of expenditure: consumption, investment, government purchases, and net exports.
  • 36.
    Summary • Nominal GDPuses current prices to value the economy’s production. Real GDP uses constant base-year prices to value the economy’s production of goods and services. • The GDP deflator—calculated from the ratio of nominal to real GDP—measures the level of prices in the economy.
  • 37.
    Summary • GDP isa good measure of economic well- being because people prefer higher to lower incomes. • It is not a perfect measure of well-being because some things, such as leisure time and a clean environment, are not measured by GDP.

Editor's Notes

  • #32 There are several institutional structures that promote and sustain modern economic growth. Strong property rights are absolutely essential as people will not invest if they believe their investments are not safe from theft or an unscrupulous government. Patent and copyright laws are also necessary if a society wants a constant flow of innovative new technologies and sophisticated new ideas. Efficient financial institutions, literacy and education, free trade, and a competitive market system are other key factors in ensuring a nation’s ability to sustain growth.
  • #33 Four of the determinants of growth relate to the physical ability of the economy to expand. These supply factors or changes in the physical and technical agents of production enable an economy to expand its potential GDP.
  • #34 The fifth determinant of economic growth is the demand factor. To achieve the higher production potential created by the supply factors, households, businesses, and government must purchase the economy’s expanding output. The sixth factor, efficiency, involves the issue that the economy must achieve economic efficiency as well as full employment. It must use its resources in the least costly way to provide the specific mix of goods and services that maximizes people’s well-being.