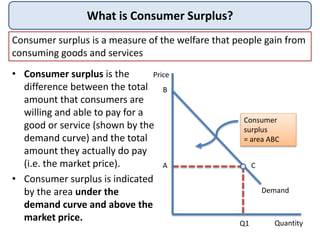
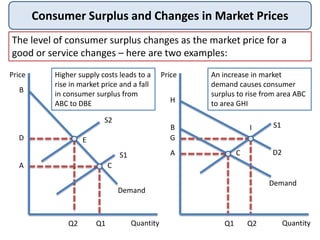
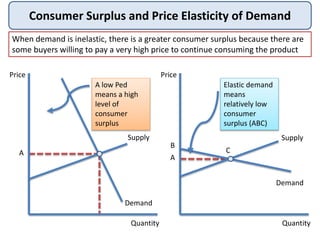
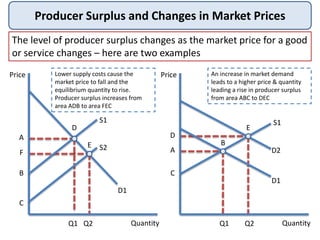
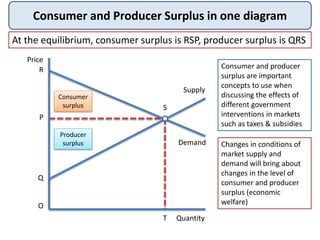
Consumer surplus is the difference between what consumers are willing to pay for a good and what they actually pay, represented by the area under the demand curve and above the market price. Producer surplus is the difference between the price producers are willing to supply a good for and the price they actually receive, shown by the area above the supply curve and below the market price. Changes in supply and demand impact both consumer surplus and producer surplus - a price increase decreases consumer surplus while increasing producer surplus. Both concepts are important when analyzing the effects of government interventions in markets.