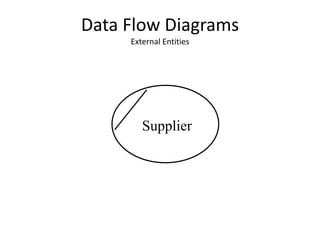
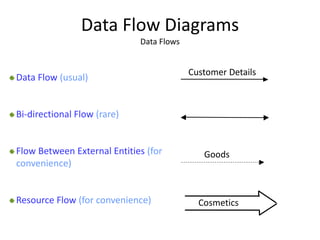
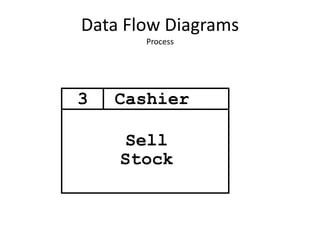
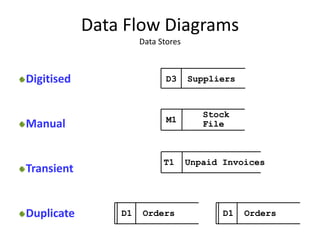
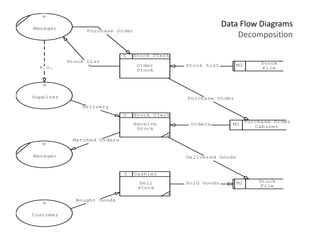
CHAPTER 5
System modelling
System modelling
• System modelling helps the analyst to understand the
functionality of the system and models are used to
communicate with customers.
• System models are abstract descriptions of systems whose
requirements are being analysed
• Models are created to visually represent the proposed
database so that business requirements can easily be
associated with database objects to ensure that all
requirements can easily be associated with database objects
to ensure that all requirements have been completely and
accurately gathered.
Cont….
• Different types of diagrams are typically
produced to illustrate the business processes,
rules, entities, and organizational units that
have been identified.
• These diagrams often include entity
relationship diagrams and process flow
diagrams
Cont….
• An entity relationship diagram (ERD)
represents the entities, or groups of
information, and their relationships
maintained for a business.
• Process flow diagrams represent business
processes and the flow of data between
different processes and entities that have
been defined.
Cont….
• Basically, data modeling serves as a link
between business needs and system
requirements.
• Two types of data modeling are as follows:
i. Logical modeling
ii. Physical modeling
Logical modeling
• Logical modeling involves gathering
information about business processes,
business entities (categories of data), and
organizational units.
• After this information is gathered, diagrams
and reports are produced including entity
relationship diagrams, business process
diagrams, and eventually process flow
diagrams.
Cont….
• The diagrams produced should show the
processes and data that exists, as well as the
relationships between business processes and
data.
• The diagrams and documentation generated
during logical modeling is used to determine
whether the requirements of the business
have been completely gathered.
Cont….
• Typical deliverables of logical modeling
include:
• Entity relationship diagrams – An Entity
Relationship Diagram provide a picture of the
different categories of data for the business,
as well as how these categories of data are
related to one another.
Cont….
• Business process diagrams – The process
model illustrates all the parent and child
processes that are performed by individuals
within a company.
• The process model gives the development
team an idea of how data moves within the
organization.
• The process model can be used to determine
how a database application interface is design.
Physical Modeling
• Physical modeling involves the actual design of a
database according to the requirements that
were established during logical modeling.
• During physical modeling, objects such as tables
and columns are created based on entities and
attributes that were defined during logical
modeling.
• Physical modeling is when all the pieces come
together to complete the process of defining a
database for a business.
Cont….
• Typical deliverables of physical modeling
include the following:
• User feedback documentation
• Database design documentation
Modelling a system’s processes
• Data Flow Modelling is a widely used and
mature analysis technique, and is
recommended by most structured methods.
• The technique of Data Flow Modelling is used
to progress the analysis of the system’s
processes by providing a more detailed model
of all the system’s data processes.
DFD Notation
• The DFD is a diagram that consists principally
of four symbols, namely the external entity,
the data flow, the process and the data store
Data Flow Diagrams
External Entities
Supplier
Data Flow Diagrams
Data Flows
Cosmetics
Goods
Customer Details
Data Flow (usual)
Bi-directional Flow (rare)
Flow Between External Entities (for
convenience)
Resource Flow (for convenience)
Data Flow Diagrams
Process
Sell
Stock
Cashier3
Data Flow Diagrams
Data Stores
D3 Suppliers
Stock
FileM1
T1 Unpaid Invoices
D1 Orders D1 Orders
Digitised
Manual
Transient
Duplicate
Data Flow Diagrams
Decomposition
Order
Stock
Manager
e
Supplier
d
Purchase Order
Cabinet
M1
Stock
File
M2
*
Receive
Stock
2 Stock Clerk
Manager
e
*
Sell
Stock
3 Cashier
Customer
a
M2
Purchase Order
Stock List
P.O.
Matched Orders
Orders
Purchase Order
Delivery
Bought Goods
Stock List
Sold Goods
Delivered Goods
1 Stock Clerk
Stock
File
• A closer look at process 1 of the Small Stock System
also shows that it is logically consistent and does
indeed describe the activity of ordering stock
• On the other hand, it does not contain enough detail
to understand exactly what happens when stock is
ordered
• The DFD deals with these issues by allowing more
detailed views of the high level processes
• This is done by breaking up each process into as
many sub-processes as deemed necessary
Data Flow Diagrams
Decomposing Data Flow Diagrams
• Any process on a DFD may be broken up into several
sub-processes which, when viewed collectively,
make up that process
• Thus for example we may break-up process 1 of the
Small Stock System into that shown on the next
slide:
Data Flow Diagrams
Decomposing Data Flow Diagrams
1 Order Stock
Purchase Order
Cabinet
M1
Manager
e
Stock
File
M2
*
Produce
Stock
List
1.1
*
Record
Purchase
Order
1.2
Stock List
Purchase Order
Purchase Order
Stock List
Data Flow Diagrams
Decomposing Data Flow Diagrams
• A process that is decomposed is known as a ‘parent’
whose ‘children’ are the diagrams derived from it
• Any process that does not contain any further
decomposition ( i.e. has no children) is known as a
‘bottom level’ or ‘elementary’ process
• These elementary processes constitute the building
blocks of the system and as such need to be
considered carefully
Data Flow Diagrams
Decomposing Data Flow Diagrams
Manager
e
Supplier
d
Customer
a
Bought Goods
Purchase Order
P.O.
Stock List
Small
Stock
System
Delivery
Matched Orders
Data Flow Diagrams
Context Diagrams
• A level higher
than level 1,
showing the
whole system
as a single
process with
external
entities around
it, is also
possible:
Data Flow Diagrams
Starting from the Context Diagram
• To develop a Context Diagram we carry out the
following tasks:
(i) Identify all sources and recipients of data from the
system, i.e. external entities
(ii) Identify the major data flows to and from the external
entities
(iii)Convert each source or recipient into an external entity
symbol
(iv)Add the data flows between each external entity and a
single box representing the entire system
END

SYSTEM MODELLING

  • 1.
  • 2.
    System modelling • Systemmodelling helps the analyst to understand the functionality of the system and models are used to communicate with customers. • System models are abstract descriptions of systems whose requirements are being analysed • Models are created to visually represent the proposed database so that business requirements can easily be associated with database objects to ensure that all requirements can easily be associated with database objects to ensure that all requirements have been completely and accurately gathered.
  • 3.
    Cont…. • Different typesof diagrams are typically produced to illustrate the business processes, rules, entities, and organizational units that have been identified. • These diagrams often include entity relationship diagrams and process flow diagrams
  • 4.
    Cont…. • An entityrelationship diagram (ERD) represents the entities, or groups of information, and their relationships maintained for a business. • Process flow diagrams represent business processes and the flow of data between different processes and entities that have been defined.
  • 5.
    Cont…. • Basically, datamodeling serves as a link between business needs and system requirements. • Two types of data modeling are as follows: i. Logical modeling ii. Physical modeling
  • 6.
    Logical modeling • Logicalmodeling involves gathering information about business processes, business entities (categories of data), and organizational units. • After this information is gathered, diagrams and reports are produced including entity relationship diagrams, business process diagrams, and eventually process flow diagrams.
  • 7.
    Cont…. • The diagramsproduced should show the processes and data that exists, as well as the relationships between business processes and data. • The diagrams and documentation generated during logical modeling is used to determine whether the requirements of the business have been completely gathered.
  • 8.
    Cont…. • Typical deliverablesof logical modeling include: • Entity relationship diagrams – An Entity Relationship Diagram provide a picture of the different categories of data for the business, as well as how these categories of data are related to one another.
  • 9.
    Cont…. • Business processdiagrams – The process model illustrates all the parent and child processes that are performed by individuals within a company. • The process model gives the development team an idea of how data moves within the organization. • The process model can be used to determine how a database application interface is design.
  • 10.
    Physical Modeling • Physicalmodeling involves the actual design of a database according to the requirements that were established during logical modeling. • During physical modeling, objects such as tables and columns are created based on entities and attributes that were defined during logical modeling. • Physical modeling is when all the pieces come together to complete the process of defining a database for a business.
  • 11.
    Cont…. • Typical deliverablesof physical modeling include the following: • User feedback documentation • Database design documentation
  • 12.
    Modelling a system’sprocesses • Data Flow Modelling is a widely used and mature analysis technique, and is recommended by most structured methods. • The technique of Data Flow Modelling is used to progress the analysis of the system’s processes by providing a more detailed model of all the system’s data processes.
  • 13.
    DFD Notation • TheDFD is a diagram that consists principally of four symbols, namely the external entity, the data flow, the process and the data store
  • 14.
    Data Flow Diagrams ExternalEntities Supplier
  • 15.
    Data Flow Diagrams DataFlows Cosmetics Goods Customer Details Data Flow (usual) Bi-directional Flow (rare) Flow Between External Entities (for convenience) Resource Flow (for convenience)
  • 16.
  • 17.
    Data Flow Diagrams DataStores D3 Suppliers Stock FileM1 T1 Unpaid Invoices D1 Orders D1 Orders Digitised Manual Transient Duplicate
  • 18.
    Data Flow Diagrams Decomposition Order Stock Manager e Supplier d PurchaseOrder Cabinet M1 Stock File M2 * Receive Stock 2 Stock Clerk Manager e * Sell Stock 3 Cashier Customer a M2 Purchase Order Stock List P.O. Matched Orders Orders Purchase Order Delivery Bought Goods Stock List Sold Goods Delivered Goods 1 Stock Clerk Stock File
  • 19.
    • A closerlook at process 1 of the Small Stock System also shows that it is logically consistent and does indeed describe the activity of ordering stock • On the other hand, it does not contain enough detail to understand exactly what happens when stock is ordered • The DFD deals with these issues by allowing more detailed views of the high level processes • This is done by breaking up each process into as many sub-processes as deemed necessary Data Flow Diagrams Decomposing Data Flow Diagrams
  • 20.
    • Any processon a DFD may be broken up into several sub-processes which, when viewed collectively, make up that process • Thus for example we may break-up process 1 of the Small Stock System into that shown on the next slide: Data Flow Diagrams Decomposing Data Flow Diagrams
  • 21.
    1 Order Stock PurchaseOrder Cabinet M1 Manager e Stock File M2 * Produce Stock List 1.1 * Record Purchase Order 1.2 Stock List Purchase Order Purchase Order Stock List Data Flow Diagrams Decomposing Data Flow Diagrams
  • 22.
    • A processthat is decomposed is known as a ‘parent’ whose ‘children’ are the diagrams derived from it • Any process that does not contain any further decomposition ( i.e. has no children) is known as a ‘bottom level’ or ‘elementary’ process • These elementary processes constitute the building blocks of the system and as such need to be considered carefully Data Flow Diagrams Decomposing Data Flow Diagrams
  • 23.
    Manager e Supplier d Customer a Bought Goods Purchase Order P.O. StockList Small Stock System Delivery Matched Orders Data Flow Diagrams Context Diagrams • A level higher than level 1, showing the whole system as a single process with external entities around it, is also possible:
  • 24.
    Data Flow Diagrams Startingfrom the Context Diagram • To develop a Context Diagram we carry out the following tasks: (i) Identify all sources and recipients of data from the system, i.e. external entities (ii) Identify the major data flows to and from the external entities (iii)Convert each source or recipient into an external entity symbol (iv)Add the data flows between each external entity and a single box representing the entire system
  • 25.