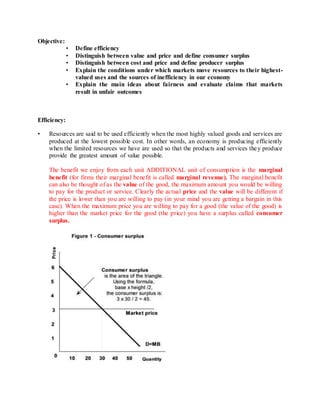
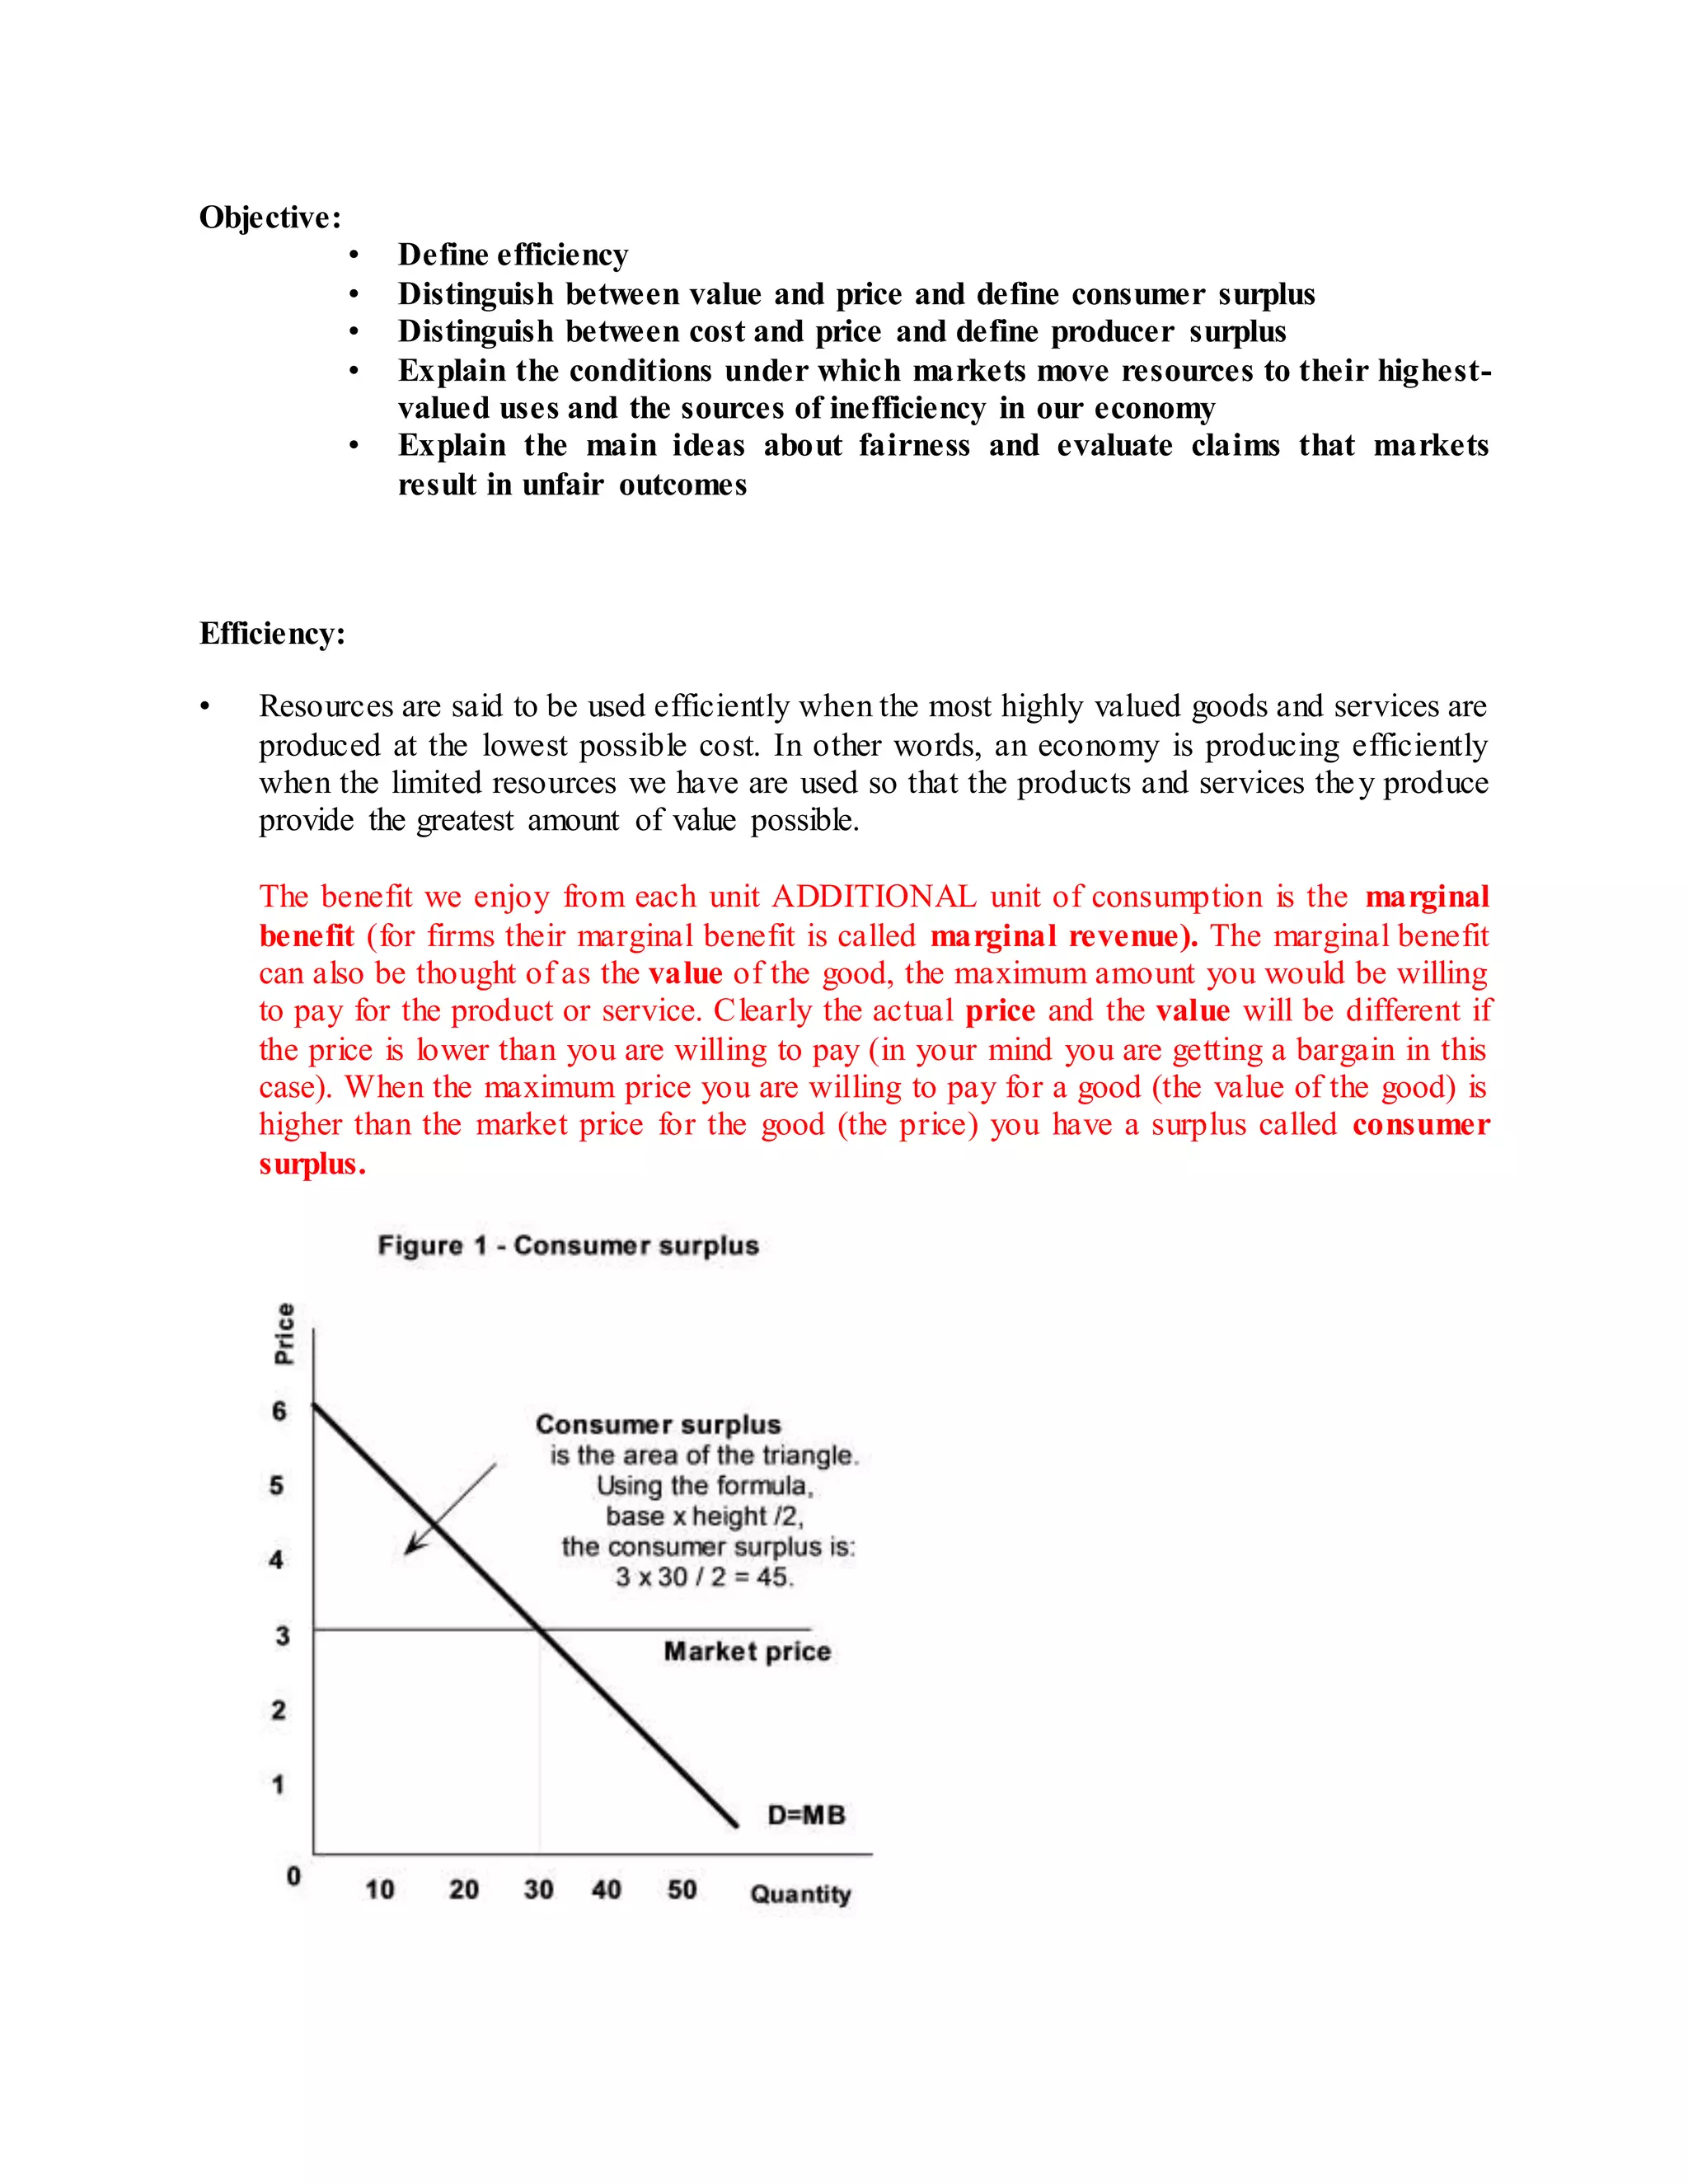
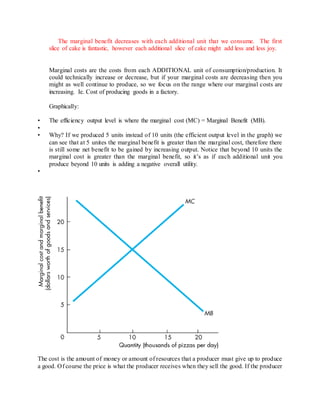
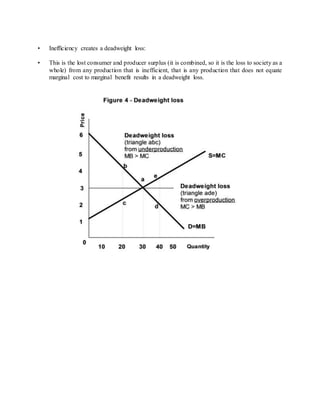
Objective: 
• Define efficiency 
• Distinguish between value and price and define consumer surplus 
• Distinguish between cost and price and define producer surplus 
• Explain the conditions under which markets move resources to their highest-valued 
uses and the sources of inefficiency in our economy 
• Explain the main ideas about fairness and evaluate claims that markets 
result in unfair outcomes 
Efficiency: 
• Resources are said to be used efficiently when the most highly valued goods and services are 
produced at the lowest possible cost. In other words, an economy is producing efficiently 
when the limited resources we have are used so that the products and services the y produce 
provide the greatest amount of value possible. 
The benefit we enjoy from each unit ADDITIONAL unit of consumption is the marginal 
benefit (for firms their marginal benefit is called marginal revenue). The marginal benefit 
can also be thought of as the value of the good, the maximum amount you would be willing 
to pay for the product or service. Clearly the actual price and the value will be different if 
the price is lower than you are willing to pay (in your mind you are getting a bargain in this 
case). When the maximum price you are willing to pay for a good (the value of the good) is 
higher than the market price for the good (the price) you have a surplus called consumer 
surplus.
The marginal benefit decreases with each additional unit that we consume. The first 
slice of cake is fantastic, however each additional slice of cake might add less and less joy. 
Marginal costs are the costs from each ADDITIONAL unit of consumption/production. It 
could technically increase or decrease, but if your marginal costs are decreasing then you 
might as well continue to produce, so we focus on the range where our marginal costs are 
increasing. Ie. Cost of producing goods in a factory. 
Graphically: 
• The efficiency output level is where the marginal cost (MC) = Marginal Benefit (MB). 
• 
• Why? If we produced 5 units instead of 10 units (the efficient output level in the graph) we 
can see that at 5 unites the marginal benefit is greater than the marginal cost, therefore there 
is still some net benefit to be gained by increasing output. Notice that beyond 10 units the 
marginal cost is greater than the marginal benefit, so it’s as if each additional unit you 
produce beyond 10 units is adding a negative overall utility. 
• 
The cost is the amount of money or amount of resources that a producer must give up to produce 
a good. Of course the price is what the producer receives when they sell the good. If the producer
sells their goods or services for a price higher than their costs, then they make a surplus, this 
surplus is called producer surplus. 
Since the cost curve graphs amount/quantity producers are willing to supply at each price level, 
the supply curve and the marginal cost curve are the same. Why? Because the marginal cost 
curve shows the minimum cost for each quantity level and the producer would be willing to 
supply quantity that in a worst case, results in their costs being equal to the price they receive. 
Therefore, if the market price for a good is $3 then producers would be willing to supply a 
quantity where their marginal cost is also $3. Therefore, the marginal cost curve is the same as 
the supply curve.
Markets may not always be efficient: 
5 Obstacles to efficiency: 
• Price ceilings (maximum price) and price floors (minimum price) – government 
regulations that set a maximum price or a minimum price for goods or services. 
• Taxes, subsidies and quotas. Taxes increase prices paid by consumers and decrease 
revenues received by businesses. Subsidies increase the revenue/funds businesses 
receive (thus encouraging greater production). And quotas directly impose some 
production amount, and this production quantity may or may not be efficient. 
• Monopoly: A monopoly is a firm that is the only firm in a market. Monopolies usually 
decrease production below the efficient level so that they can charge a higher price. 
• Public goods: A public good is a good that can be consumed by all people who are part 
of a community whether paid for or not. Examples: fresh air and parks. This can mean 
the marginal costs to using the public good is so low that people overconsume the good 
because they don’t take into account the cost to the community as a whole when making 
their individual decisions. 
• Externalities – external costs or benefits that not directly included in cost revenue 
calculations. Pollution can be an external cost that might mean companies produce 
higher quantities than they would produce if they had to pay to reverse these 
environmental costs/externalities. A positive externality might greater profits for a local 
mall after a bunch of houses are built in an area. Property developers will not take the 
profits of the retailers in the mall into account when making their building decision s. 
This can mean property developers should produce more homes because the marginal 
benefit to all entities affected is higher, hence we may underproduce property, thus 
being inefficient.
• Inefficiency creates a deadweight loss: 
• This is the lost consumer and producer surplus (it is combined, so it is the loss to society as a 
whole) from any production that is inefficient, that is any production that does not equate 
marginal cost to marginal benefit results in a deadweight loss.

Chapter 2 efficiency, externalities, consumer surplus, producer surplus etc

  • 1.
    Objective: • Defineefficiency • Distinguish between value and price and define consumer surplus • Distinguish between cost and price and define producer surplus • Explain the conditions under which markets move resources to their highest-valued uses and the sources of inefficiency in our economy • Explain the main ideas about fairness and evaluate claims that markets result in unfair outcomes Efficiency: • Resources are said to be used efficiently when the most highly valued goods and services are produced at the lowest possible cost. In other words, an economy is producing efficiently when the limited resources we have are used so that the products and services the y produce provide the greatest amount of value possible. The benefit we enjoy from each unit ADDITIONAL unit of consumption is the marginal benefit (for firms their marginal benefit is called marginal revenue). The marginal benefit can also be thought of as the value of the good, the maximum amount you would be willing to pay for the product or service. Clearly the actual price and the value will be different if the price is lower than you are willing to pay (in your mind you are getting a bargain in this case). When the maximum price you are willing to pay for a good (the value of the good) is higher than the market price for the good (the price) you have a surplus called consumer surplus.
  • 2.
    The marginal benefitdecreases with each additional unit that we consume. The first slice of cake is fantastic, however each additional slice of cake might add less and less joy. Marginal costs are the costs from each ADDITIONAL unit of consumption/production. It could technically increase or decrease, but if your marginal costs are decreasing then you might as well continue to produce, so we focus on the range where our marginal costs are increasing. Ie. Cost of producing goods in a factory. Graphically: • The efficiency output level is where the marginal cost (MC) = Marginal Benefit (MB). • • Why? If we produced 5 units instead of 10 units (the efficient output level in the graph) we can see that at 5 unites the marginal benefit is greater than the marginal cost, therefore there is still some net benefit to be gained by increasing output. Notice that beyond 10 units the marginal cost is greater than the marginal benefit, so it’s as if each additional unit you produce beyond 10 units is adding a negative overall utility. • The cost is the amount of money or amount of resources that a producer must give up to produce a good. Of course the price is what the producer receives when they sell the good. If the producer
  • 3.
    sells their goodsor services for a price higher than their costs, then they make a surplus, this surplus is called producer surplus. Since the cost curve graphs amount/quantity producers are willing to supply at each price level, the supply curve and the marginal cost curve are the same. Why? Because the marginal cost curve shows the minimum cost for each quantity level and the producer would be willing to supply quantity that in a worst case, results in their costs being equal to the price they receive. Therefore, if the market price for a good is $3 then producers would be willing to supply a quantity where their marginal cost is also $3. Therefore, the marginal cost curve is the same as the supply curve.
  • 4.
    Markets may notalways be efficient: 5 Obstacles to efficiency: • Price ceilings (maximum price) and price floors (minimum price) – government regulations that set a maximum price or a minimum price for goods or services. • Taxes, subsidies and quotas. Taxes increase prices paid by consumers and decrease revenues received by businesses. Subsidies increase the revenue/funds businesses receive (thus encouraging greater production). And quotas directly impose some production amount, and this production quantity may or may not be efficient. • Monopoly: A monopoly is a firm that is the only firm in a market. Monopolies usually decrease production below the efficient level so that they can charge a higher price. • Public goods: A public good is a good that can be consumed by all people who are part of a community whether paid for or not. Examples: fresh air and parks. This can mean the marginal costs to using the public good is so low that people overconsume the good because they don’t take into account the cost to the community as a whole when making their individual decisions. • Externalities – external costs or benefits that not directly included in cost revenue calculations. Pollution can be an external cost that might mean companies produce higher quantities than they would produce if they had to pay to reverse these environmental costs/externalities. A positive externality might greater profits for a local mall after a bunch of houses are built in an area. Property developers will not take the profits of the retailers in the mall into account when making their building decision s. This can mean property developers should produce more homes because the marginal benefit to all entities affected is higher, hence we may underproduce property, thus being inefficient.
  • 5.
    • Inefficiency createsa deadweight loss: • This is the lost consumer and producer surplus (it is combined, so it is the loss to society as a whole) from any production that is inefficient, that is any production that does not equate marginal cost to marginal benefit results in a deadweight loss.