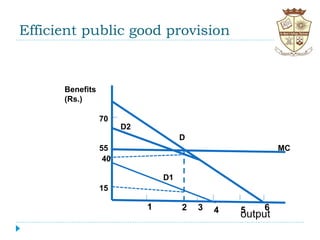
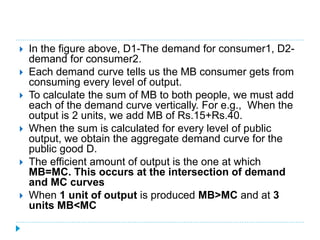
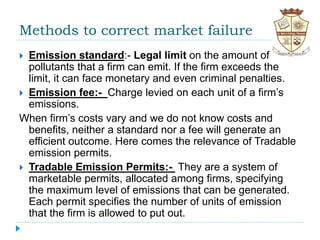
Market Failure, Externality and
Public Goods
Dr.Sweety Thomas
Assistant Professor (on contract)
Department of Economics
St.Mary’s College,Thrissur
Scheme of presentation
 Market Failure
 Reasons for market failure
 Market power
 Incomplete information
 Externalities
 Public goods
 Ways of correcting market failure
 Emission standard
 Emission fee
 Tradable emission permit
Market Failure
 Market failure is the situation in which an
unregulated competitive market is inefficient
because prices fail to provide proper signals to
consumers and producers. The unregulated
competitive market is inefficient i.e. it does not maximize
aggregate consumer and producer surplus.
 The circumstances due to which market fails to achieve
economic efficiency or maximum social welfare have
been called market failures. The basic reasons for this
are:
 Market power
 Incomplete information
 Externalities
 Public goods
Reasons for Market failure
 Market power:- A seller of a product has monopoly
power if it can profitably charge a price greater than MC.
A buyer has monopsony power when its purchasing
decision can affect the price of a good.
 The following steps can be followed to show that
imperfect competition in the product market leads to
economic inefficiency and pareto non optimality.
 profit maximizing firm always produce where MR=MC.
 If commodity Y is produced in a perfectly competitive
market, Py=MRy=Mcy
 On the other hand, if commodity X is produced by a
monopolist (or other imperfect
competitor),Px>MRx=MCx
 Then, MRTxy= MCx/Mcy= MRx/MRy < Px/Py =MRSxy
 i.e., MRTxy < MRSxy, so that the third condition for
pareto optimum and economic efficiency is violated.
Incomplete information
 If consumers do not have accurate information about
market prices or product quality, the market system
will not operate efficiently. This lack of information may
give producers an incentive to supply too much of
some products and too little of others.
 In other cases, while some consumers may not buy a
product even though they would benefit from doing so,
others buy those products that leave them worse off.
 For example, consumers may buy pills that guarantee
weight loss, only to find that they have no medical value.
 Finally a lack of information may prevent some markets
from ever developing. It may for e.g., be impossible to
purchase certain kinds of insurance because suppliers
of insurance lack adequate information about consumers
likely to be at risk.
 Each of the informational problems can lead to market
inefficiency.
Externality
 Action by a producer or a consumer which affects
other producers or consumers, but is not accounted
for in the market price. Such costs or benefits are
called externalities because they are external to the
“market”.
 They can be negative when the action of one party
imposes costs on another party. For e.g., when a steel
plant dumps its waste in a river that fishermen
depend on for their daily catch. The more waste the
steel plant dumps in the river, the fewer fish will be
supported. The firm, however has no incentive to account
for the external costs that it imposes on fishermen when
making its production decision. Furthermore, there is no
market in which these external costs can be reflected
in the price of steel.
 The externality can be positive when the action of
one party benefits another party, for e.g., it occurs
when a home owner repaints her house and
plants an attractive garden. All the neighbours
benefit from this activity, even though the home
owner’s decision to repaint and landscape probably
did not take these benefits in to account.
Negative externalities and inefficiencies
 Since externalities are not reflected in market prices,
they can be a source of economic inefficiency.
 When firms do not take into account the harms
associated with externalities the result is excess
production and unnecessary social costs.
 We assume that because the firm has a fixed-
proportions production function, it cannot alter its
input combination; waste and other effluent can be
reduced only by lowering output.
 The figure for a firm is given below.
The production decision of a steel plant
(figure: a)
PRIC
E
FIRM OUTPUT
MSC(MC+MEC)
MC
MEC
P1
qq
MC=P=MR
P=MSC
 Marginal External Cost (MEC):- Measures the
added cost of the externality associated with
each additional unit of output produced. In
practice, MEC is upward sloping for most forms of
pollution. As the firm produces additional output and
dumps additional effluent, the environmental harm to
fish industry increases.
 Firm is producing too much output (q instead of q)
and generating too much effluent.
Market demand and supply curves assuming
that all steel plants generate similar
externalities
 Industry level
PRICE
INDUSTRY OUTPUT
D
MEC1
MSC1=MC1+MEC1
S=MC1P
P
1
Q Q1Efficient output
Competitive output
 In the figure(b) above, MC1- Industry supply curve
 MEC1=MEC associated with industry output, obtained by
summing up the MC of every person harmed at each
level of output.
 MSC1=MC1+MEC1
 The efficient industry output level-MSC=MB i.e. at Q, at
the intersection of MSC1 and Demand curves
 Competitive industry output,Q1 where demand curve and
MC1 curve intersect.
 Economic inefficiency:- The excess of production
that results in too much effluent being dumped in
the river. The source of inefficiency is the
incorrect pricing of the product.
 When we move from the profit- maximizing to the
socially efficient output, firms are worse off
because their profits are reduced, and purchasers
of steel are worse off because the price of the steel
has increased.
 However, these losses are less than the gain to
those who were harmed by the adverse effect of the
dumping of the effluent in the river.
 When there are negative externalities, the average
private cost of production is less than the average
social cost.
 Thus negative externalities encourage too many
firms to remain in the industry.
Positive externalities and inefficiency

VALUE
REPAIR LEVEL
MC
MEB
MS
B
D (MB)
P1
P
Q1 Q
MSB=MC
 In the figure above , MC curve shows the cost of repairs
as more work is done on the house; it is horizontal
because this cost is unaffected by the amount of repairs.
 Demand curve measures the marginal private benefit of
the repairs to the home owner.
 The home owner will choose to invest q1 in repairs, at
the intersection of her demand and MC curves. But
repairs generate external benefits to the neighbours,
as the MEB shows.
 MEB is downward sloping in this e.g. because the
marginal benefit is large for a small amount of repair but
falls as the repair work becomes extensive.
 MSB=D+ MEB, at efficient level of output q MSB=MC; at
the intersection of MSB and MC at lower price p.
 The inefficiency arises because the home owner doesn’t
receive all the benefits of her investment in repairs and
landscaping.
Public good
 Nonexclusive and non rival good that can be made
available cheaply but which, once available, is difficult to
prevent others from consuming.
 For a public good MC of provision to an additional
consumer is 0 and people cannot be excluded from
consuming it.
 For most goods that are provide privately, the MC of
producing more of the good is positive.
 Non-rival good:- Good for which the MC for its
provision to an additional consumer is 0. For e.g. for
some goods, additional consumers do not add cost.
 The use of highway:- it already exists and there is no
congestion, the additional cost of driving on it is 0.
 The use of light house by a ship:- once the light house is
built and functioning, its use by an additional ship adds
 The public television:- the cost of one more viewer is 0.
 Most goods are rival in consumption. For e.g., when you
buy furniture, you have ruled out the possibility that
someone else can buy it.
 Non exclusive goods:- Goods that people cannot be
excluded from consuming, so that it is difficult or
impossible to charge for its use. For e.g., National
defense, once a nation has provided for its national
defense, all citizens enjoy its benefits. Defense is
nonexclusive and nonrival because the MC of providing
defense to an additional person is 0.
 A light house and public T.V are also example for
nonexclusive goods.
 Many publicly provided goods are either rival in
consumption, exclusive or both. For e.g., high school
education, management of national park and so on.
Efficiency and Public goods
 The efficient level of provision of a private good is
determined by comparing the marginal benefit of an
additional unit to the MC of producing it.
 Efficiency is achieved when MB=MC.
 With a public good, the focus is how much each
person values an additional unit of out put. The MB
is obtained by adding these values for all people who
enjoy the good.
 The figure below illustrates the efficient level of
producing a public good.
Efficient public good provision
output
1 2 4 5 63
15
40
55
70
Benefits
(Rs.)
MC
D1
D2
D
 In the figure above, D1-The demand for consumer1, D2-
demand for consumer2.
 Each demand curve tells us the MB consumer gets from
consuming every level of output.
 To calculate the sum of MB to both people, we must add
each of the demand curve vertically. For e.g., When the
output is 2 units, we add MB of Rs.15+Rs.40.
 When the sum is calculated for every level of public
output, we obtain the aggregate demand curve for the
public good D.
 The efficient amount of output is the one at which
MB=MC. This occurs at the intersection of demand
and MC curves
 When 1 unit of output is produced MB>MC and at 3
units MB<MC
Public goods and market failure
 Free rider: Consumer or producer who does not
pay for a nonexclusive good in the expectation that
others will . For e.g., Mosquito abatement program
cannot be provided without benefitting everyone. So
households have no incentive to pay what the
program is really worth to them.
 People can act as free riders , who understate
the value of the program so that they can enjoy the
benefit of the good without paying for it.
 The public good must therefore be subsidized or
provided by government if it is to be produced
efficiently.
Methods to correct market failure
 Emission standard:- Legal limit on the amount of
pollutants that a firm can emit. If the firm exceeds the
limit, it can face monetary and even criminal penalties.
 Emission fee:- Charge levied on each unit of a firm’s
emissions.
When firm’s costs vary and we do not know costs and
benefits, neither a standard nor a fee will generate an
efficient outcome. Here comes the relevance of Tradable
emission permits.
 Tradable Emission Permits:- They are a system of
marketable permits, allocated among firms, specifying
the maximum level of emissions that can be generated.
Each permit specifies the number of units of emission
that the firm is allowed to put out.
REFERENCES
 Robert S. Pindyck and Daniel L. Rubinfeld,
Microeconomics, Prentice-hall International
Dr.Sweety Thomas Market Failure

Dr.Sweety Thomas Market Failure

  • 1.
    Market Failure, Externalityand Public Goods Dr.Sweety Thomas Assistant Professor (on contract) Department of Economics St.Mary’s College,Thrissur
  • 2.
    Scheme of presentation Market Failure  Reasons for market failure  Market power  Incomplete information  Externalities  Public goods  Ways of correcting market failure  Emission standard  Emission fee  Tradable emission permit
  • 3.
    Market Failure  Marketfailure is the situation in which an unregulated competitive market is inefficient because prices fail to provide proper signals to consumers and producers. The unregulated competitive market is inefficient i.e. it does not maximize aggregate consumer and producer surplus.  The circumstances due to which market fails to achieve economic efficiency or maximum social welfare have been called market failures. The basic reasons for this are:  Market power  Incomplete information  Externalities  Public goods
  • 4.
    Reasons for Marketfailure  Market power:- A seller of a product has monopoly power if it can profitably charge a price greater than MC. A buyer has monopsony power when its purchasing decision can affect the price of a good.  The following steps can be followed to show that imperfect competition in the product market leads to economic inefficiency and pareto non optimality.  profit maximizing firm always produce where MR=MC.  If commodity Y is produced in a perfectly competitive market, Py=MRy=Mcy  On the other hand, if commodity X is produced by a monopolist (or other imperfect competitor),Px>MRx=MCx  Then, MRTxy= MCx/Mcy= MRx/MRy < Px/Py =MRSxy  i.e., MRTxy < MRSxy, so that the third condition for pareto optimum and economic efficiency is violated.
  • 5.
    Incomplete information  Ifconsumers do not have accurate information about market prices or product quality, the market system will not operate efficiently. This lack of information may give producers an incentive to supply too much of some products and too little of others.  In other cases, while some consumers may not buy a product even though they would benefit from doing so, others buy those products that leave them worse off.  For example, consumers may buy pills that guarantee weight loss, only to find that they have no medical value.  Finally a lack of information may prevent some markets from ever developing. It may for e.g., be impossible to purchase certain kinds of insurance because suppliers of insurance lack adequate information about consumers likely to be at risk.  Each of the informational problems can lead to market inefficiency.
  • 6.
    Externality  Action bya producer or a consumer which affects other producers or consumers, but is not accounted for in the market price. Such costs or benefits are called externalities because they are external to the “market”.  They can be negative when the action of one party imposes costs on another party. For e.g., when a steel plant dumps its waste in a river that fishermen depend on for their daily catch. The more waste the steel plant dumps in the river, the fewer fish will be supported. The firm, however has no incentive to account for the external costs that it imposes on fishermen when making its production decision. Furthermore, there is no market in which these external costs can be reflected in the price of steel.
  • 7.
     The externalitycan be positive when the action of one party benefits another party, for e.g., it occurs when a home owner repaints her house and plants an attractive garden. All the neighbours benefit from this activity, even though the home owner’s decision to repaint and landscape probably did not take these benefits in to account.
  • 8.
    Negative externalities andinefficiencies  Since externalities are not reflected in market prices, they can be a source of economic inefficiency.  When firms do not take into account the harms associated with externalities the result is excess production and unnecessary social costs.  We assume that because the firm has a fixed- proportions production function, it cannot alter its input combination; waste and other effluent can be reduced only by lowering output.  The figure for a firm is given below.
  • 9.
    The production decisionof a steel plant (figure: a) PRIC E FIRM OUTPUT MSC(MC+MEC) MC MEC P1 qq MC=P=MR P=MSC
  • 10.
     Marginal ExternalCost (MEC):- Measures the added cost of the externality associated with each additional unit of output produced. In practice, MEC is upward sloping for most forms of pollution. As the firm produces additional output and dumps additional effluent, the environmental harm to fish industry increases.  Firm is producing too much output (q instead of q) and generating too much effluent.
  • 11.
    Market demand andsupply curves assuming that all steel plants generate similar externalities  Industry level PRICE INDUSTRY OUTPUT D MEC1 MSC1=MC1+MEC1 S=MC1P P 1 Q Q1Efficient output Competitive output
  • 12.
     In thefigure(b) above, MC1- Industry supply curve  MEC1=MEC associated with industry output, obtained by summing up the MC of every person harmed at each level of output.  MSC1=MC1+MEC1  The efficient industry output level-MSC=MB i.e. at Q, at the intersection of MSC1 and Demand curves  Competitive industry output,Q1 where demand curve and MC1 curve intersect.  Economic inefficiency:- The excess of production that results in too much effluent being dumped in the river. The source of inefficiency is the incorrect pricing of the product.
  • 13.
     When wemove from the profit- maximizing to the socially efficient output, firms are worse off because their profits are reduced, and purchasers of steel are worse off because the price of the steel has increased.  However, these losses are less than the gain to those who were harmed by the adverse effect of the dumping of the effluent in the river.  When there are negative externalities, the average private cost of production is less than the average social cost.  Thus negative externalities encourage too many firms to remain in the industry.
  • 14.
    Positive externalities andinefficiency  VALUE REPAIR LEVEL MC MEB MS B D (MB) P1 P Q1 Q MSB=MC
  • 15.
     In thefigure above , MC curve shows the cost of repairs as more work is done on the house; it is horizontal because this cost is unaffected by the amount of repairs.  Demand curve measures the marginal private benefit of the repairs to the home owner.  The home owner will choose to invest q1 in repairs, at the intersection of her demand and MC curves. But repairs generate external benefits to the neighbours, as the MEB shows.  MEB is downward sloping in this e.g. because the marginal benefit is large for a small amount of repair but falls as the repair work becomes extensive.  MSB=D+ MEB, at efficient level of output q MSB=MC; at the intersection of MSB and MC at lower price p.  The inefficiency arises because the home owner doesn’t receive all the benefits of her investment in repairs and landscaping.
  • 16.
    Public good  Nonexclusiveand non rival good that can be made available cheaply but which, once available, is difficult to prevent others from consuming.  For a public good MC of provision to an additional consumer is 0 and people cannot be excluded from consuming it.  For most goods that are provide privately, the MC of producing more of the good is positive.  Non-rival good:- Good for which the MC for its provision to an additional consumer is 0. For e.g. for some goods, additional consumers do not add cost.  The use of highway:- it already exists and there is no congestion, the additional cost of driving on it is 0.  The use of light house by a ship:- once the light house is built and functioning, its use by an additional ship adds
  • 17.
     The publictelevision:- the cost of one more viewer is 0.  Most goods are rival in consumption. For e.g., when you buy furniture, you have ruled out the possibility that someone else can buy it.  Non exclusive goods:- Goods that people cannot be excluded from consuming, so that it is difficult or impossible to charge for its use. For e.g., National defense, once a nation has provided for its national defense, all citizens enjoy its benefits. Defense is nonexclusive and nonrival because the MC of providing defense to an additional person is 0.  A light house and public T.V are also example for nonexclusive goods.  Many publicly provided goods are either rival in consumption, exclusive or both. For e.g., high school education, management of national park and so on.
  • 18.
    Efficiency and Publicgoods  The efficient level of provision of a private good is determined by comparing the marginal benefit of an additional unit to the MC of producing it.  Efficiency is achieved when MB=MC.  With a public good, the focus is how much each person values an additional unit of out put. The MB is obtained by adding these values for all people who enjoy the good.  The figure below illustrates the efficient level of producing a public good.
  • 19.
    Efficient public goodprovision output 1 2 4 5 63 15 40 55 70 Benefits (Rs.) MC D1 D2 D
  • 20.
     In thefigure above, D1-The demand for consumer1, D2- demand for consumer2.  Each demand curve tells us the MB consumer gets from consuming every level of output.  To calculate the sum of MB to both people, we must add each of the demand curve vertically. For e.g., When the output is 2 units, we add MB of Rs.15+Rs.40.  When the sum is calculated for every level of public output, we obtain the aggregate demand curve for the public good D.  The efficient amount of output is the one at which MB=MC. This occurs at the intersection of demand and MC curves  When 1 unit of output is produced MB>MC and at 3 units MB<MC
  • 21.
    Public goods andmarket failure  Free rider: Consumer or producer who does not pay for a nonexclusive good in the expectation that others will . For e.g., Mosquito abatement program cannot be provided without benefitting everyone. So households have no incentive to pay what the program is really worth to them.  People can act as free riders , who understate the value of the program so that they can enjoy the benefit of the good without paying for it.  The public good must therefore be subsidized or provided by government if it is to be produced efficiently.
  • 22.
    Methods to correctmarket failure  Emission standard:- Legal limit on the amount of pollutants that a firm can emit. If the firm exceeds the limit, it can face monetary and even criminal penalties.  Emission fee:- Charge levied on each unit of a firm’s emissions. When firm’s costs vary and we do not know costs and benefits, neither a standard nor a fee will generate an efficient outcome. Here comes the relevance of Tradable emission permits.  Tradable Emission Permits:- They are a system of marketable permits, allocated among firms, specifying the maximum level of emissions that can be generated. Each permit specifies the number of units of emission that the firm is allowed to put out.
  • 23.
    REFERENCES  Robert S.Pindyck and Daniel L. Rubinfeld, Microeconomics, Prentice-hall International