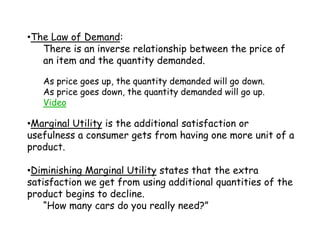
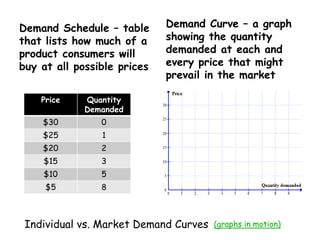
1) The document discusses microeconomic concepts of supply and demand, including the law of demand which states that as price increases, quantity demanded decreases, and vice versa.
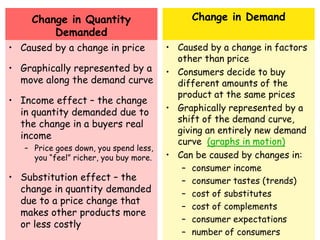
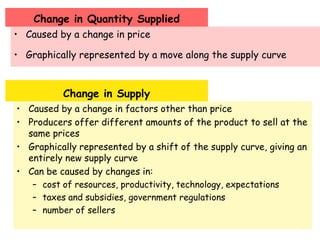
2) It examines factors that can cause changes in demand and supply, such as income, tastes, prices of substitutes/complements, and expectations.
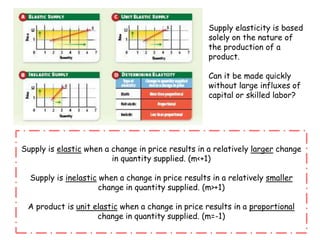
3) The concept of elasticity is introduced, measuring the responsiveness of quantity to price changes, and examples are provided to illustrate elastic versus inelastic demand.
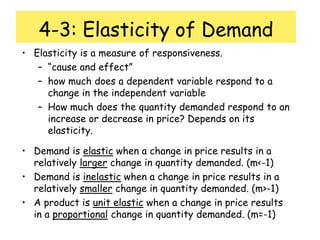
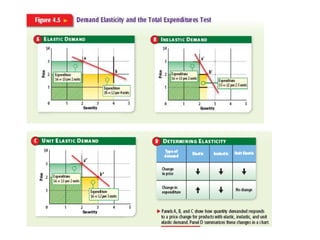
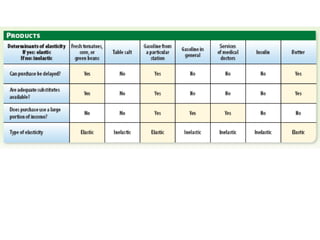
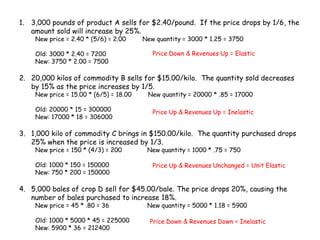
Individual supply is the supply of an individual producer at each price. Market supply is the sum of the individual supply schedules of all producers in the industry
The prices of several product classes – notably fashion and technology – tend to drop over time. One possible reason for the drop over time is different customers assigning a different value to the same product or service. Price skimming models can be used to maximize a product or service’s revenue by planning price reductions over time in a manner that slowly cuts tranches of higher-value customers out of the market. This presentation provides a hands-on demonstration of constructing a price skimming model in Excel, and optimizing planned price reductions.
Decision making is the process of evaluating two or more alternative’s leading to a final choice.This presentation illustrates caselets which narrate various day to day situations in which an organization has to make a choice
Supply content slideshow. Designed for the Economic A level qualification. Can be used in revision and in class.
Subtopics:
Intro to Supply
The Supply Curve
Why is the Supply Curve Upward Sloping?
Determinants of Supply
Joint Supply
This chapter brings together the basic ideas of consumer demand, and the production and cost concerns. This chapter will enable students to understand how price is determined in a market and the role of price.
Supply and Demand GuideTo solve the homework problems do the f.docxcalvins9
Supply and Demand Guide
To solve the homework problems do the following:
1. Identify the determinant change
2. Shift the appropriate curve in the correct direction
3. Change price appropriately
4. Move along the other curve (the one that did not shift) in response to the price change.
The following information will tell you the determinants and how the change, as well as definitions of the key terms.
Demand
Demand: The amount that consumers are willing and able to purchase at various prices.
Law of Demand: Price and Quantity Demanded vary inversely.
Quantity Demanded: The amount that consumers are willing and able to buy at a particular price.
Change in Quantity Demanded: Changes in price change the quantity demanded. This is a Movement Along a Demand Curve in Response to a Price Change.
Change in Demand: This is a shift in the position of the demand curve, either upward or downward. If the curve shifts upward, consumers are saying they will pay more for all quantities of the good or service. If it shifts downward, consumers are saying they will pay less for all quantities of the good or service.
Determinants of Demand: The Demand Curve will shift only when one (or more) of the Determinants of Demand changes. These determinants are:
1. Size of Market: the number of consumers in the market for the good or service. If this factor increases, the curve shifts upward (increase in demand). If this decreases, the curve shifts downward (decrease in demand).
2. Consumer Tastes and Preferences: if these shift in favor of a product, the demand curve shifts upward (demand increases); if these shift against a product, the demand curve shifts downward (demand decreases).
3. Consumer Income: as the income of consumers increase, consumers purchase more of all normal goods (assume all the goods in the homework are normal goods), this shifts the demand curve upward (demand increases); if income decreases, then consumers buy less of all normal goods, this shifts the demand curve downward (demand decreases).
4. Prices of Related Goods:
a. Complimentary Goods: These are goods that are used to together like peanut butter and jelly. If the price of peanut butter goes up, the Quantity Demanded of peanut butter will decrease (a movement along a demand curve in response to a price change). However, the Demand for jelly will decline (decrease in demand) as fewer people buy it to go with the peanut butter, since they are buying less peanut butter.
b. Substitute Goods: These are goods that are used in place of each other. If the price of Coke Cola goes up, the Quantity Demanded of Coke does down (a movement along the demand curve). But the Demand for Pepsi – the substitute good – goes up as people substitute the lower priced Pepsi for the higher priced Coke (the Pepsi demand curve shifts upward).
5. Expectations about the Future: If people have a positive view of the future they will consumer more and save less. This shifts th.
2. 4-1: What is Demand? Microeconomics is the part of economic theory that deals with the behavior and decision making by individual units, such as people and firms. Microeconomic concepts help explain how prices are determined. Demand is the desire, ability, and willingness to buy a product. Demand is a concept specifying the different quantities of an item that will be bought at different prices.
3.
4. Diminishing Marginal Utility states that the extra satisfaction we get from using additional quantities of the product begins to decline. “How many cars do you really need?”
5. Demand Schedule – table that lists how much of a product consumers will buy at all possible prices Demand Curve – a graph showing the quantity demanded at each and every price that might prevail in the market (graphs in motion) Individual vs. Market Demand Curves
6. 4-2: Factors Affecting Demand When it comes to demand, there are two types of changes. When the price of a product changes while all other factors remain the same, there will be a change in the quantity demanded. We move along the existing demand curve. Demand curve does not shift. Price of hamburger decreases at McDonalds, people will buy more hamburgers. Sometimes other factors change while the price remains the same. Then there will be a change, or shift, in total demand. If McDonalds redesigns its restaurants to appeal to more people, they will have more customers, even at the same price. video
7. Change in Quantity Demanded Change in Demand Caused by a change in price Graphically represented by a move along the demand curve Income effect – the change in quantity demanded due to the change in a buyers real income Price goes down, you spend less, you “feel” richer, you buy more. Substitution effect – the change in quantity demanded due to a price change that makes other products more or less costly Caused by a change in factors other than price Consumers decide to buy different amounts of the product at the same prices Graphically represented by a shift of the demand curve, giving an entirely new demand curve (graphs in motion) Can be caused by changes in: consumer income consumer tastes (trends) cost of substitutes cost of complements consumer expectations number of consumers
8. 4-3: Elasticity of Demand Elasticity is a measure of responsiveness. “cause and effect” how much does a dependent variable respond to a change in the independent variable How much does the quantity demanded respond to an increase or decrease in price? Depends on its elasticity. Demand is elastic when a change in price results in a relatively larger change in quantity demanded. (m<-1) Demand is inelastic when a change in price results in a relatively smaller change in quantity demanded. (m>-1) A product is unit elastic when a change in price results in a proportional change in quantity demanded. (m=-1)
9.
10.
11. 3,000 pounds of product A sells for $2.40/pound. If the price drops by 1/6, the amount sold will increase by 25%. New price = 2.40 * (5/6) = 2.00 New quantity = 3000 * 1.25 = 3750 Old: 3000 * 2.40 = 7200 New: 3750 * 2.00 = 7500 20,000 kilos of commodity B sells for $15.00/kilo. The quantity sold decreases by 15% as the price increases by 1/5. New price = 15.00 * (6/5) = 18.00 New quantity = 20000 * .85 = 17000 Old: 20000 * 15 = 300000 New: 17000 * 18 = 306000 1,000 kilo of commodity C brings in $150.00/kilo. The quantity purchased drops 25% when the price is increased by 1/3. New price = 150 * (4/3) = 200 New quantity = 1000 * .75 = 750 Old: 1000 * 150 = 150000 New: 750 * 200 = 150000 5,000 bales of crop D sell for $45.00/bale. The price drops 20%, causing the number of bales purchased to increase 18%. New price = 45 * .80 = 36 New quantity = 5000 * 1.18 = 5900 Old: 1000 * 5000 * 45 = 225000 New: 5900 * 36 = 212400 Price Down & Revenues Up = Elastic Price Up & Revenues Up = Inelastic Price Up & Revenues Unchanged = Unit Elastic Price Down & Revenues Down = Inelastic
12.
13. Change in Quantity Supplied Caused by a change in price Graphically represented by a move along the supply curve Change in Supply Caused by a change in factors other than price Producers offer different amounts of the product to sell at the same prices Graphically represented by a shift of the supply curve, giving an entirely new supply curve Can be caused by changes in: cost of resources, productivity, technology, expectations taxes and subsidies, government regulations number of sellers
14. Supply elasticity is based solely on the nature of the production of a product. Can it be made quickly without large influxes of capital or skilled labor? Supply is elastic when a change in price results in a relatively larger change in quantity supplied. (m<+1) Supply is inelastic when a change in price results in a relatively smaller change in quantity supplied. (m>+1) A product is unit elastic when a change in price results in a proportional change in quantity supplied. (m=-1)
15. 5-2: Theory of Production The production function shows how total output changes when the amount of a single variable (usually labor) changes over the short run. The marginal product is the extra output or change in total product caused by adding one more unit of variable input. Can be illustrated with a production schedule or graph (graphs in motion) .
16. Stages of Production I. Increasing marginal returns - Each additional worker adds more to the total output than the worker before. II. Decreasing marginal returns - Each additional worker is making a diminishing, but still positive, contribution III. Negative marginal returns - Each additional worker decreases total output
17. 5-3: Cost, Revenue, and Profit Maximization Break-Even Point – level of production that generates just enough income to cover its total operating costs Total Revenue – all the revenue that a company receives Marginal Revenue – additional revenue a company receives from the production and sale of one additional unit of output Fixed Costs or Overhead - costs that an organization incurs even when there is little or no activity, usually machinery and capital resources Variable Costs – costs that change when the business’s rate of production or output changes, usually labor and raw materials Total Costs – sum of the fixed and variable costs