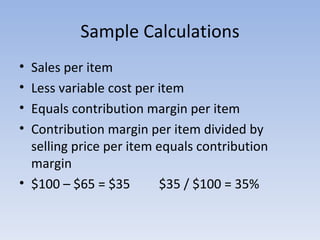
1. The document discusses different types of costs including variable costs, fixed costs, indirect costs, and mixed costs. It provides examples of calculating contribution margin and separating fixed and variable components of mixed costs.
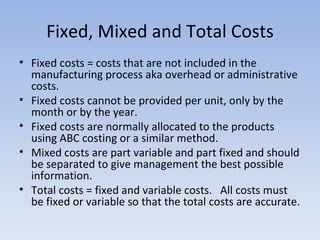
2. Fixed costs remain constant regardless of the number of units produced, while variable costs fluctuate depending on the level of production. Mixed costs contain both fixed and variable elements.
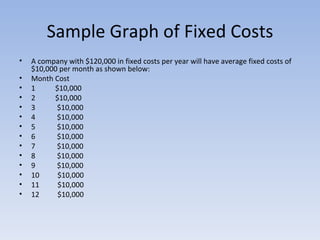
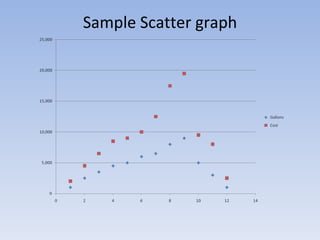
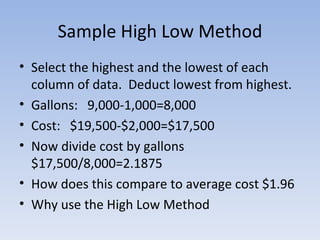
3. The document includes examples of graphs that could be used to illustrate fixed costs over time, variable costs that increase with production volume, and scatter plots of mixed cost data. It also discusses outliers and the high-low estimation method.