This document provides information about traffic characteristics that are important for highway design. It discusses road user characteristics such as physical, mental, and environmental factors that affect driver performance. It also describes vehicular characteristics including static dimensions, weight, power, speed, braking, and off-tracking. Key static dimensions discussed are overall width, length, and height. Dynamic characteristics covered are speed, acceleration/deceleration, and braking. The document provides examples of calculating average skid resistance and braking efficiency. It also discusses the various forces that provide resistance to a vehicle's motion including rolling, air, grade, inertia, and transmission losses.
![PREPARED BY
SHIVKUMAR M H [SONOFGOD]
M.E(UVCE),AMIE
ASSISTANT PROFESSOR AND HIGHWAY ENGINEER
EWIT,BANGALORE](https://image.slidesharecdn.com/chapter2-170305155537/85/Chapter-2-1-320.jpg)
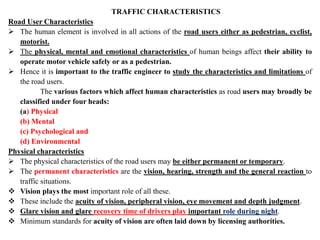


![ROLLING RESISTANCE
When the vehicle wheels roll over the road surface; the irregularities and the
roughness of the surface cause of deformation of the tires,
The road surface itself may undergo deformations.
Shocks and impacts are caused by such a motion
The rolling resistance varies with the type of surfacing.
The rolling resistance is given by P(f)= m*f *g
Where, m = mass of the vehicle in kg
f = coefficient of rolling resistance
P(f) = rolling resistance in N
g = acceleration due to gravity in m/sq (sec)
The rolling resistance depends on the speed of the vehicles also .
Though its value is approximately constant up to a speed of about 50 Kmph at
higher values of speed the 'coefficient increases in value.
The following approximate equation accounts for this increase
f (v)= f(o) [1+ 0·01 (V-50)]
where f(v) = Coefficient of rolling resistance at speed V.
V = speed in Kmph
f (o) = coefficient of rolling resistance, assumed constant up to a speed of 50 Kmph](https://image.slidesharecdn.com/chapter2-170305155537/85/Chapter-2-18-320.jpg)


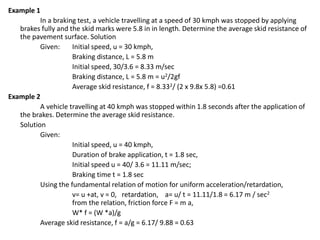
![P (p) = Rear axle torque/ Radius of the rolling drive tire = k*T(e)*G(t)*G(a) / r(w)
r(w) is related to the radius of the tyre r(o) by the following formula,
r(w) = λ*r(0)
λ = tyre deformation factor value of 0·945-0·950 for high pressure air tyres
λ = tyre deformation factor value of 0·930-0·935 for low-pressure tyres, on hard
surfaces
The horse power corresponding to the tractive effort P(p) when the vehicle moves at a
speed of ‘v’ m/sec is
Power output = P(p)* v
But v = V/ 3·6
Power output = [P (p ) x V]/ 3.6
V = 2*π*r(w)*n *3.6 / 60* G(t)*G(a)
where n is the engine speed in R.P.M.
V = 0·377 r(w)*n / G(t)*G(a)
Power output = P(p) x 0·377* r(w)*n / G(t)*G(a)
Engine power (in Watts) = {P(p) x 0·377 x r(w) x n} /{G(t), x G(a) x k }
where k = transmission efficiency
Engine horse-power (metric) = Engine power (in watts)/735
It may be noted that the tractive effort developed at the' wheels
P (p) = Rolling resistance + Air resistance + Grade resistance + Inertia force's due to
acceleration and deceleration = p(f) + or- p(a) + or - p(i)+ p(j)
The following example will illustrate the use of the formulae developed above,](https://image.slidesharecdn.com/chapter2-170305155537/85/Chapter-2-25-320.jpg)
![Problem – 1
A passanger car weighing 2 tonnes (2000 kg) is required to accelerate at a rate of 3 m/sec2 in the first gear
from a speed of 10 kmph . The gradient is + 1 percent and the road has black topped surface. The frontal
projection area of the car is 2.15 m2 . The car tyres have radius of 0.33 m . The rear axle gear ratio is
3.82 : 1 and the first gear ratio is 2.78 : 1. Calculate the engine horse power needed and the speed of
engine. Make the suitable assumptions
Solution :
Tractive force needed = p(p) = p(f) ± p(a) ± p (i) ± p (j)
P(f) = m * g * f
f = 0.02
p(f) = 2000 * 9.81 * 0.02 = 392.4 N
c(a) = 0.39 from table (2.3)
V = 10 kmph initially and increased to 20 kmph. So assume average speed = (10 + 20)/2 = 15 kmph
p(a) = c(a) * A * v2 = 0.39 * 2.15 * (15/3.6)2 = 14.5 N
p(i) = m * g * i = 2000 * 9.81 * (1/100) = 196.2 N
p(j) = m * a = 2000 * 3 = 6000 N
P(p) = 392.4 + 14.5 + 196.2 + 6000 = 6603.1 N
Note : V = 10 kmph initially
Power output = P(p) * v = p(p) * (V/3.6) = 6603.1 * (10/3.6)
= 18341.9 Watt = (18341.9/735) = 24.95 Hp
Assume a transmission efficiency of (0.85 to 0.90) - 0.90 ,
the engine horse power = (24.95/0.90) = 27.72 Hp
Assuming λ = 0.935 ( for low tyre pressure with hard surface),
r (w) = λ * r (o) = 0.935 * 0.33 = 0.308 m
V = [0.377 * r (w) * n ]/ G(t) * G (a)
n = [G(t) * G (a) * V ] / [ 0.377 * r (w)] = [ 2.78 * 3.82 * 10 ] / [0.377 * 0.308 ] = 915 RPM](https://image.slidesharecdn.com/chapter2-170305155537/85/Chapter-2-26-320.jpg)


![When the vehicle which is travelling at particular speed is suddenly allowed to coast
by switching off the engine and putting the gear to neutral, deceleration is caused.
From the force of equation
P(p) = p(f) + p(a)+ or – p(i) + or – p(j)
p(p) = 0 and i (gradient) = 0
p(j) = p(a) + p (f)
m * dv/dt = c(a) * A * v2 + m* f *g
dv/dt = [c(v) * A * v2]/m + f * g](https://image.slidesharecdn.com/chapter2-170305155537/85/Chapter-2-29-320.jpg)
![Problem – 2
An ambassador car travelling at a speed of 60 kmph on a level W.B.M road in good
condition is suddenly allowed to coast by switching off the engine and putting the gear in
neutral. What is the deceleration caused ?
Solution :
dv/dt = [ C(a) * A * v2 ]/m + f * g
for an ambassador car ( from the table 2.3 )
C(a) = 0.39 kg/m3
A = 2.15 m3
m = 1365 kg
for W. B.M road f= 0.025 (from table 2.2)
v = V/3.6 = 60/3.6 = 16.66
dv/dt = [0.39 * 2.15 * (16.66)2 ]/1365+ (0.025 * 9.81)
= 0.17 + 0.25 = 0.42 m/sec2](https://image.slidesharecdn.com/chapter2-170305155537/85/Chapter-2-30-320.jpg)


![02-A Components of Traffic System [Road Users and Vehicles] (Traffic Engineer...](https://cdn.slidesharecdn.com/ss_thumbnails/02acomponentsoftsroadusersvehicles-200412120058-thumbnail.jpg?width=640&height=640&fit=bounds)


