Downloaded 30 times
![Accident Analysis At The Black Spot: A Case Study
DOI: 10.9790/1684-1262105114 www.iosrjournals.org 114 | Page
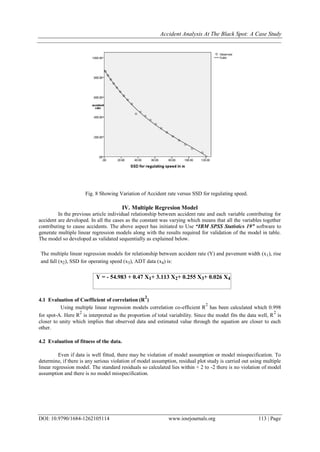
4.3 Evaluation of goodness of fit using standard static F-Test.
To check the authenticity of goodness of fit standard static F-test has been performed using multiple
linear regression models by IBM SPSS Statistics 19. Ftabled is calculated which is 4.7.Here Fcalculated is
1602.007. As Fcalculated is greater than Ftabled at 99.9% level of confidence the goodness of fit condition is
satisfied.
V. Conclusions
From the above project study carried out for spot-A, the following conclusions are arrived:
1. The age group of the driver is influencing in increasing the accident rate.
2. The increase in accident rate in the test may be due to rise and fall of the location.
3. Decrease in pavement width may be one of the reasons to increase the accident rate at the location under
consideration.
4. Increase in operating speed may be causative for the increase in accident rate at the test location.
4. Especially at junctions because of the interference of the flow accident rate may be increased.
5. Increase in ADT especially in peak hour flow may be one of the reasons to increase accident rate.
6. The accident rate may be brought down if operating speed is limited to regulating speed.
8. Increase in road width at critical location under consideration may be the reason to increase accident rate.
References
[1] Cohen. J. and B. Preston, Causes and Prevention of road accidents, Faber and Faber, London, 1968.
[2] Road User Cost Study, Final Report, Central Road Research Institute, New Delhi, 1982.
[3] Road Accident Forms A-1 and 4, the IRC. New Delhi, 1982.
[4] Report of the study group on road safety, ministry of transport, New Delhi, 1972.
[5] Road Safety-A Committee Report, Ministry of Shipping and Transport, New Delhi, 1983.
[6] Safety of motor-cycle and scooter riders, Editorial, Transport Communications Monthly Review, No. 254, New Delhi, 1973.
[7] Special Issue on Motor Vehicle Accident Statistics in India, 1986, Transport Research Division, Ministry of Surface Transport,
New Delhi, 1986.
[8] Motor Transport Statistics, 1991-93 Transport Research Division, Ministry of Shipping and Transport, Govt. of India, New Delhi.
[9] Special Issue on Motor Vehicle Accident Statistics in India, 1986, Transport Research Division, Ministry of Surface Transport,
New Delhi, 1986.
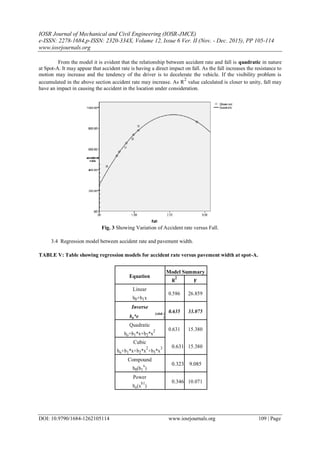
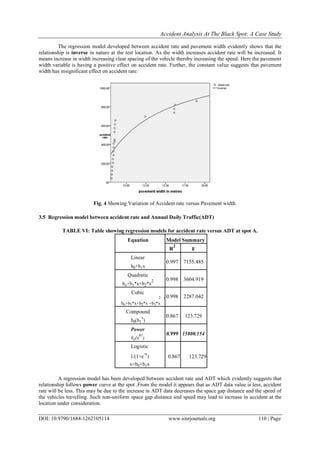
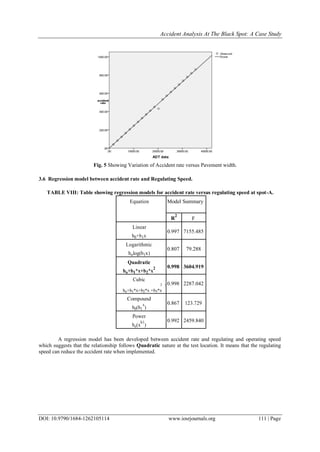
[10] IBM SPSS Statistics 19 Brief Guide © Copyright IBM Corporation 1989, 2011](https://image.slidesharecdn.com/q01262105114-151204071107-lva1-app6891/85/Accident-Analysis-At-The-Black-Spot-A-Case-Study-10-320.jpg)

The document presents a case study analyzing accident rates at a black spot on the Busthenahalli bypass (N.H. 48) in Karnataka, India. It explores the effects of highway geometrics, driver age, and traffic conditions on accident occurrence, utilizing statistical methods such as regression analysis. The study emphasizes the need for improved road planning and design to mitigate accident risks.


![Accident at work [88] 28 mar 2010](https://cdn.slidesharecdn.com/ss_thumbnails/eahbvvalqeyqq4gx7zoi-signature-d09a15e043e39f920493f1d4a06e4c95bd6508a24d65f3e299f255da5a74c72f-poli-150509022450-lva1-app6892-thumbnail.jpg?width=640&height=640&fit=bounds)


