- Apple had sold over 100 million iPods and over 2 billion songs had been downloaded from iTunes by early 2007, showing the success of Apple's strategy of selling the iPod at a high price while selling music cheaply.
- However, it remains to be seen how long the iPod will maintain its dominance in the digital music player market.
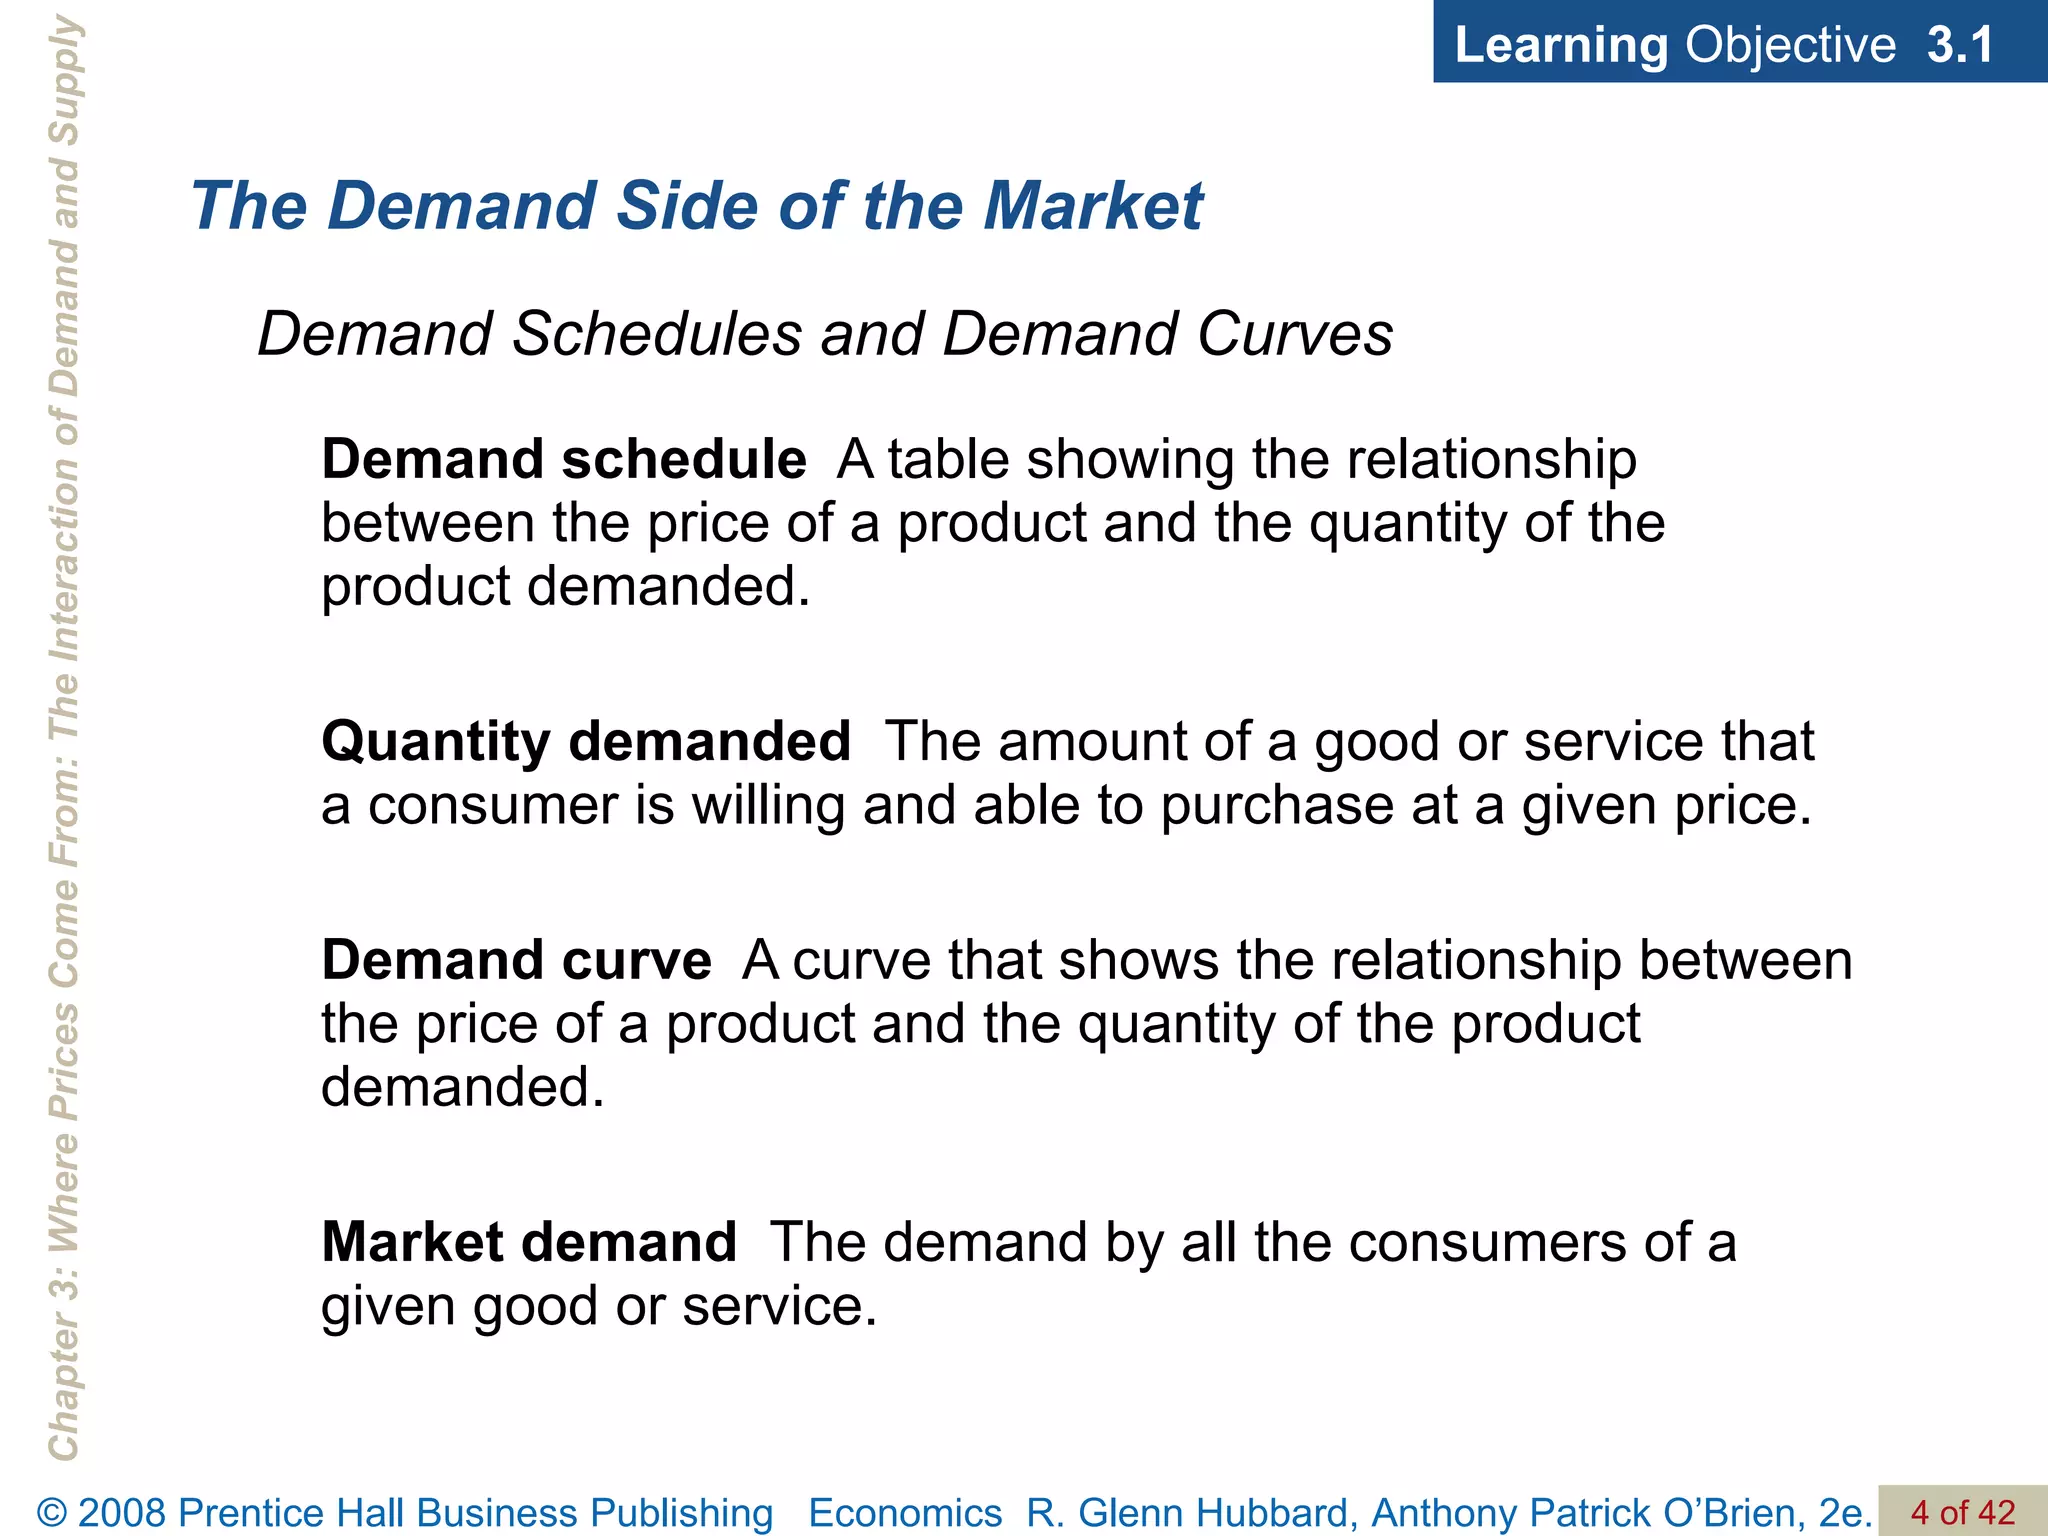
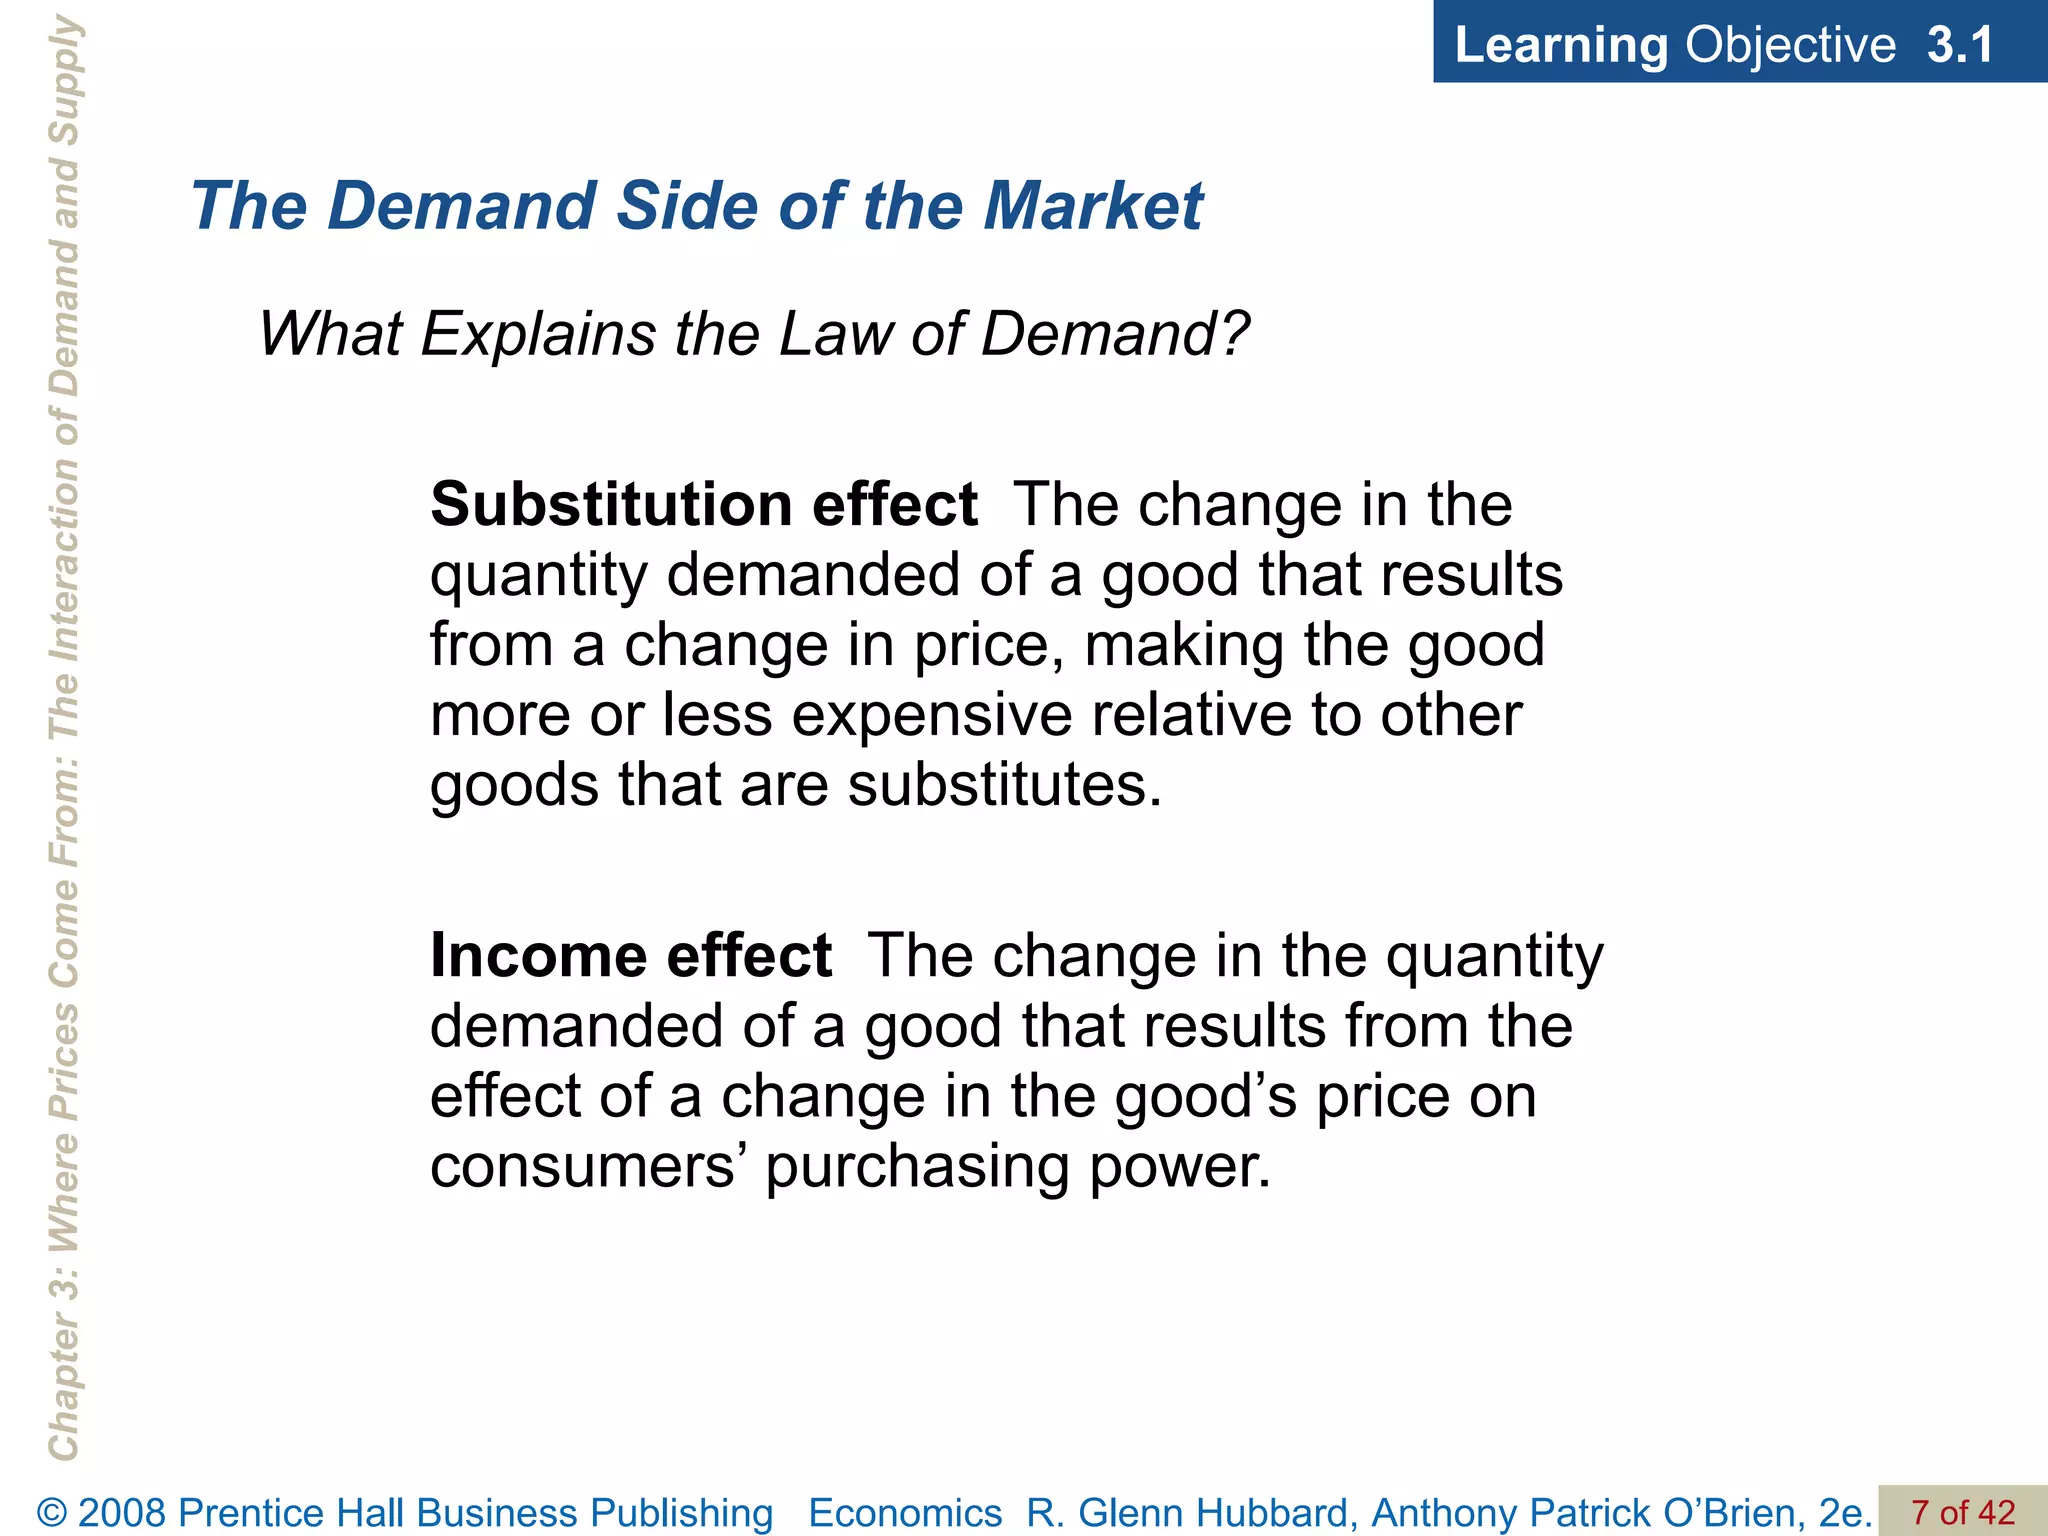
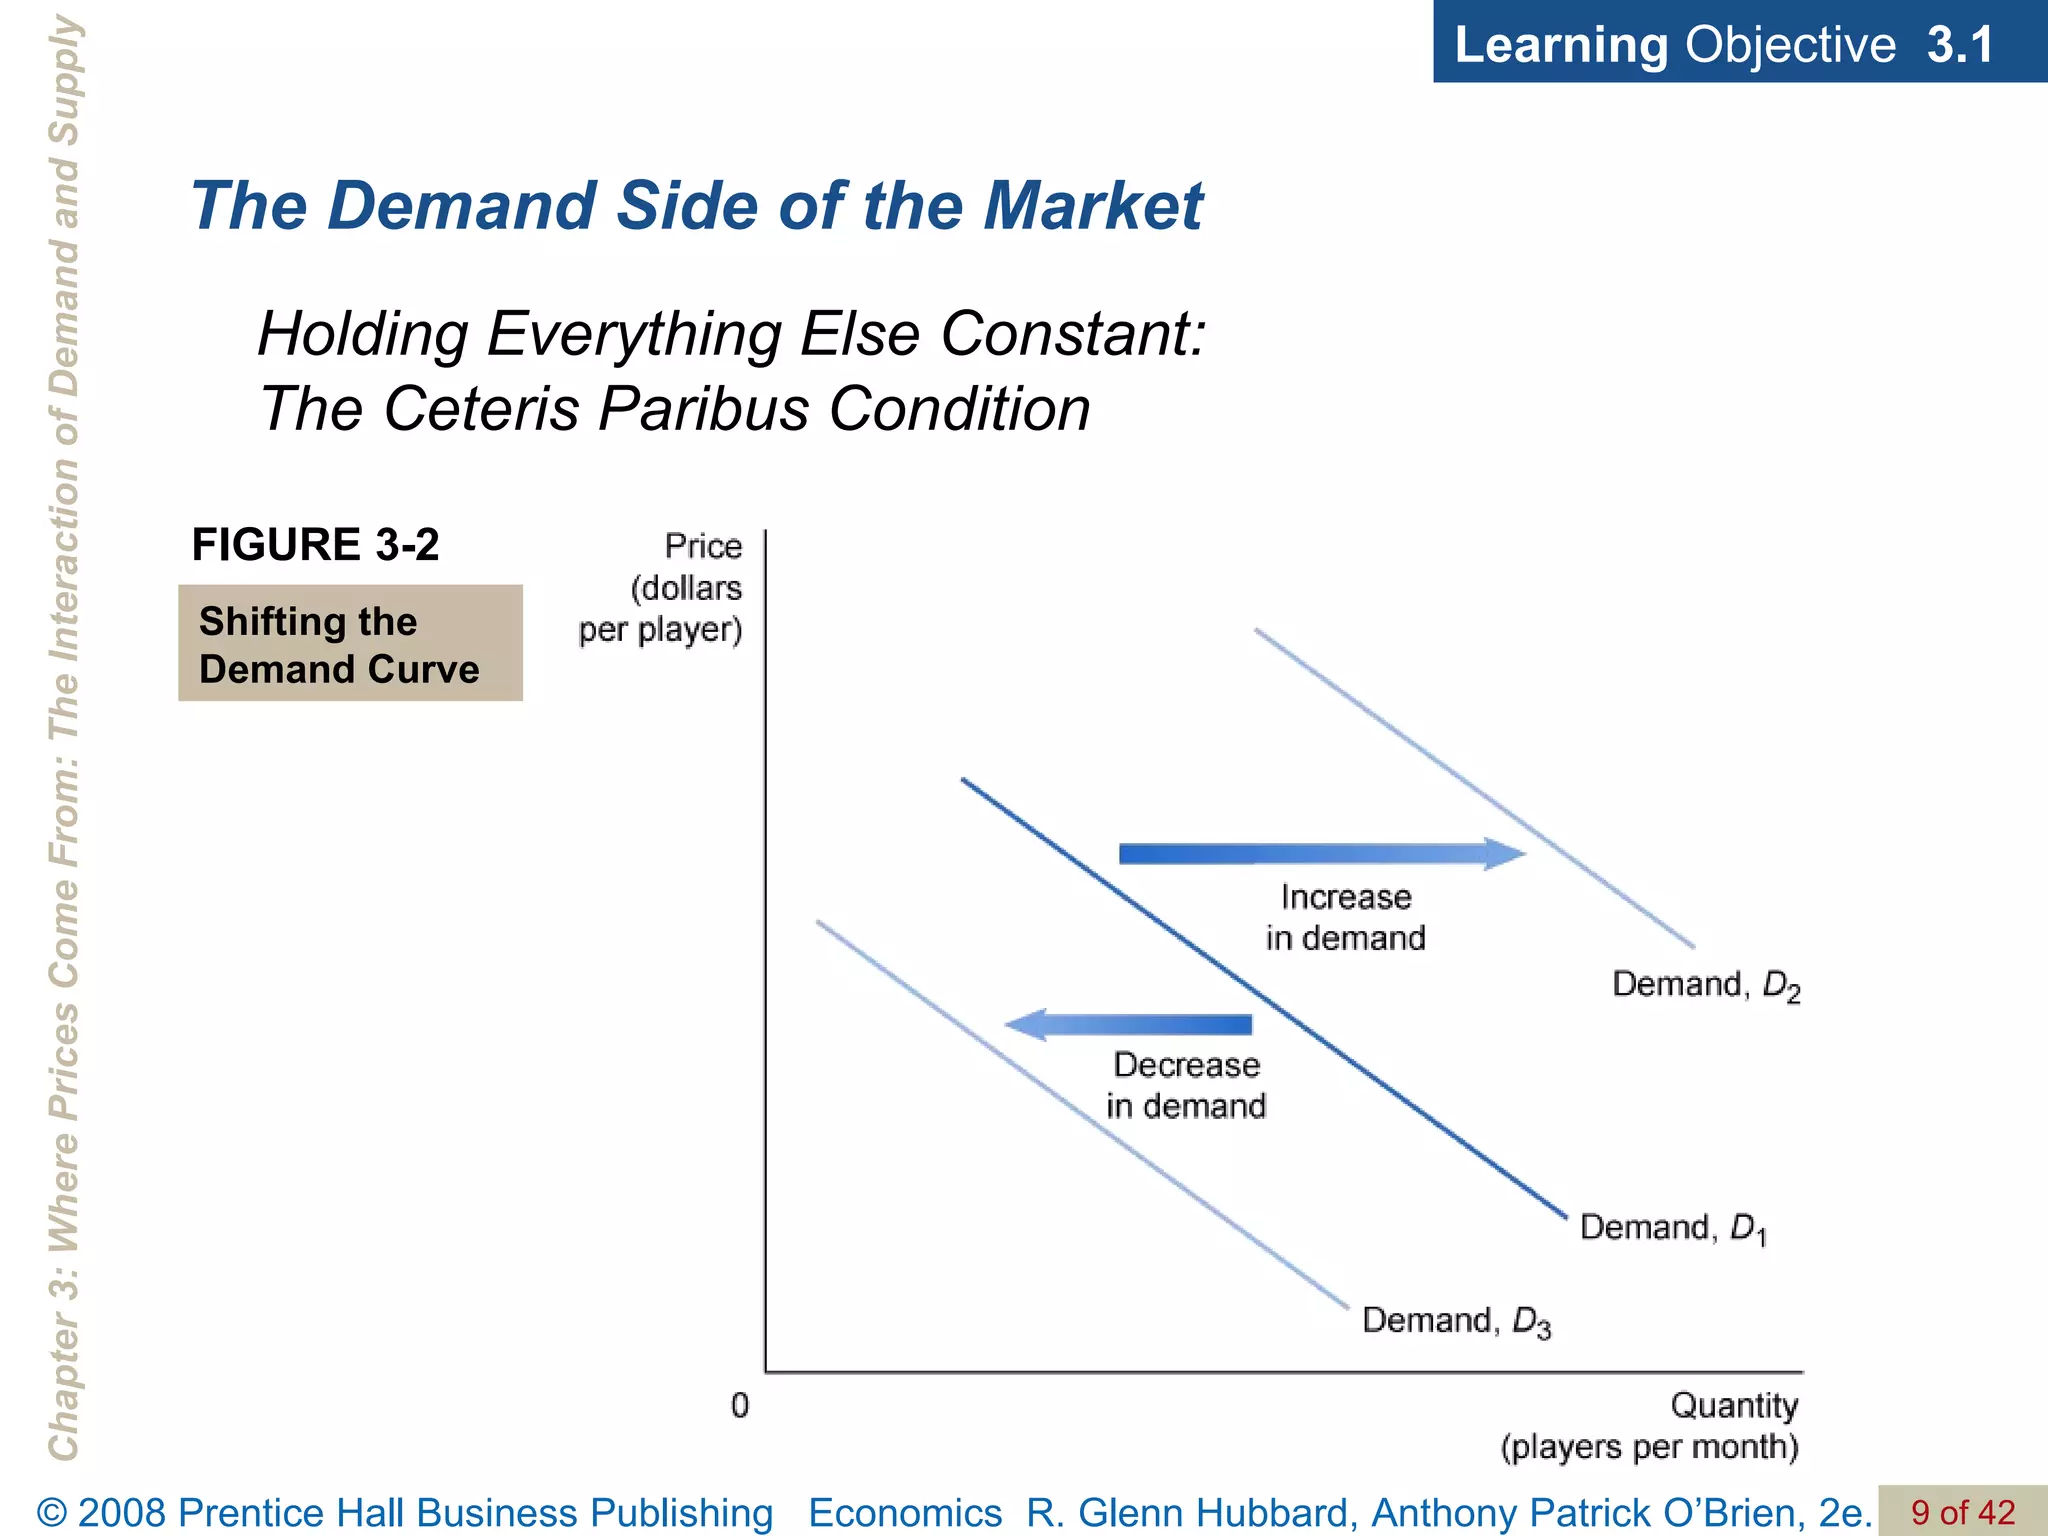
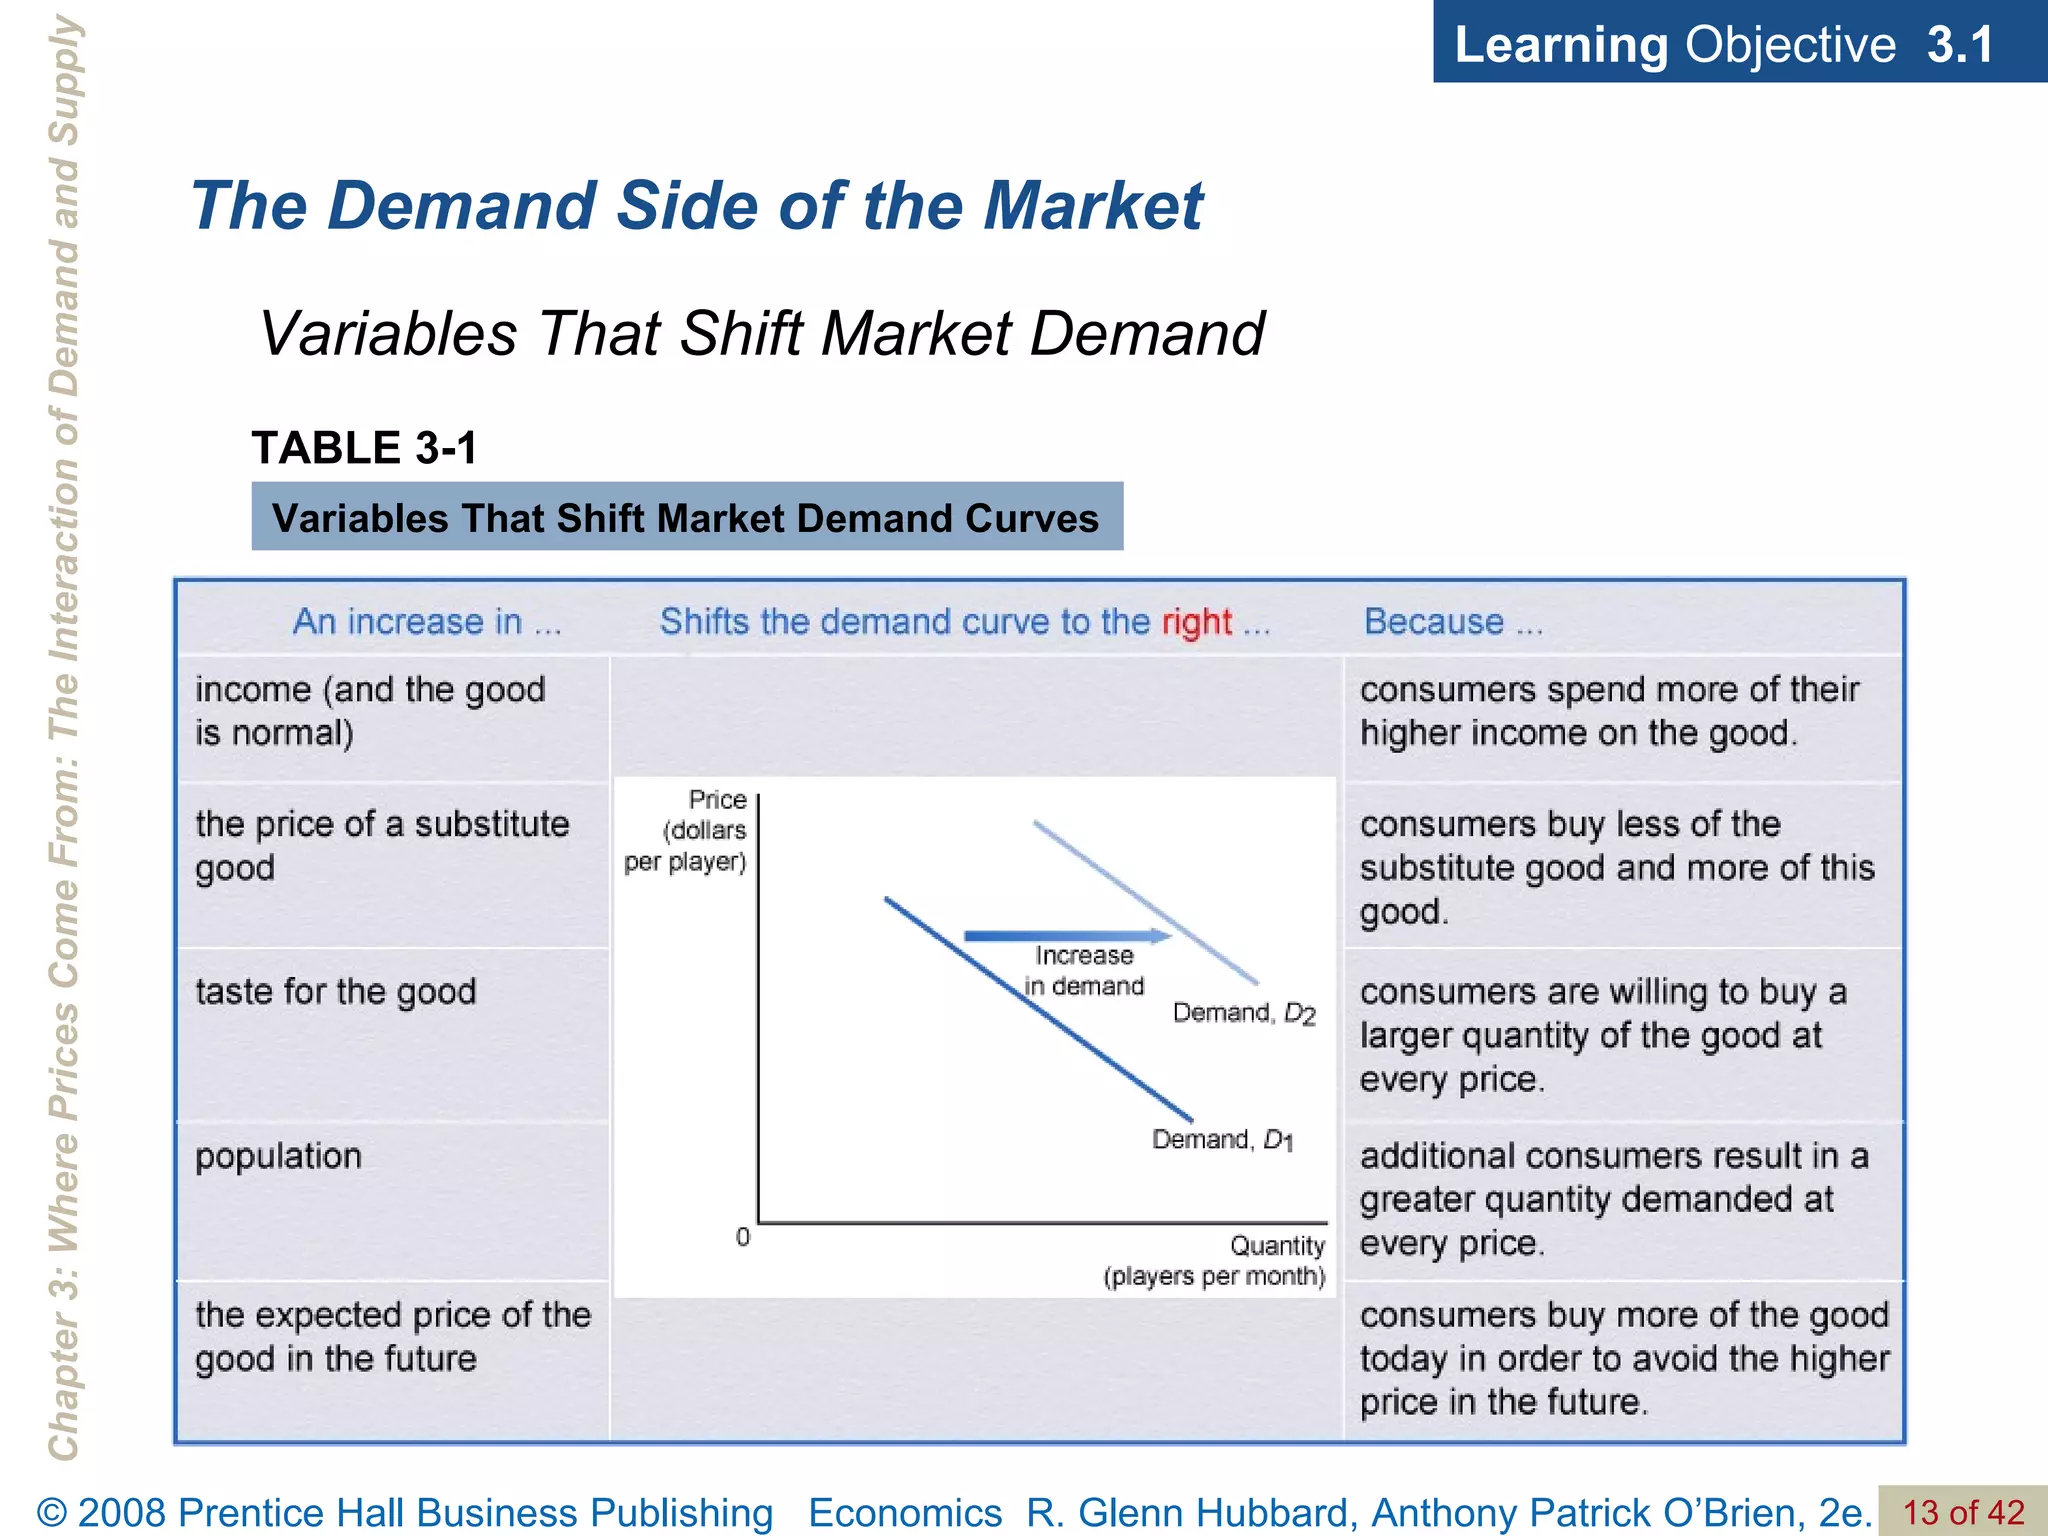
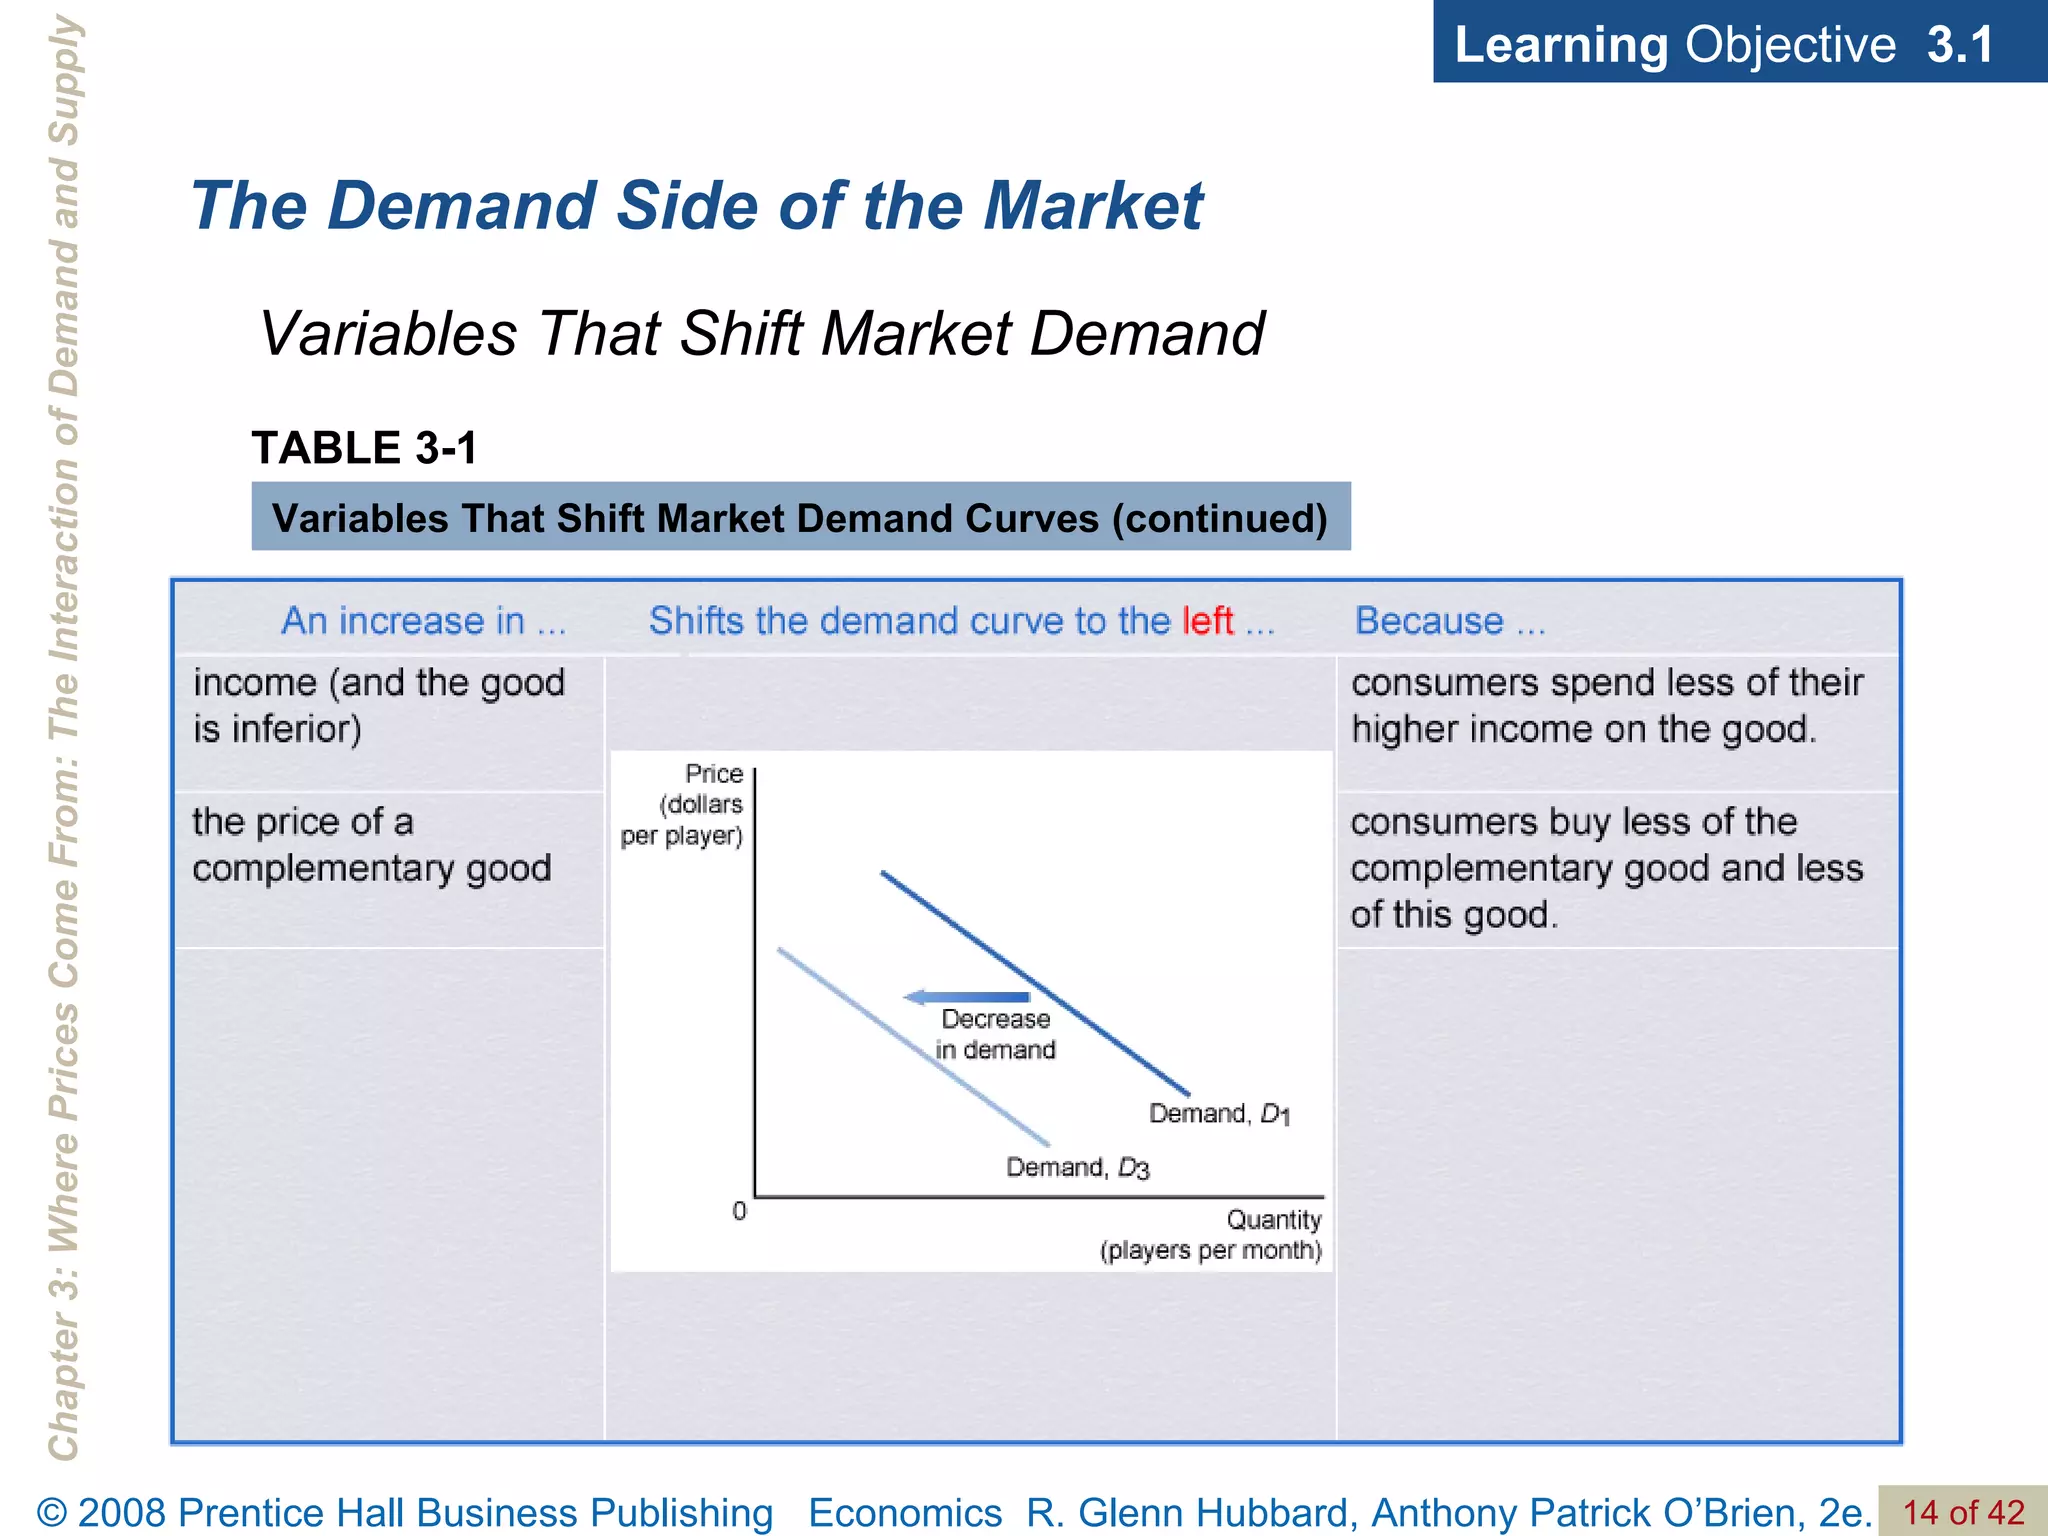
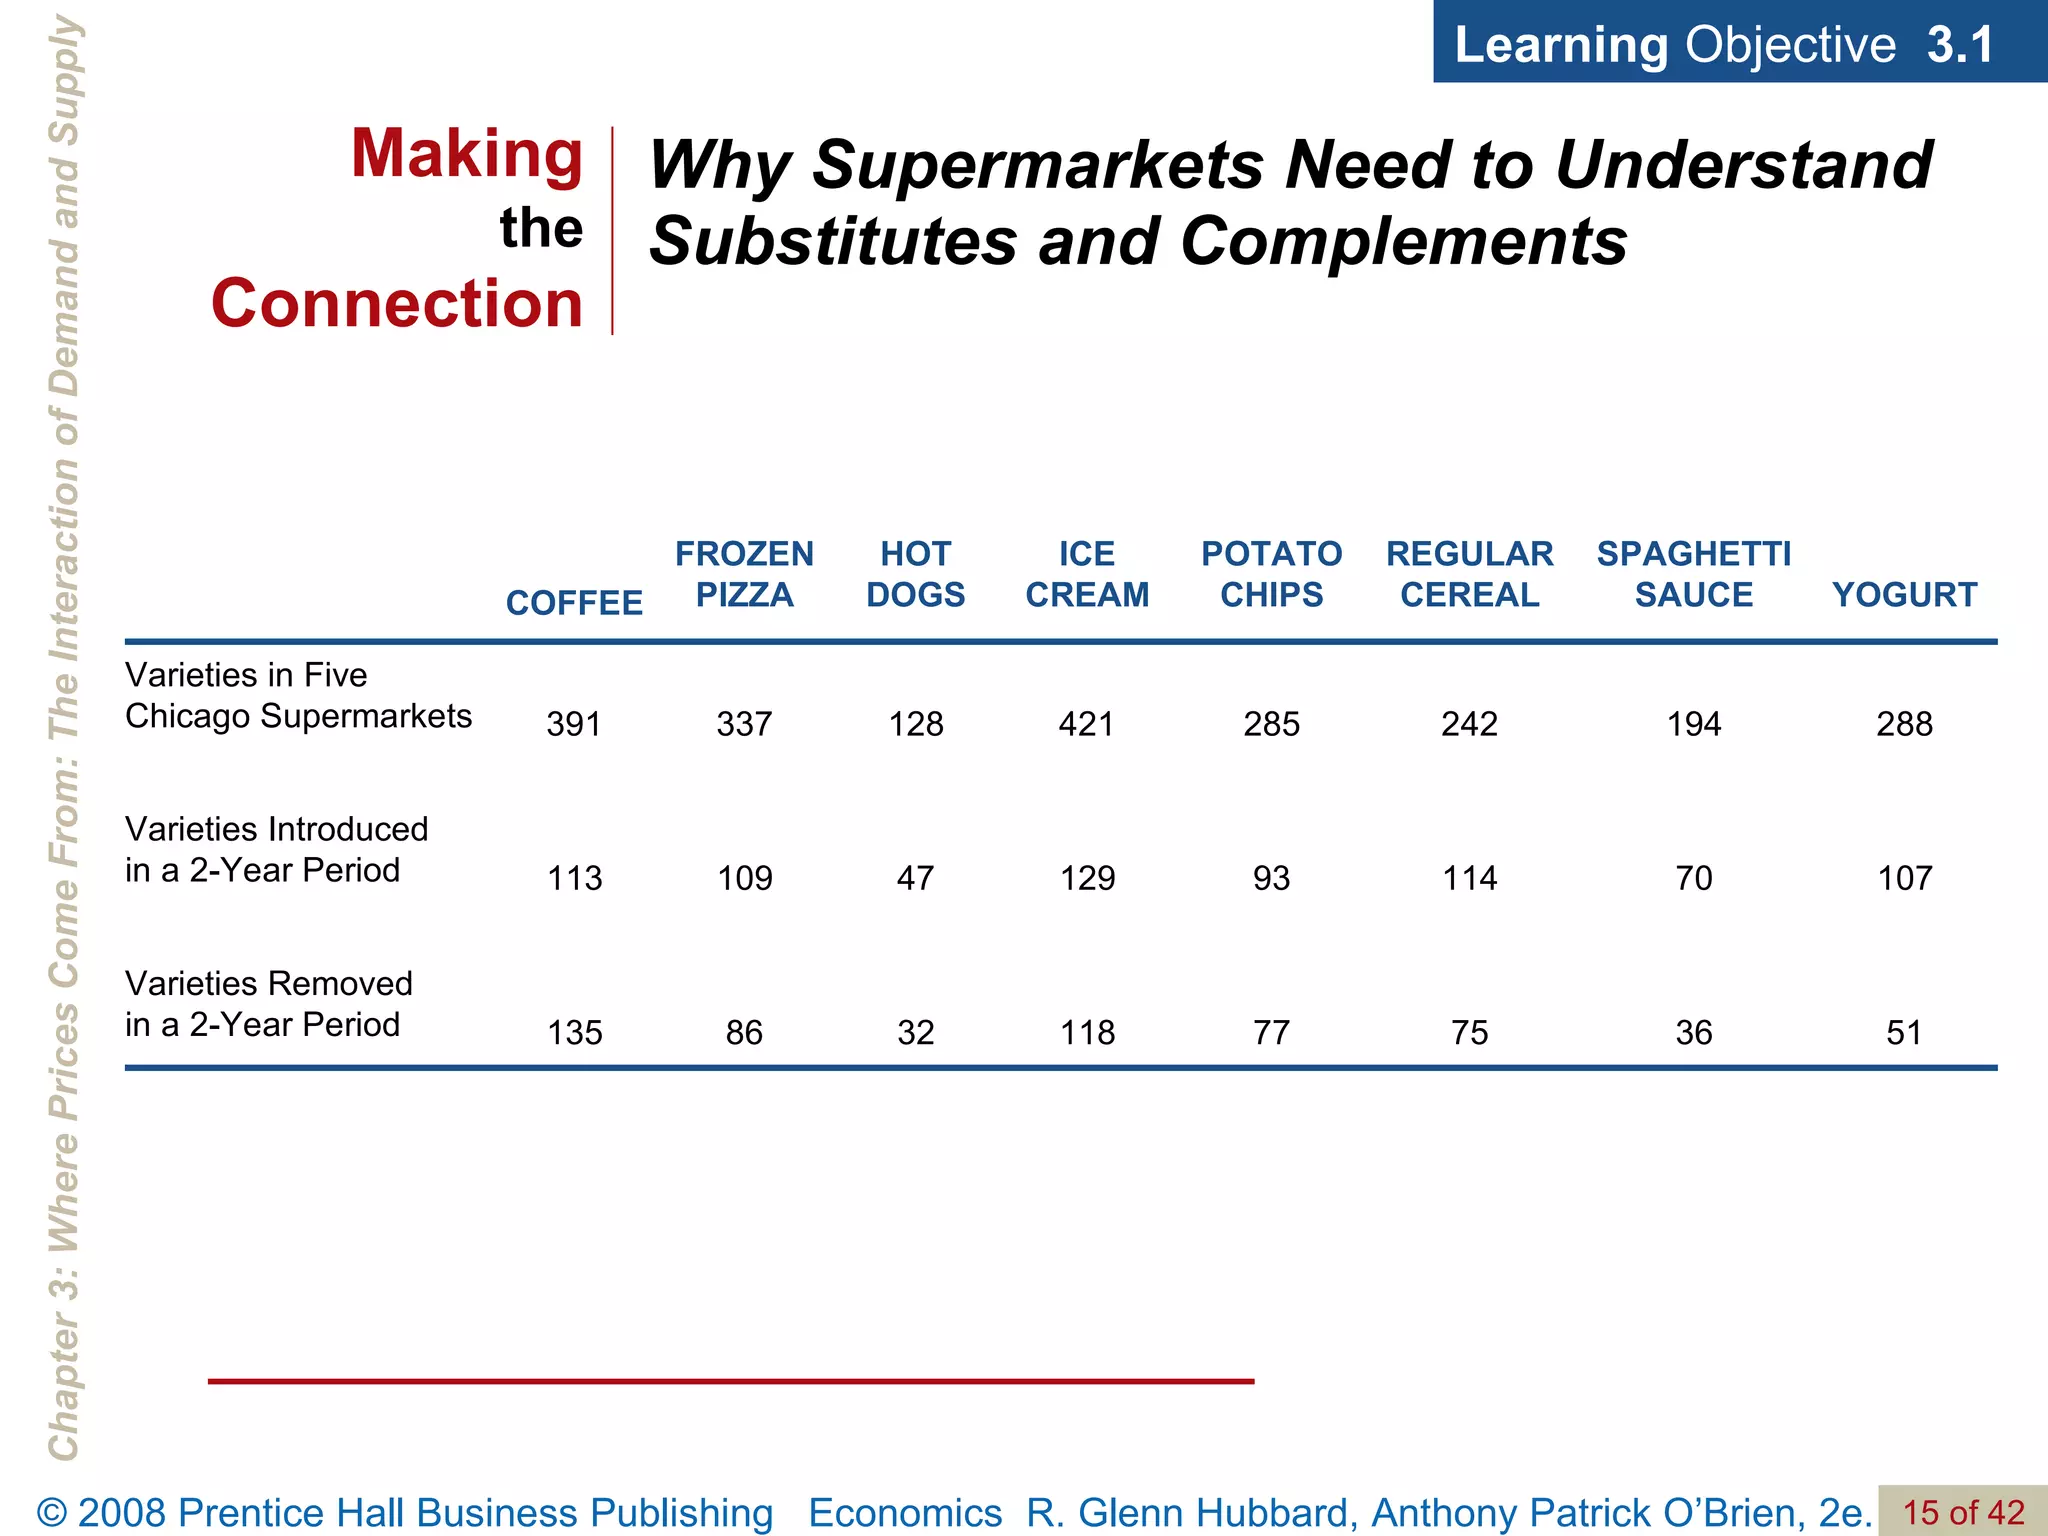
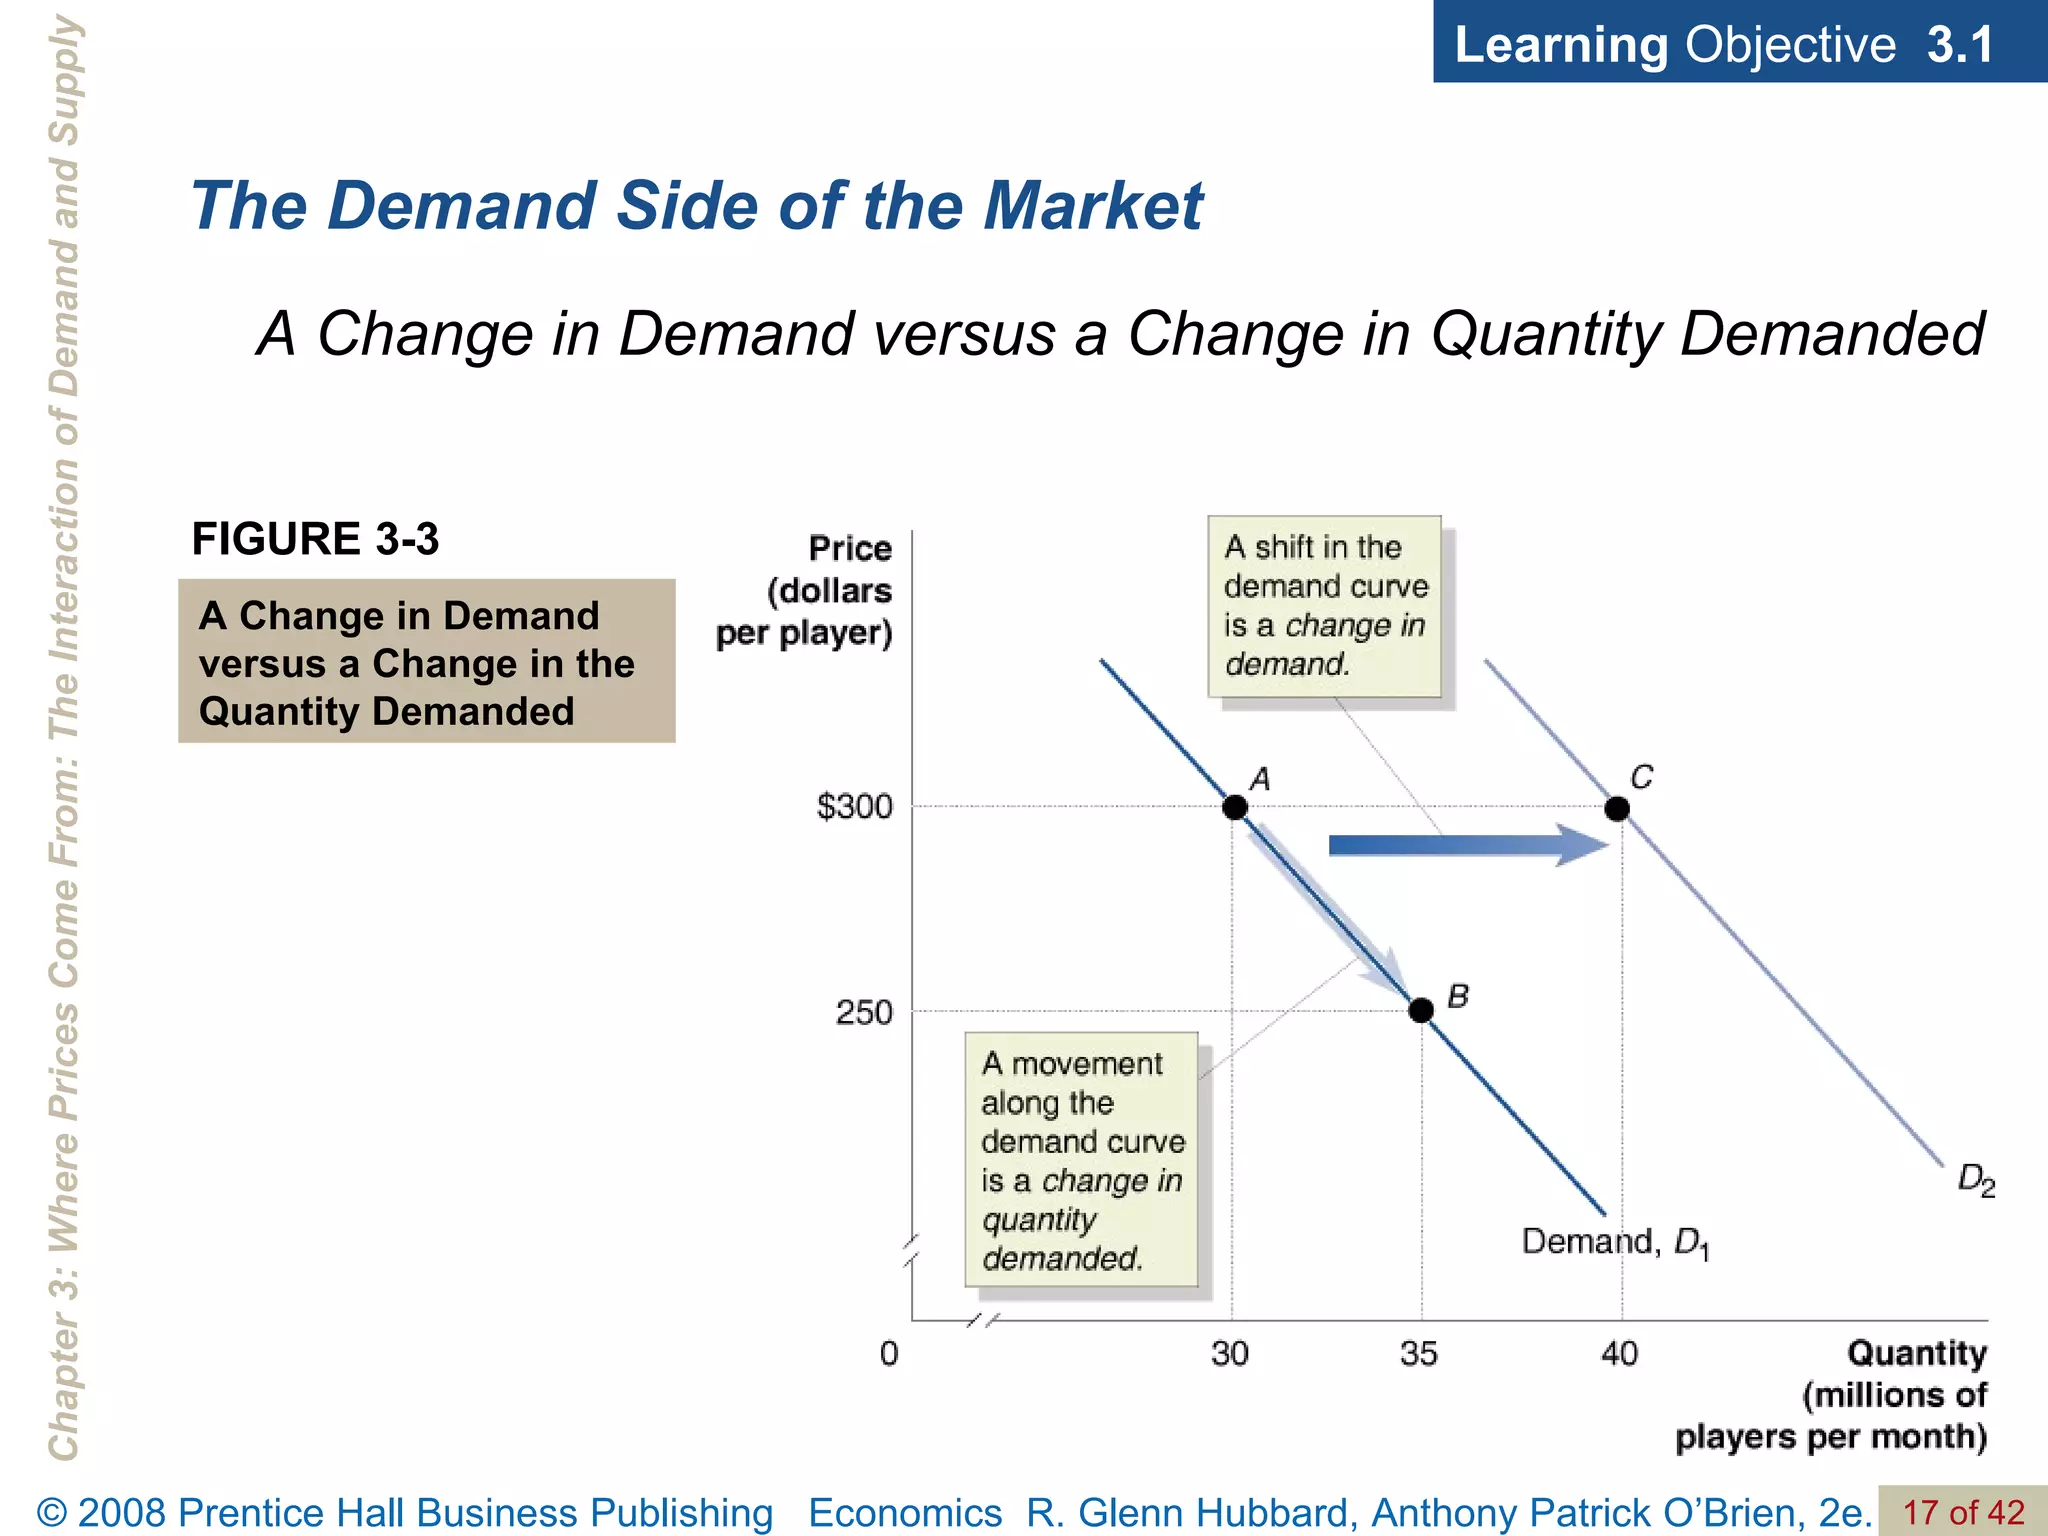
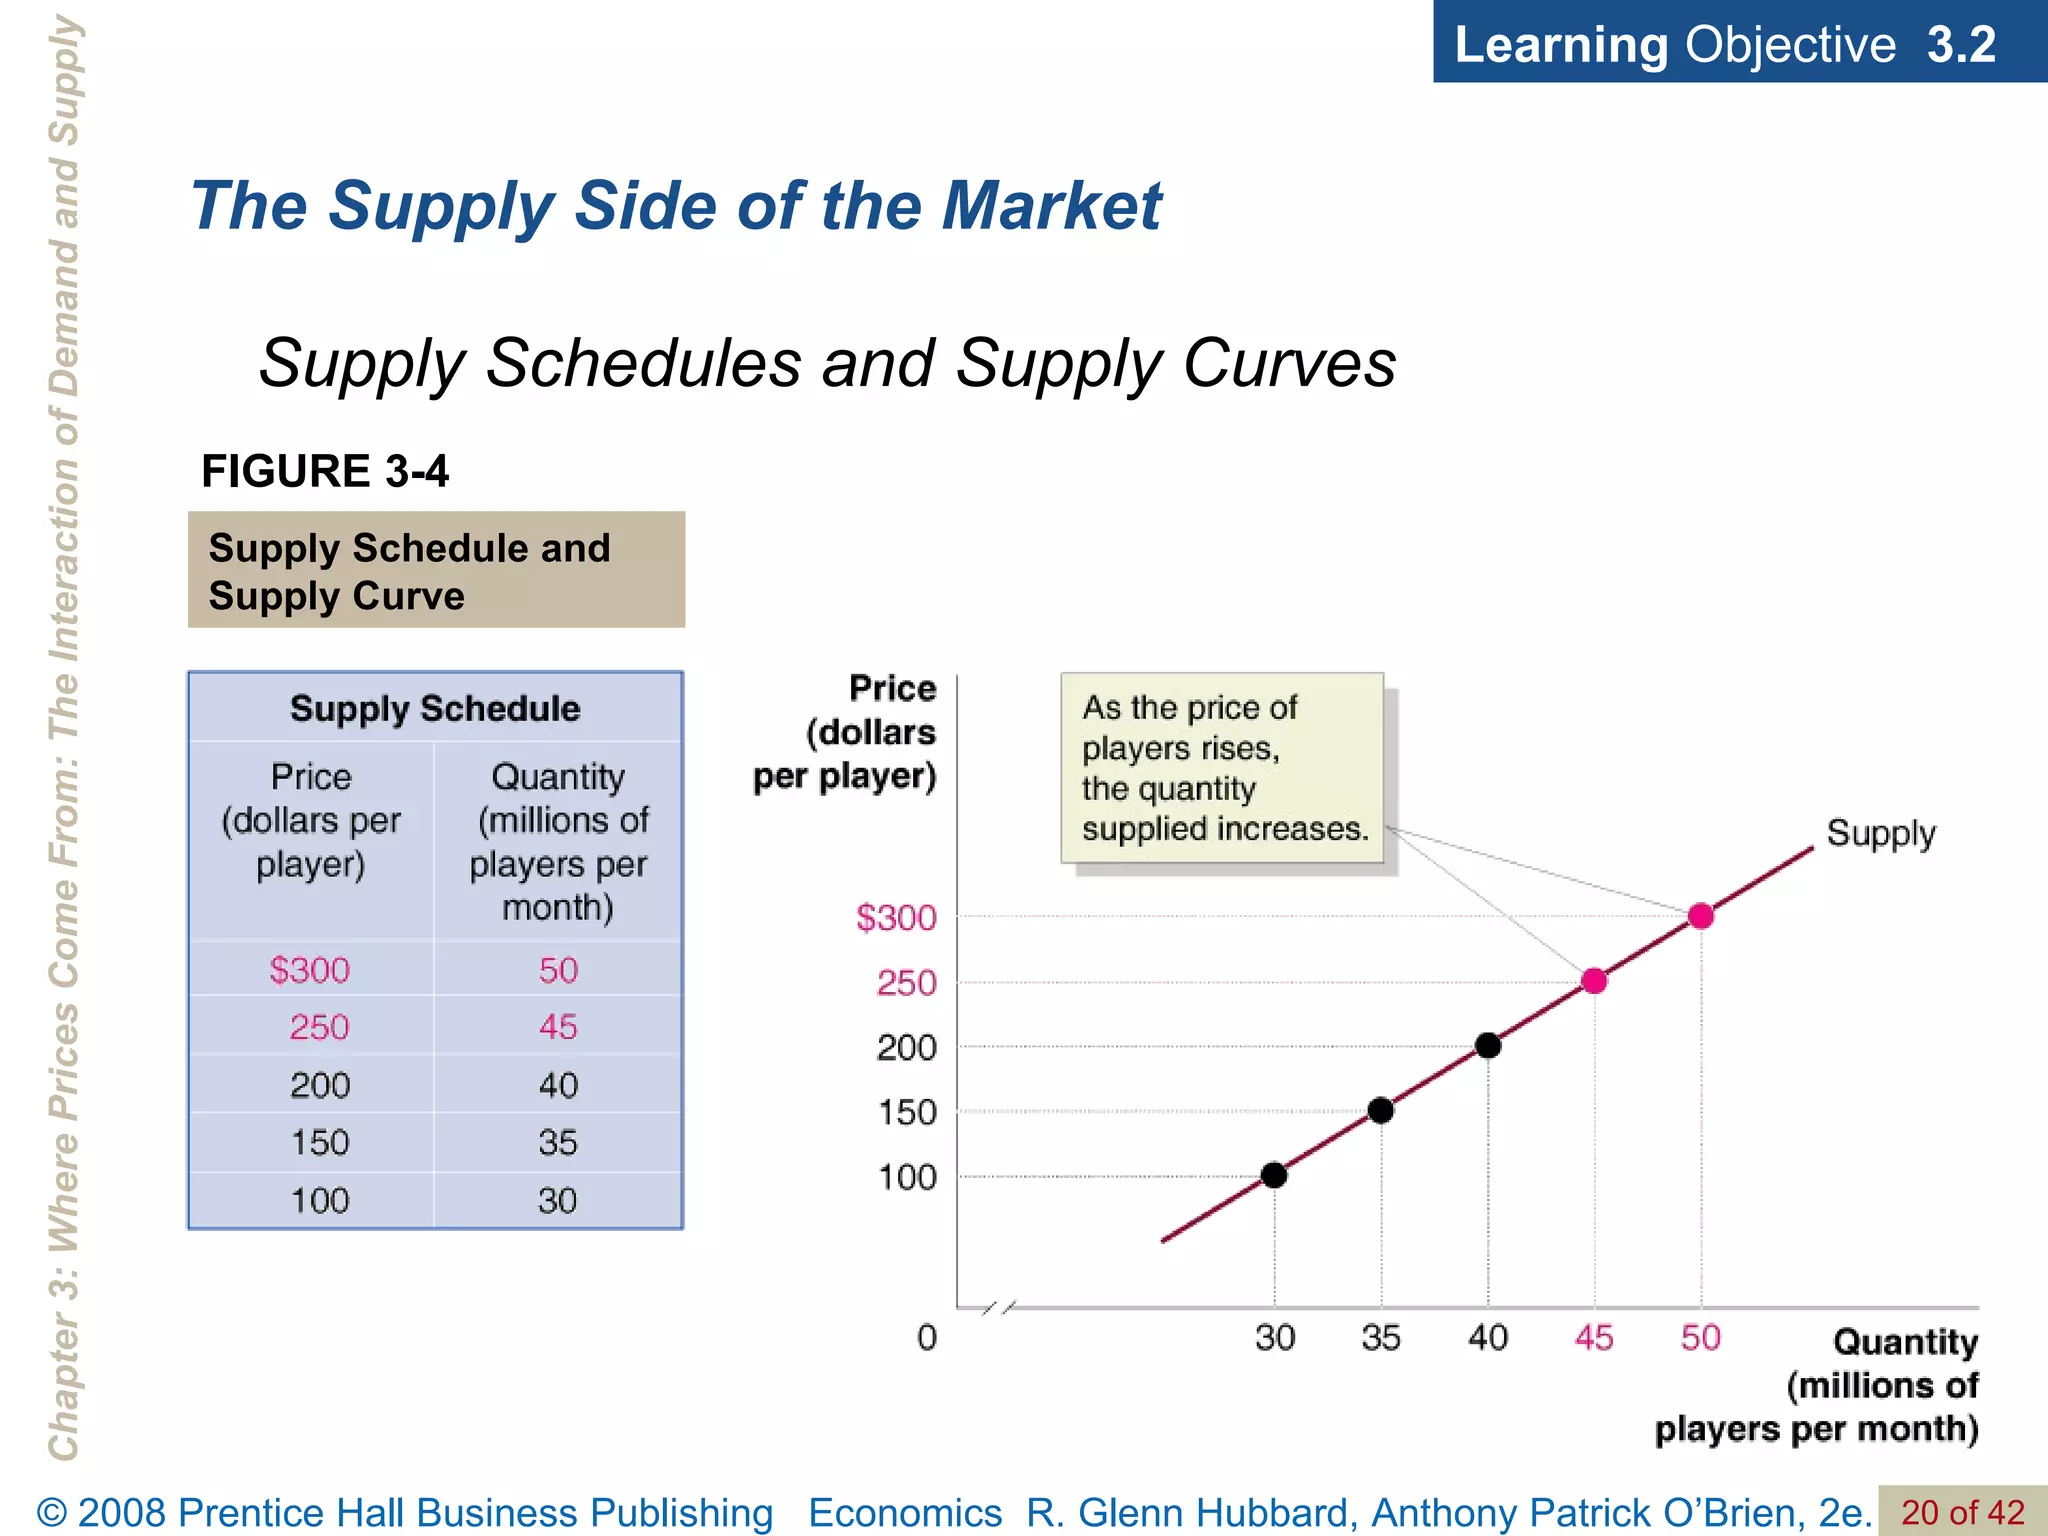
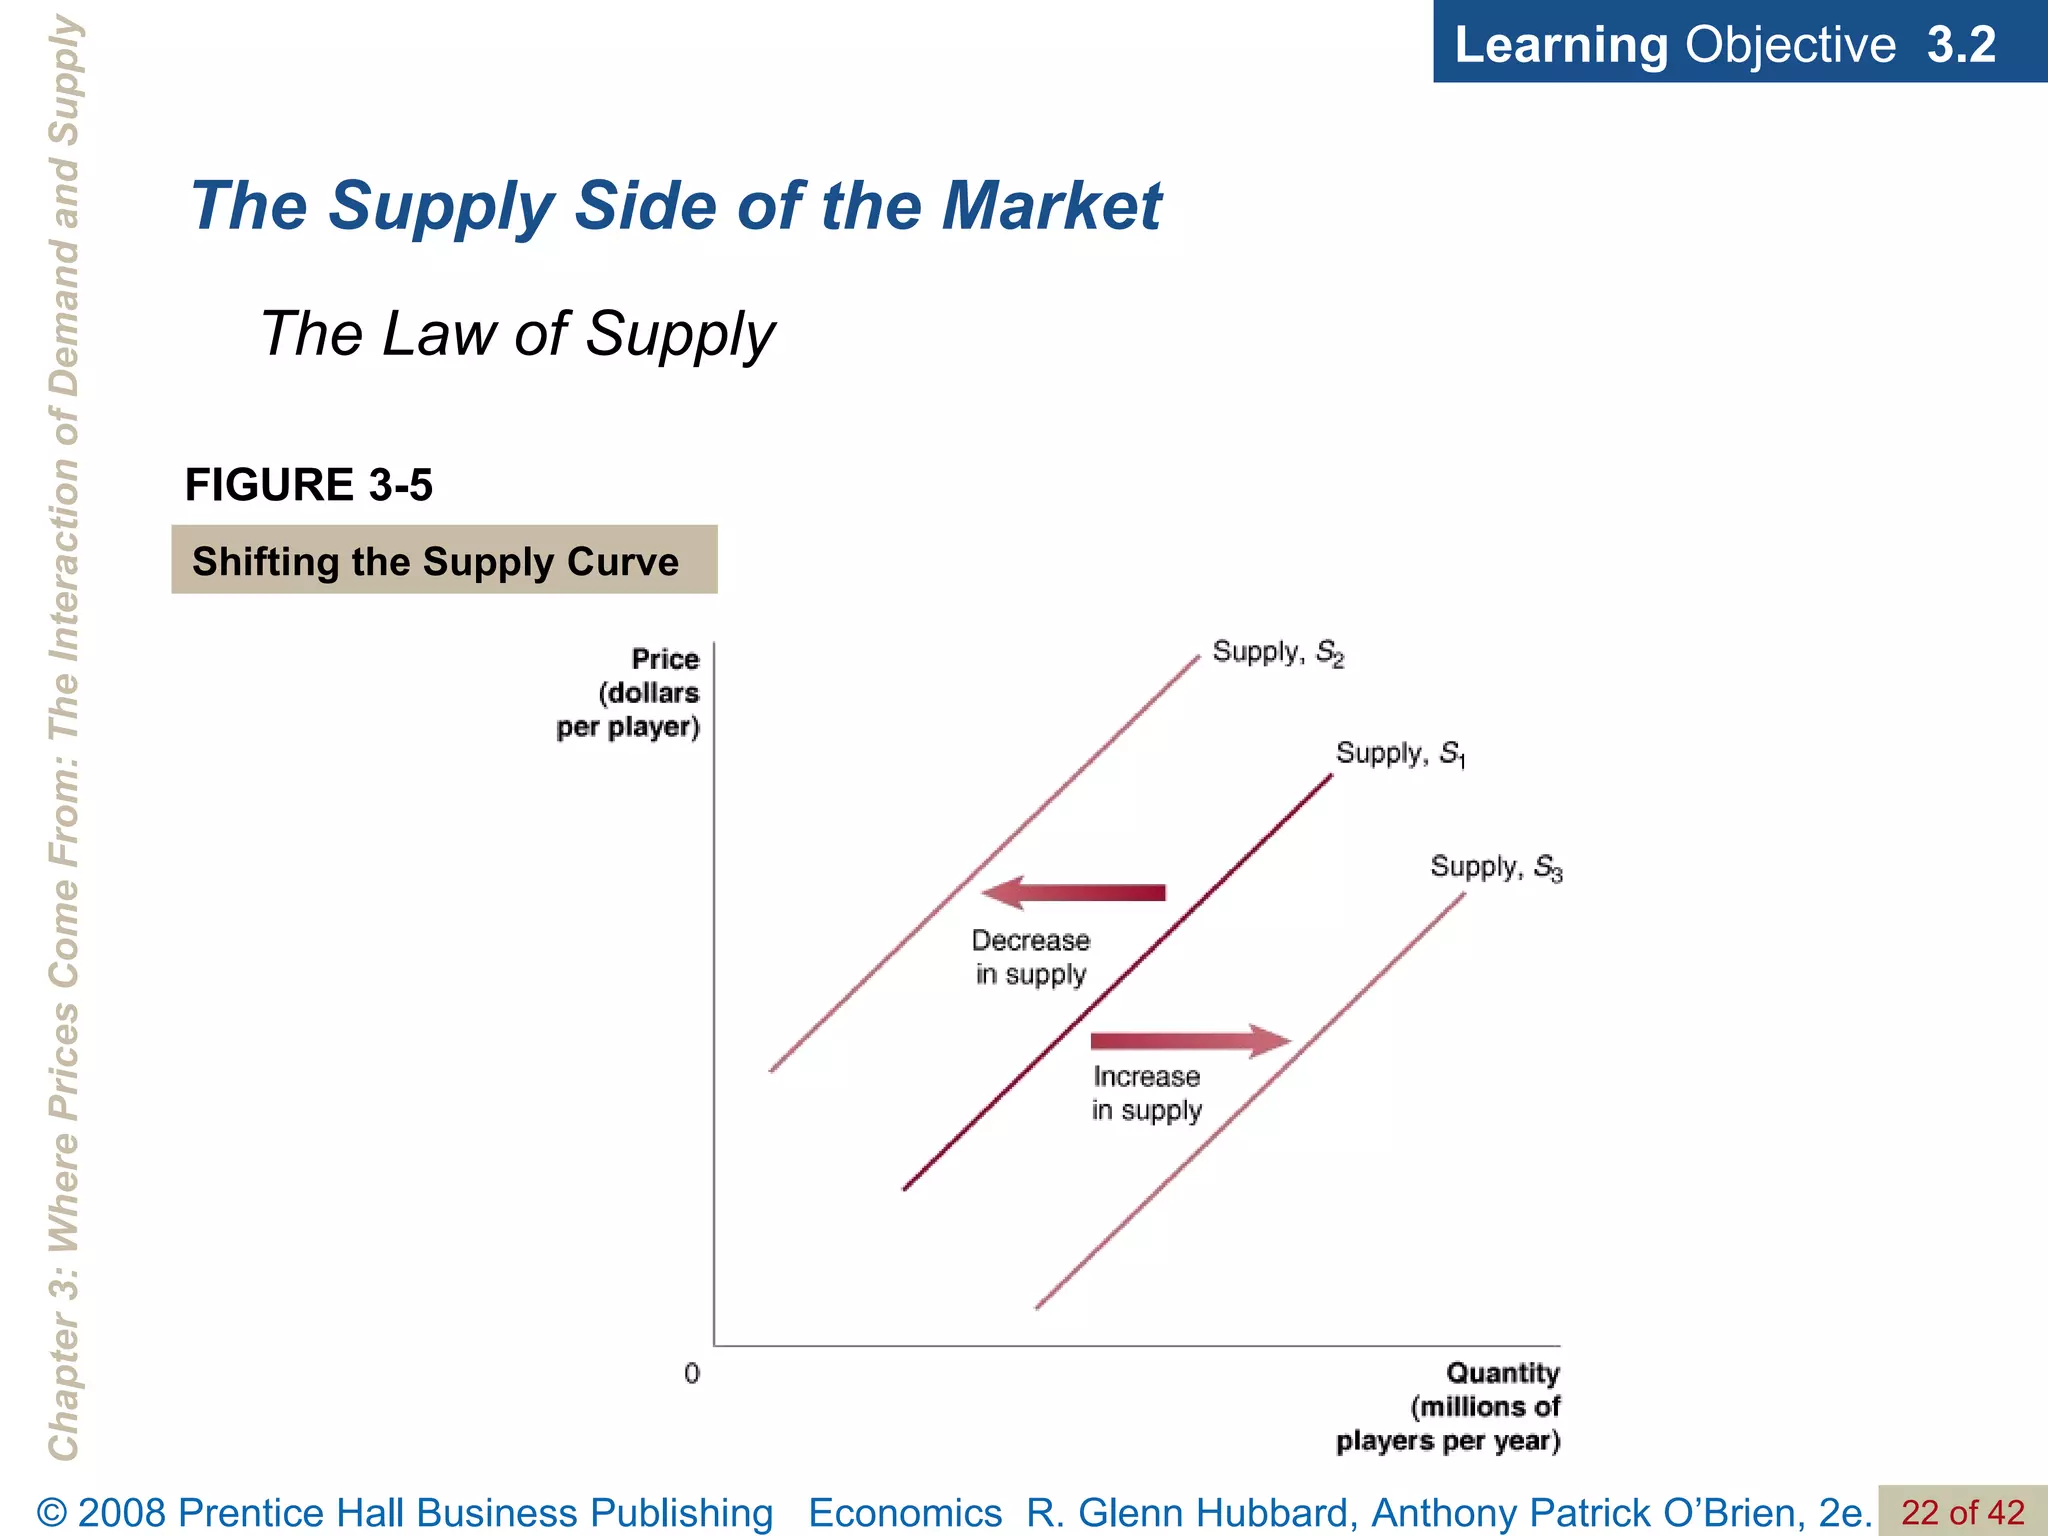
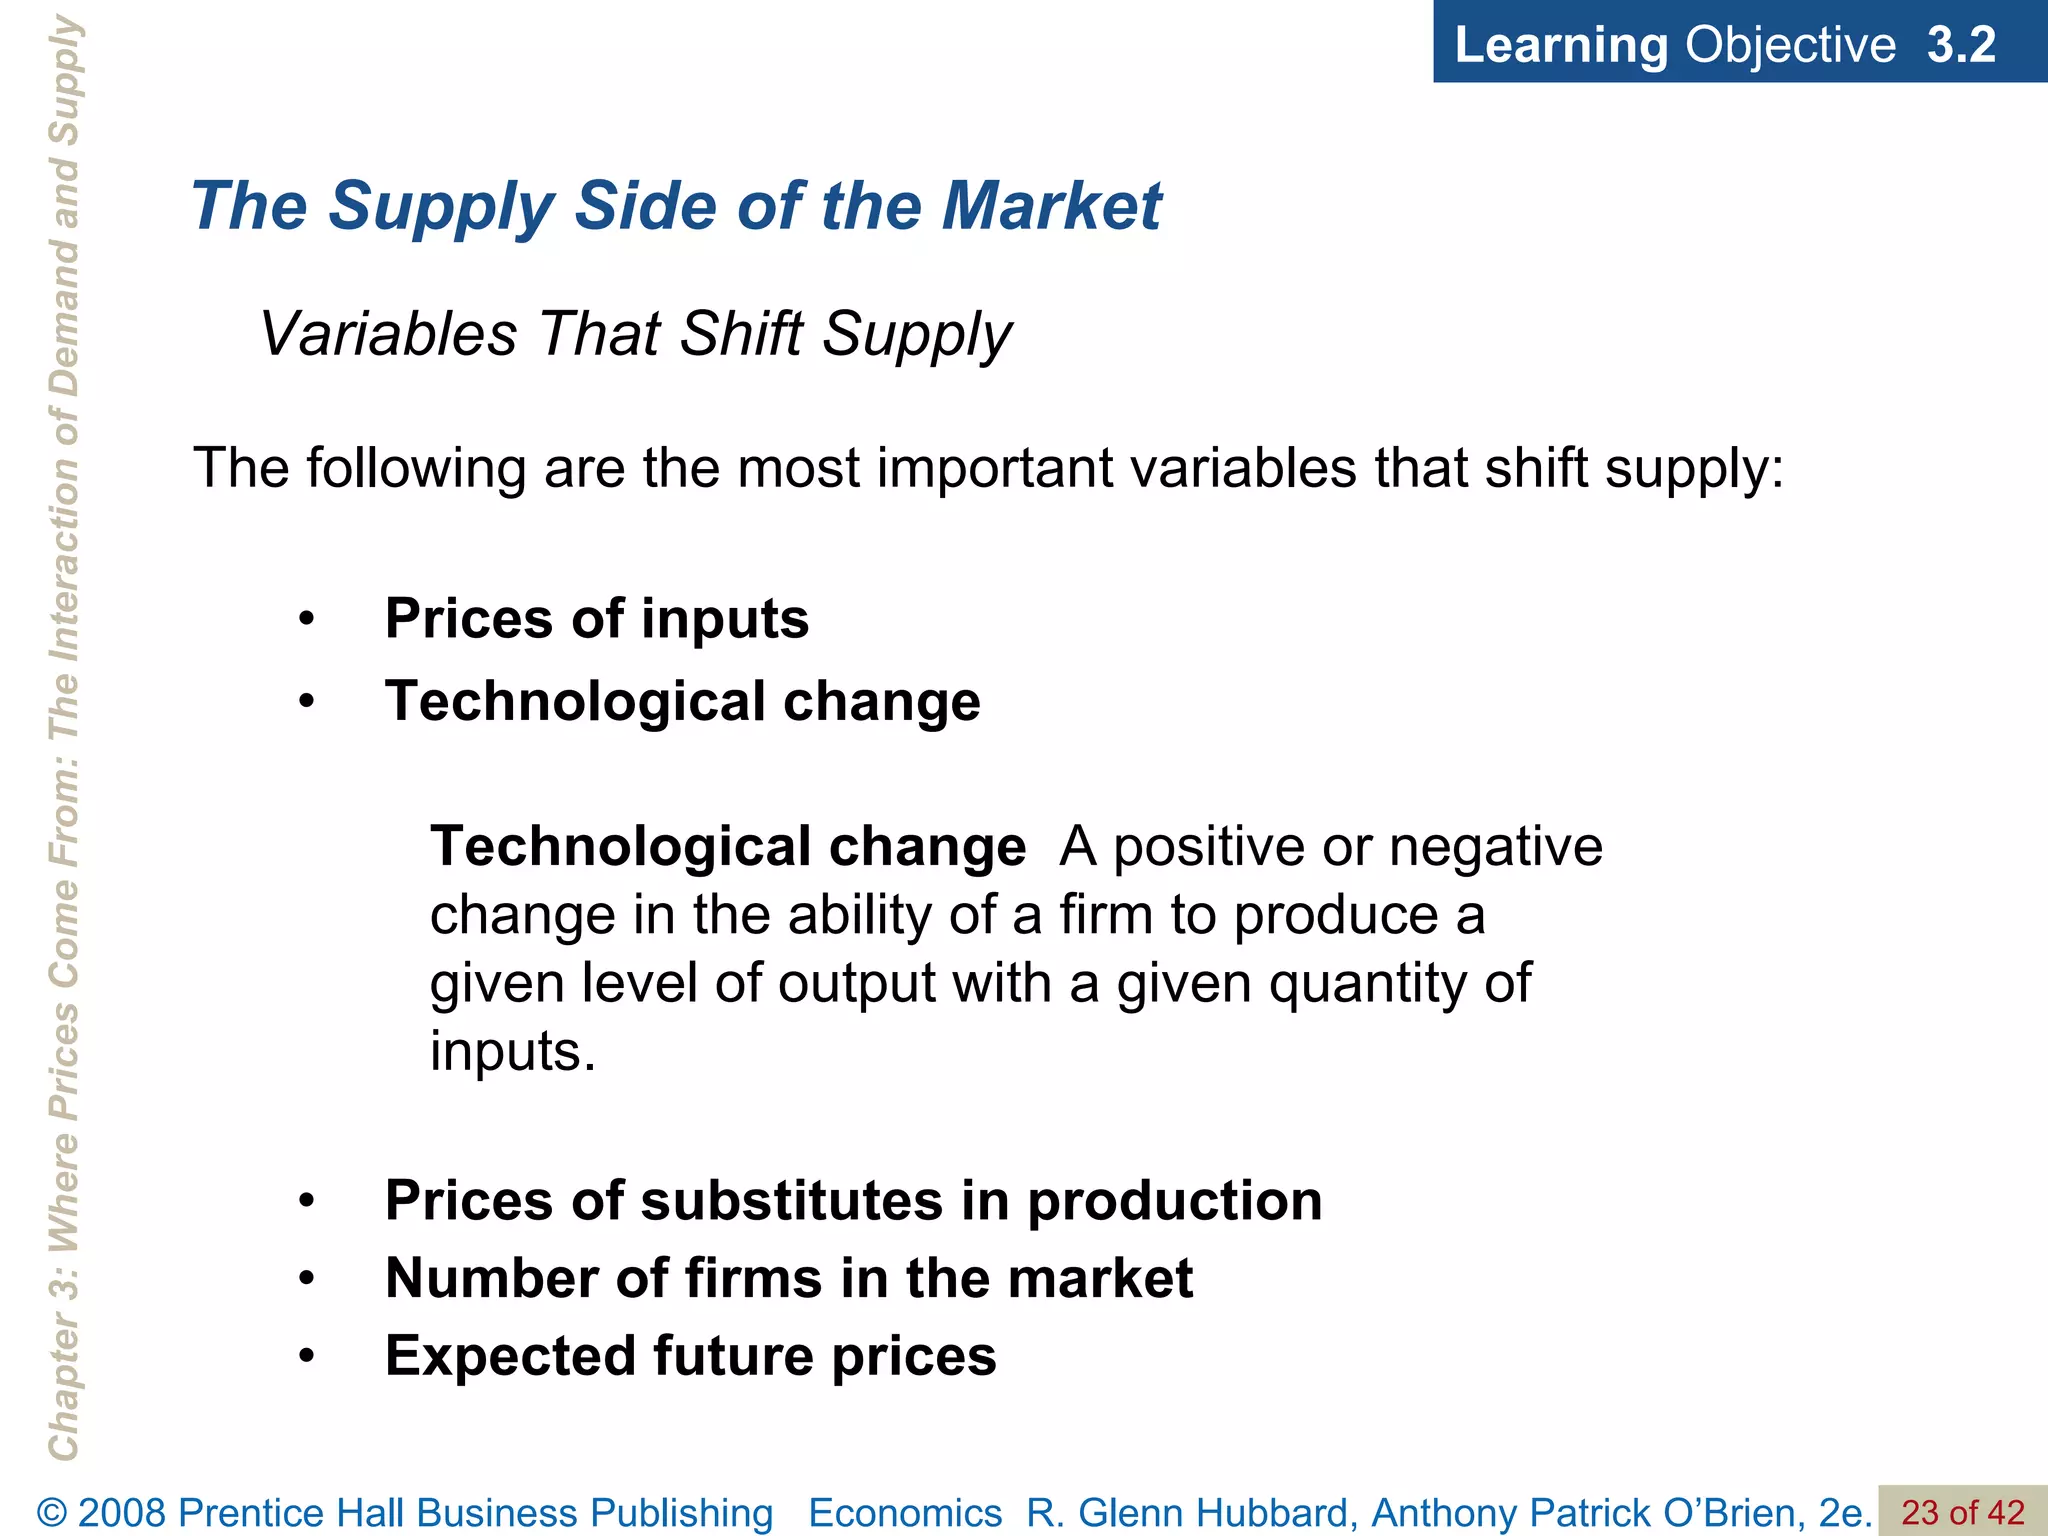
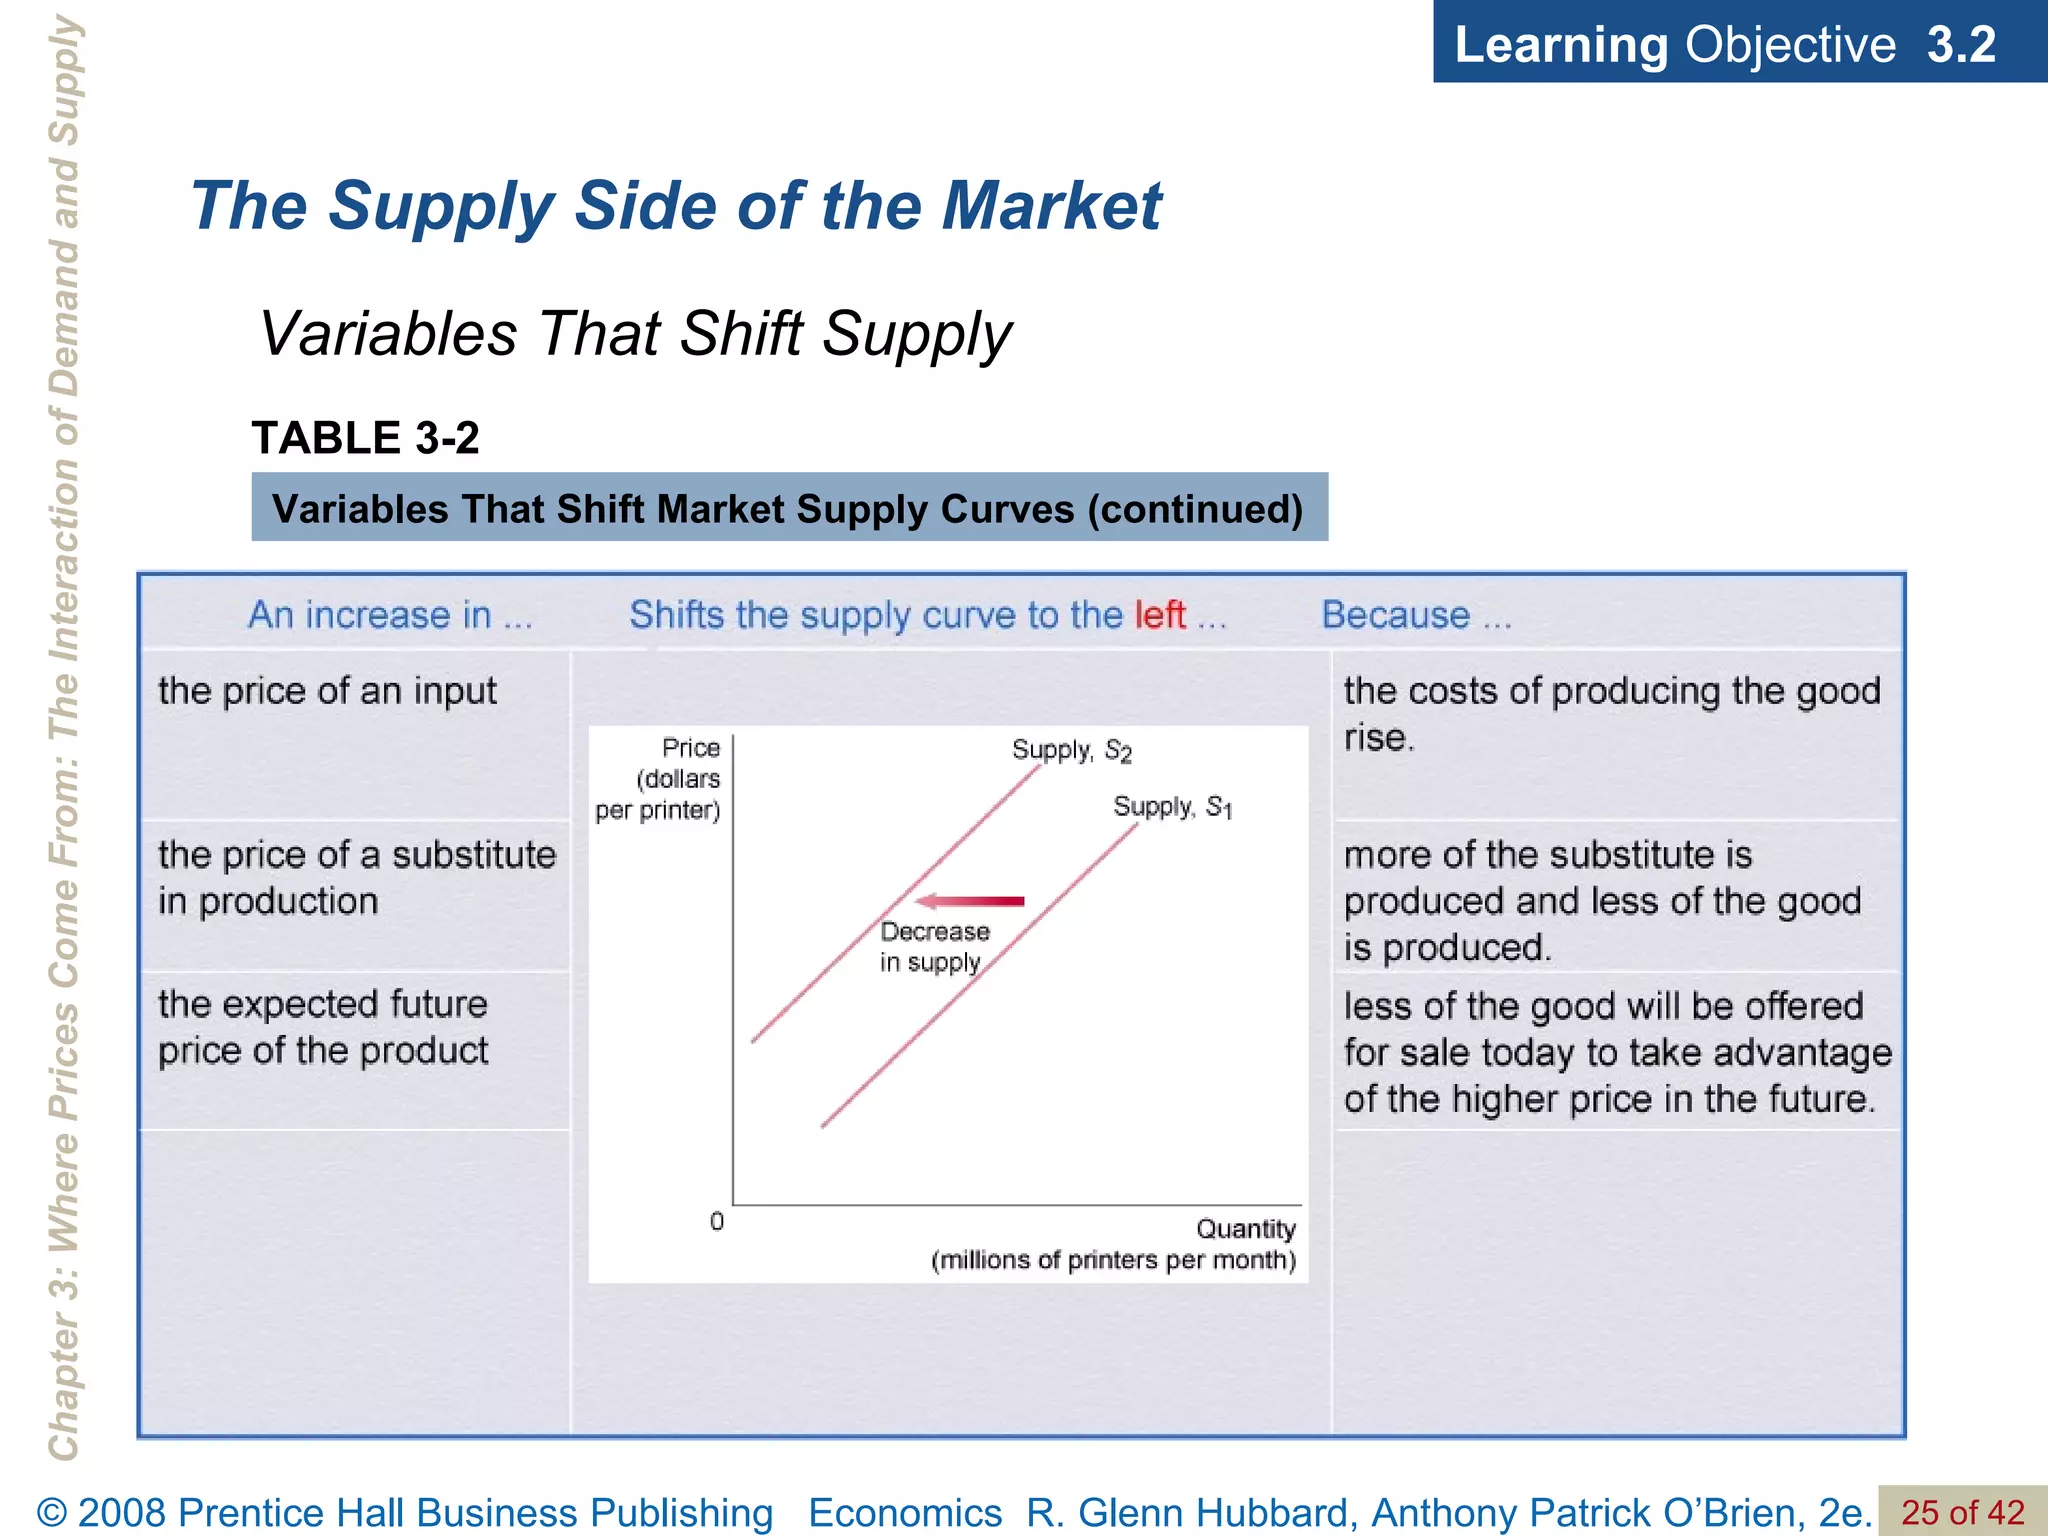
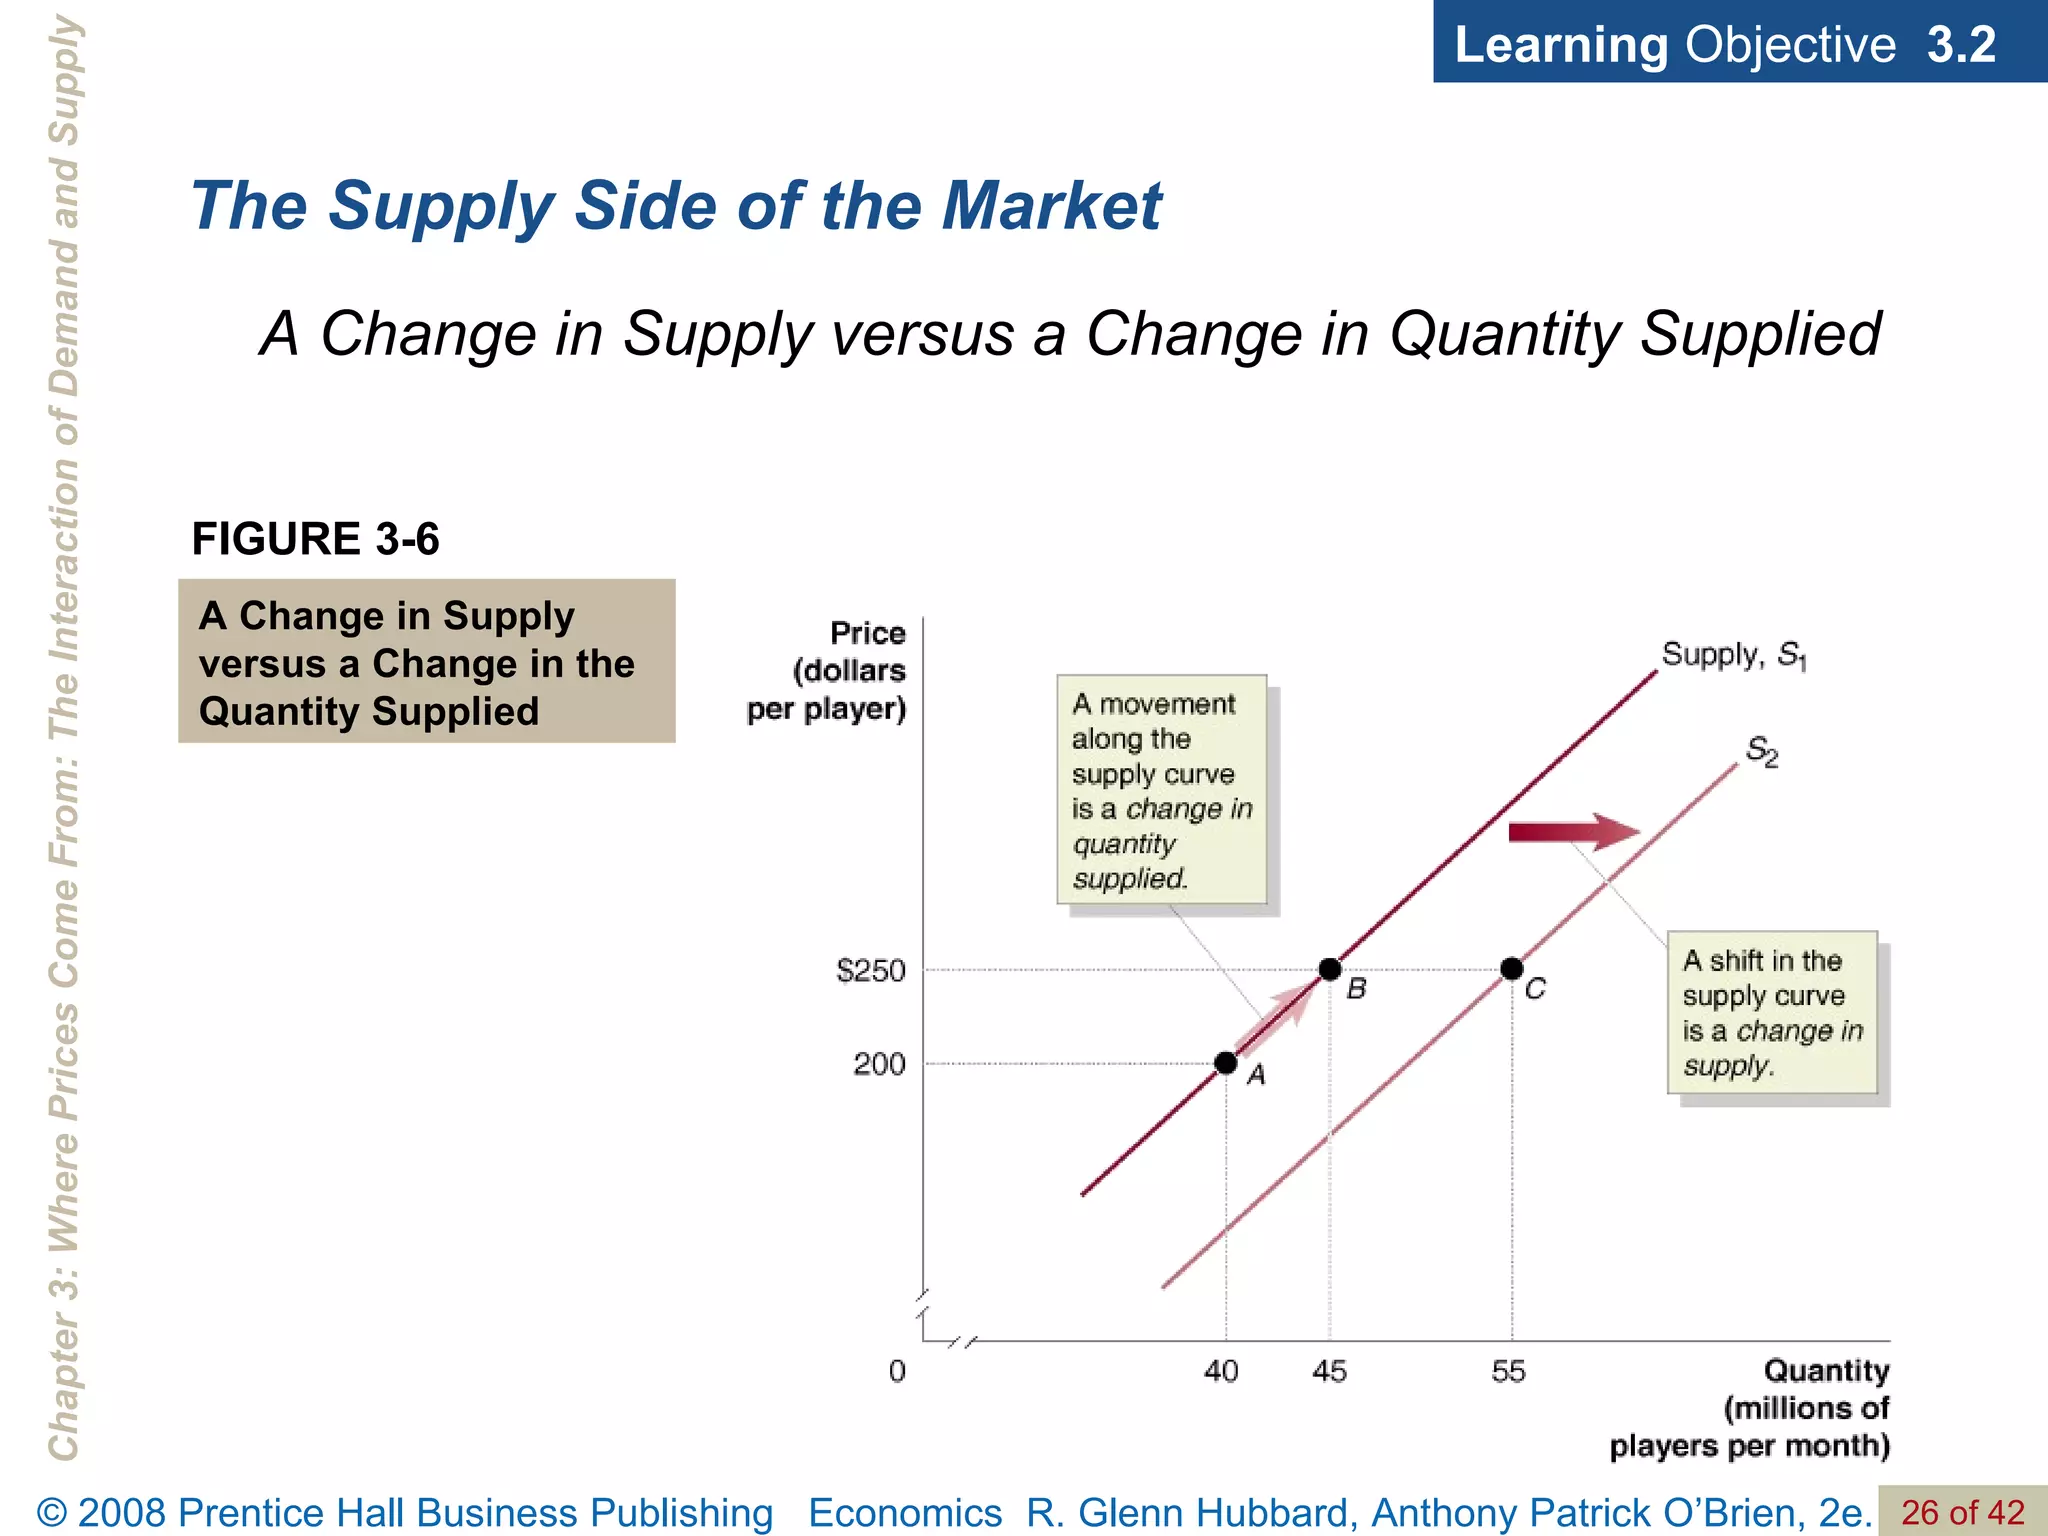
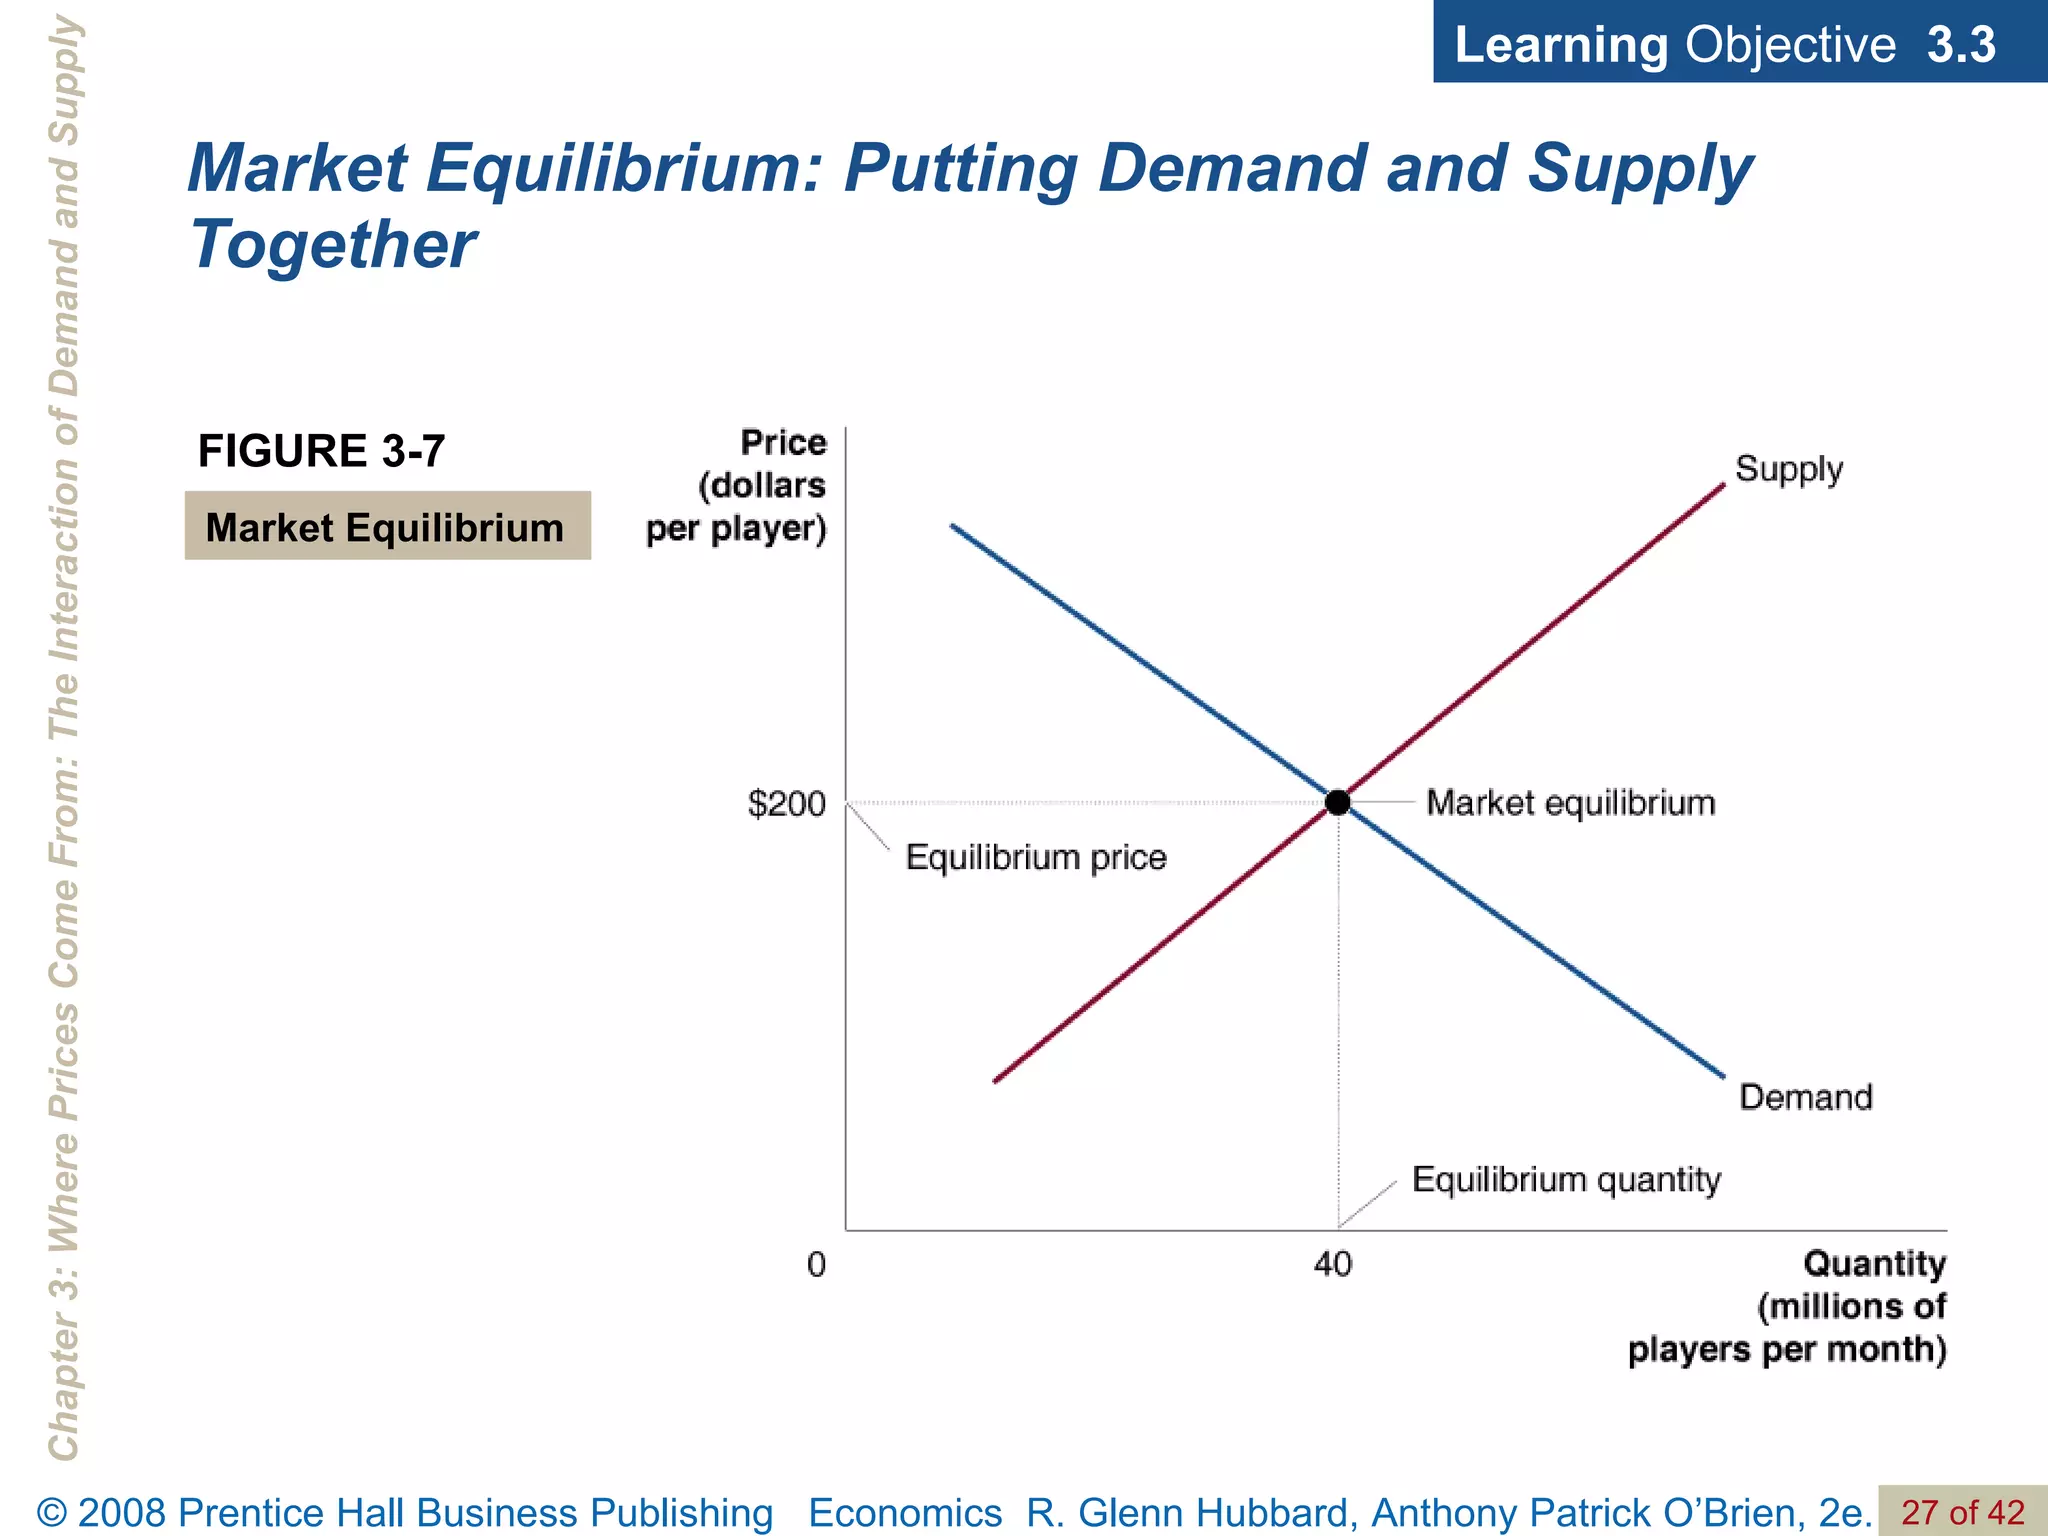
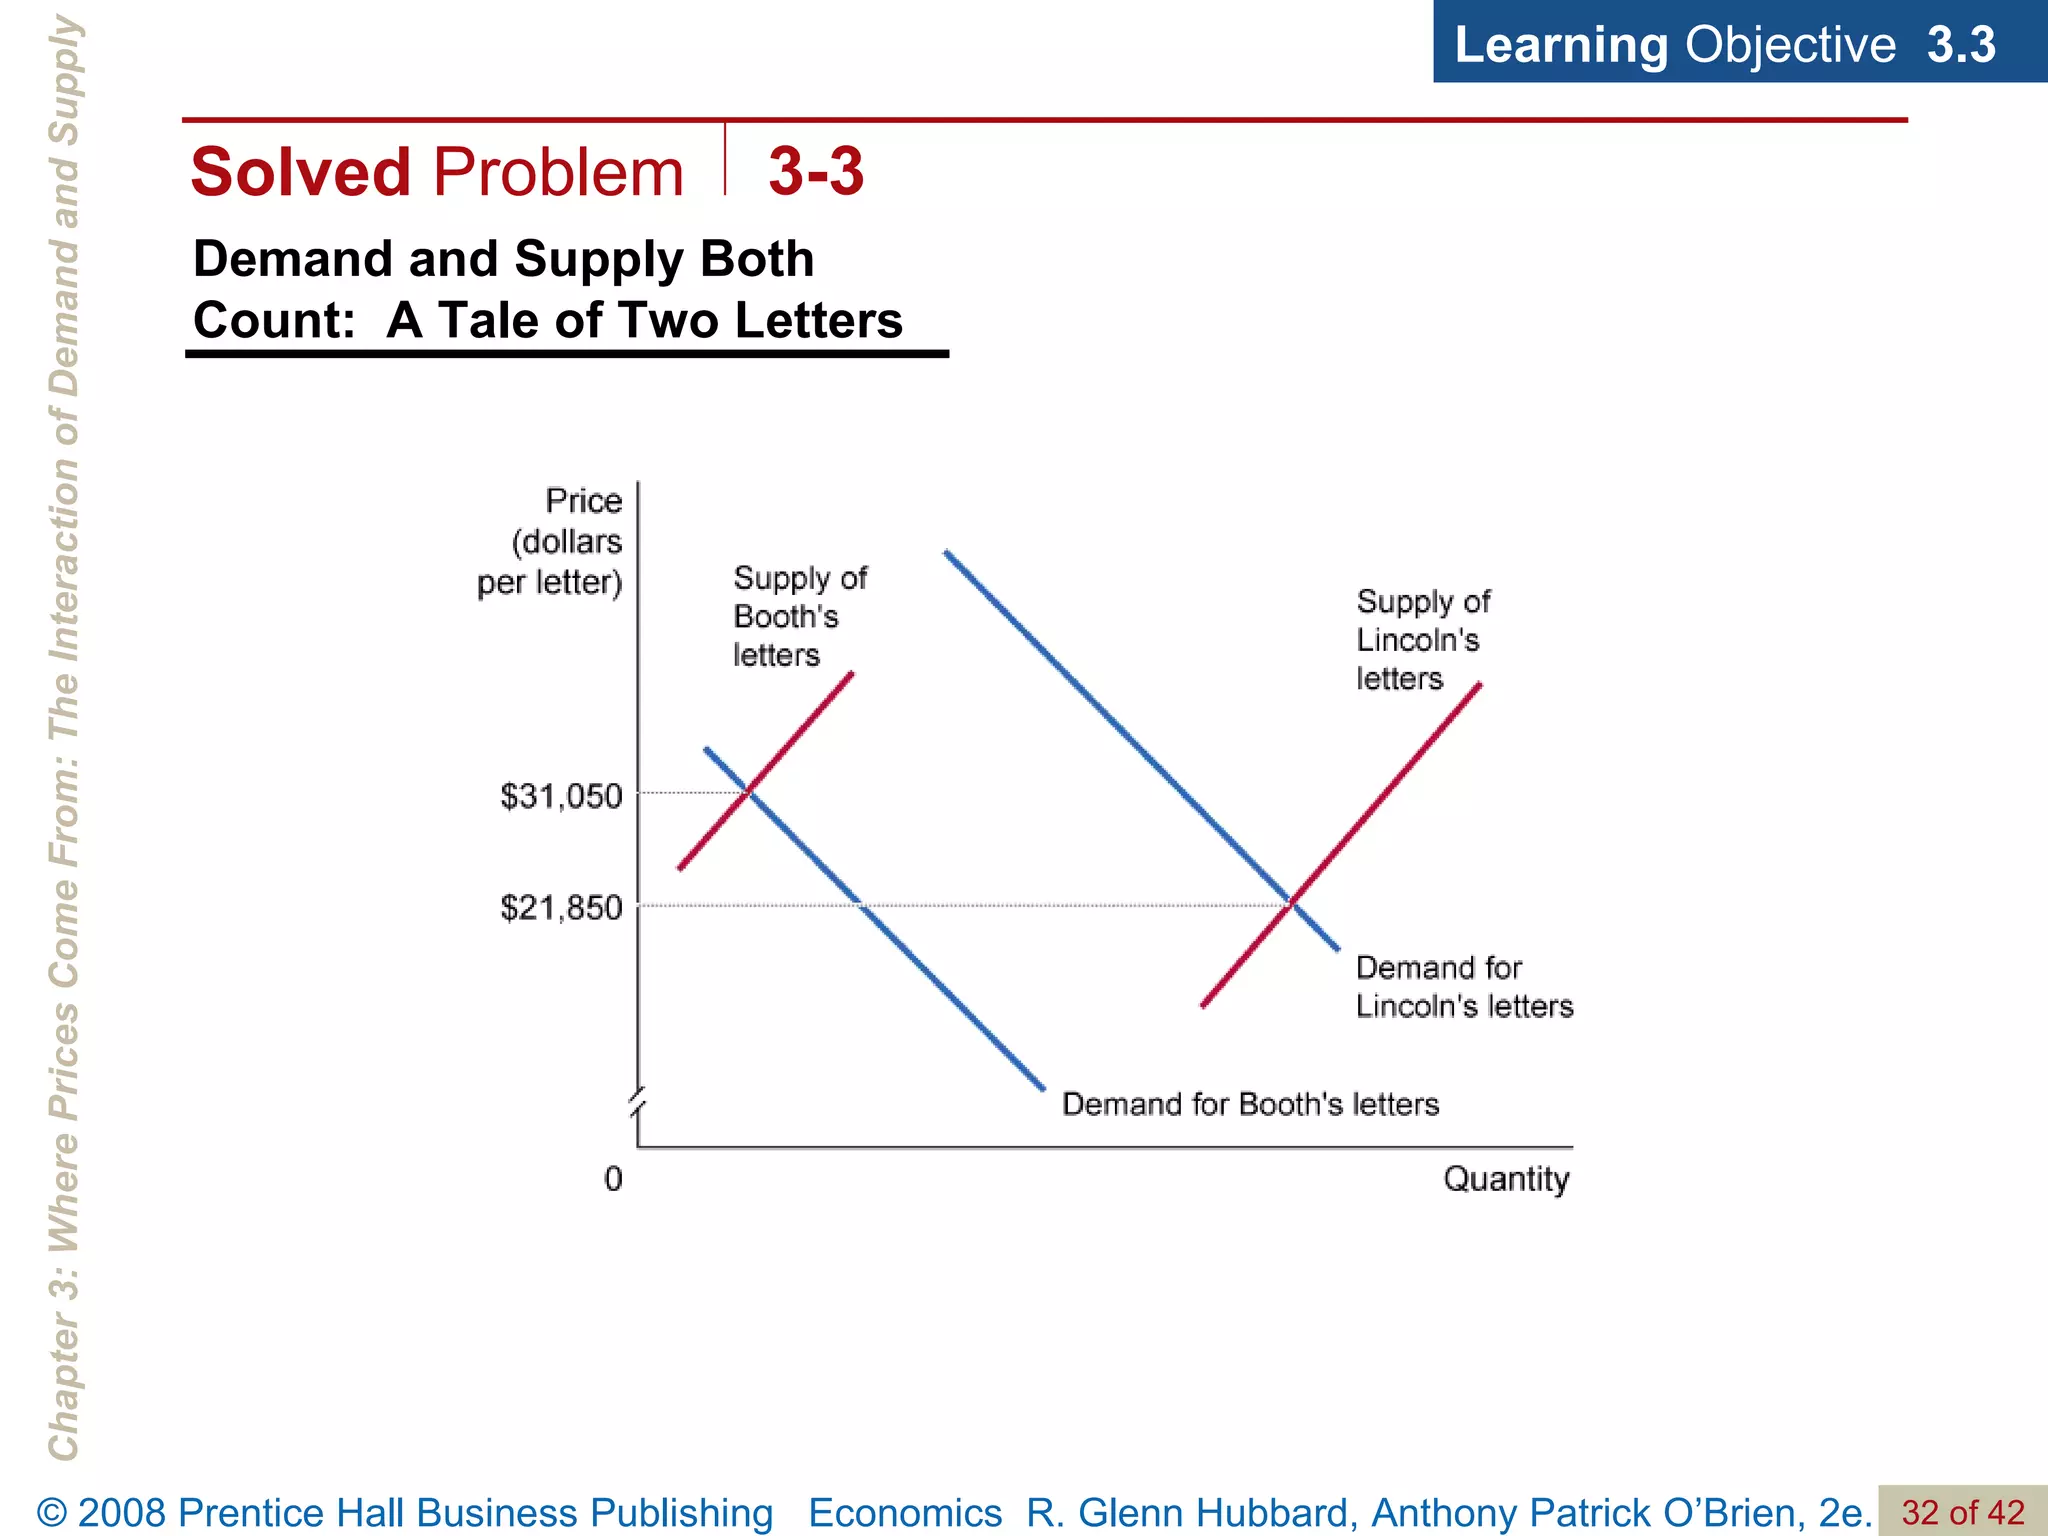
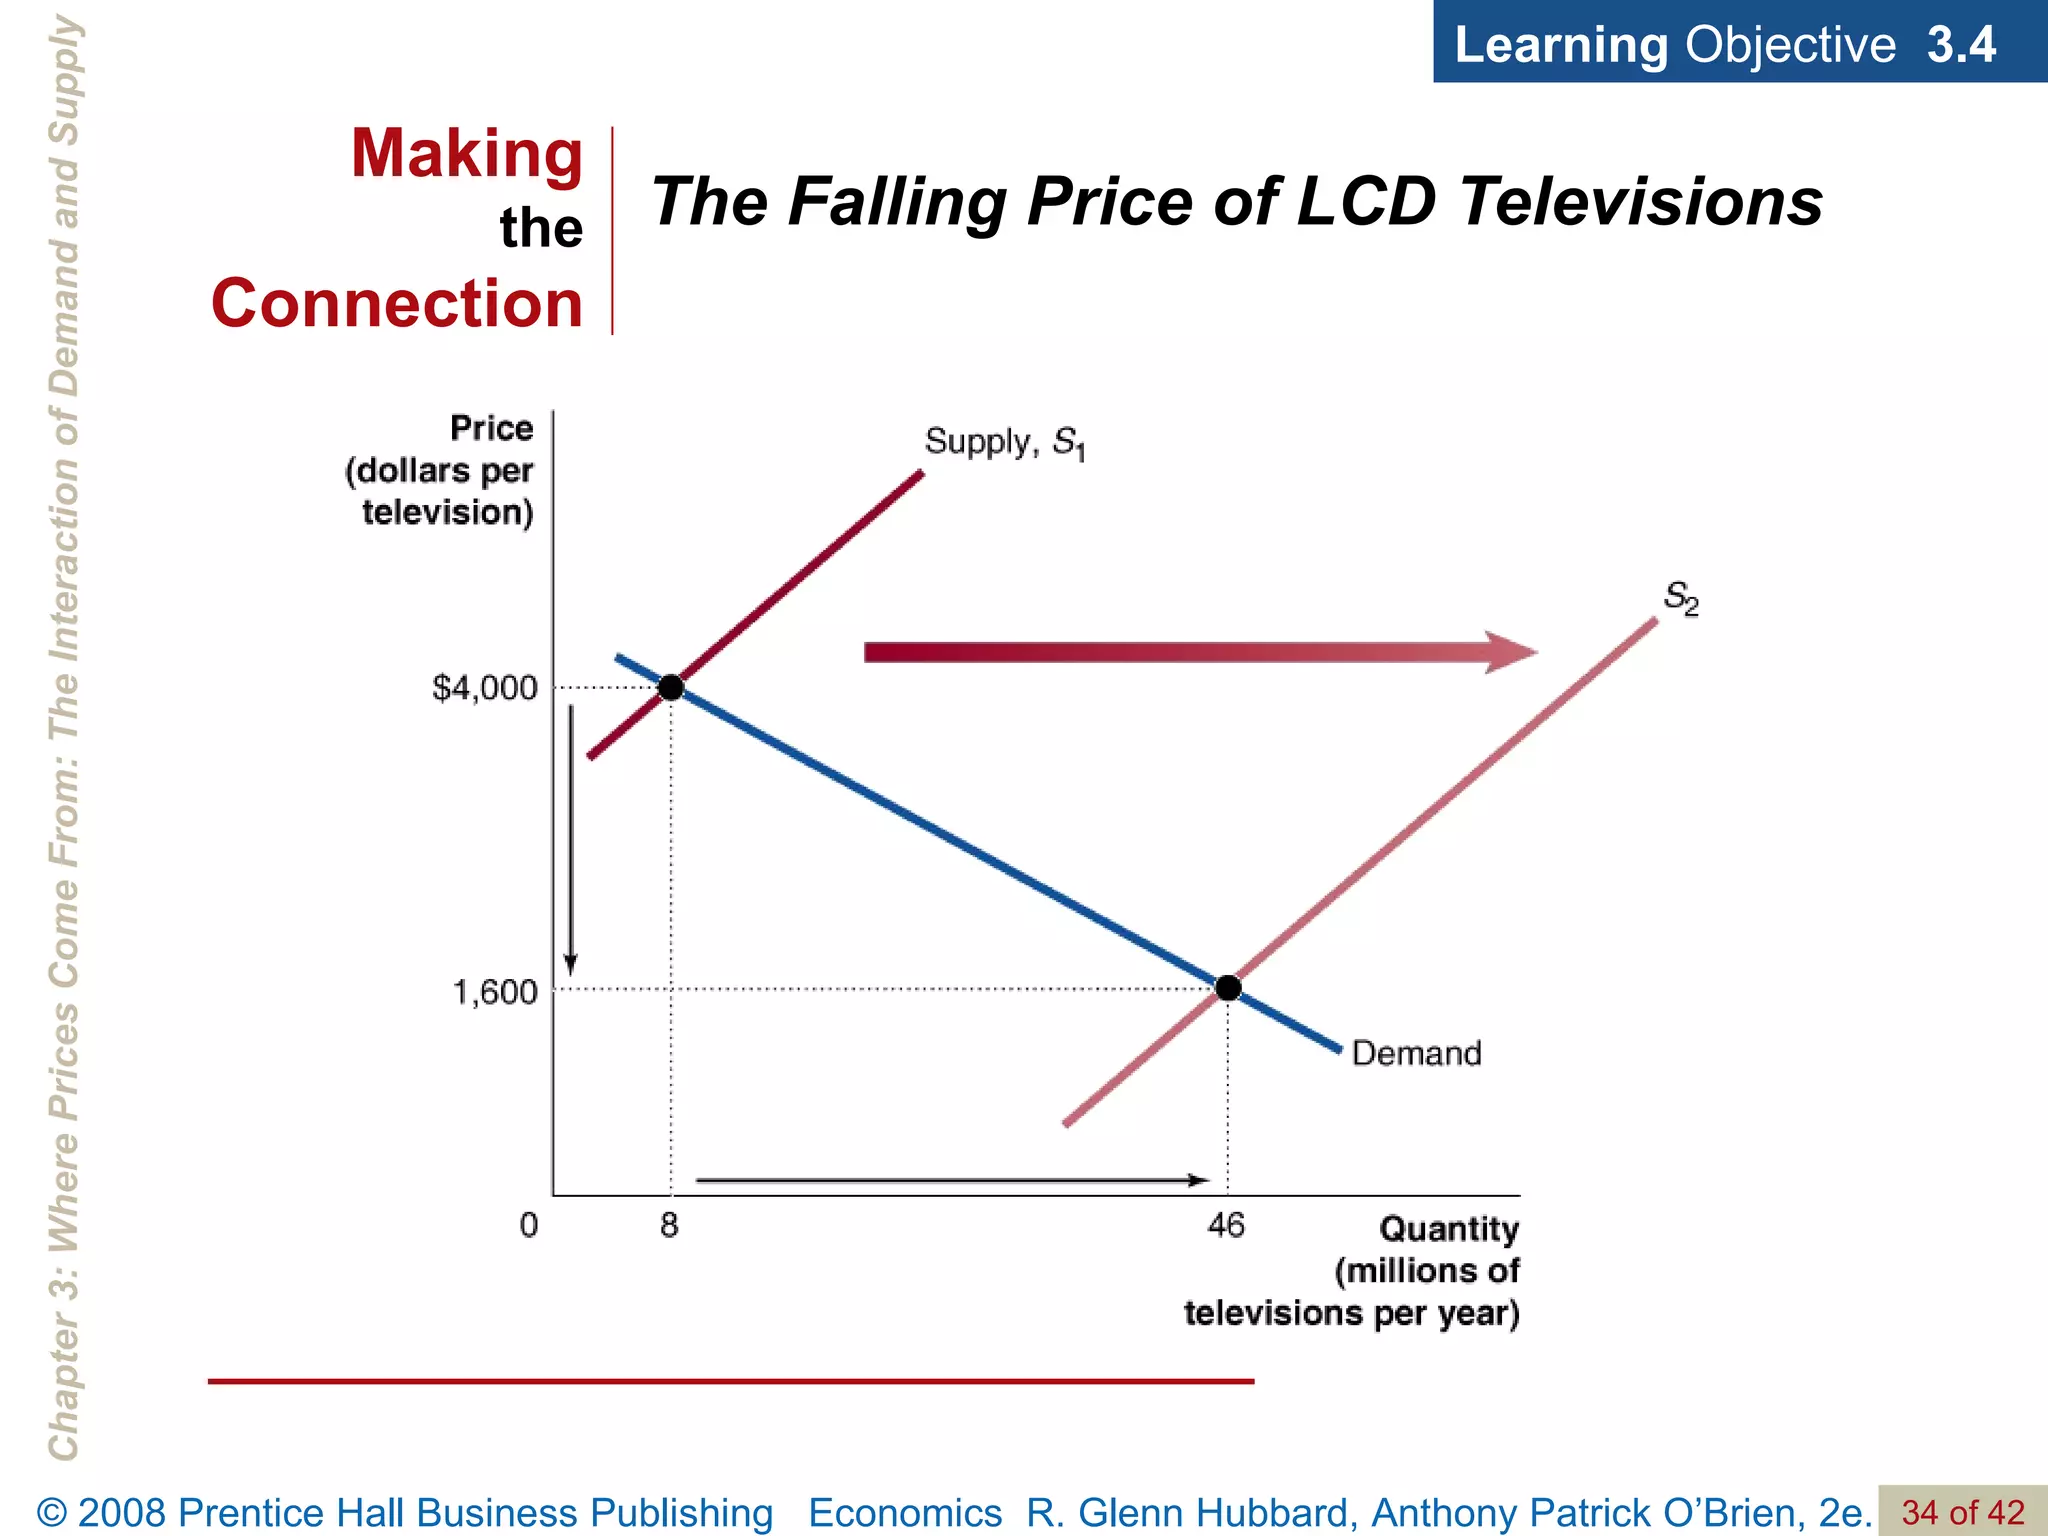
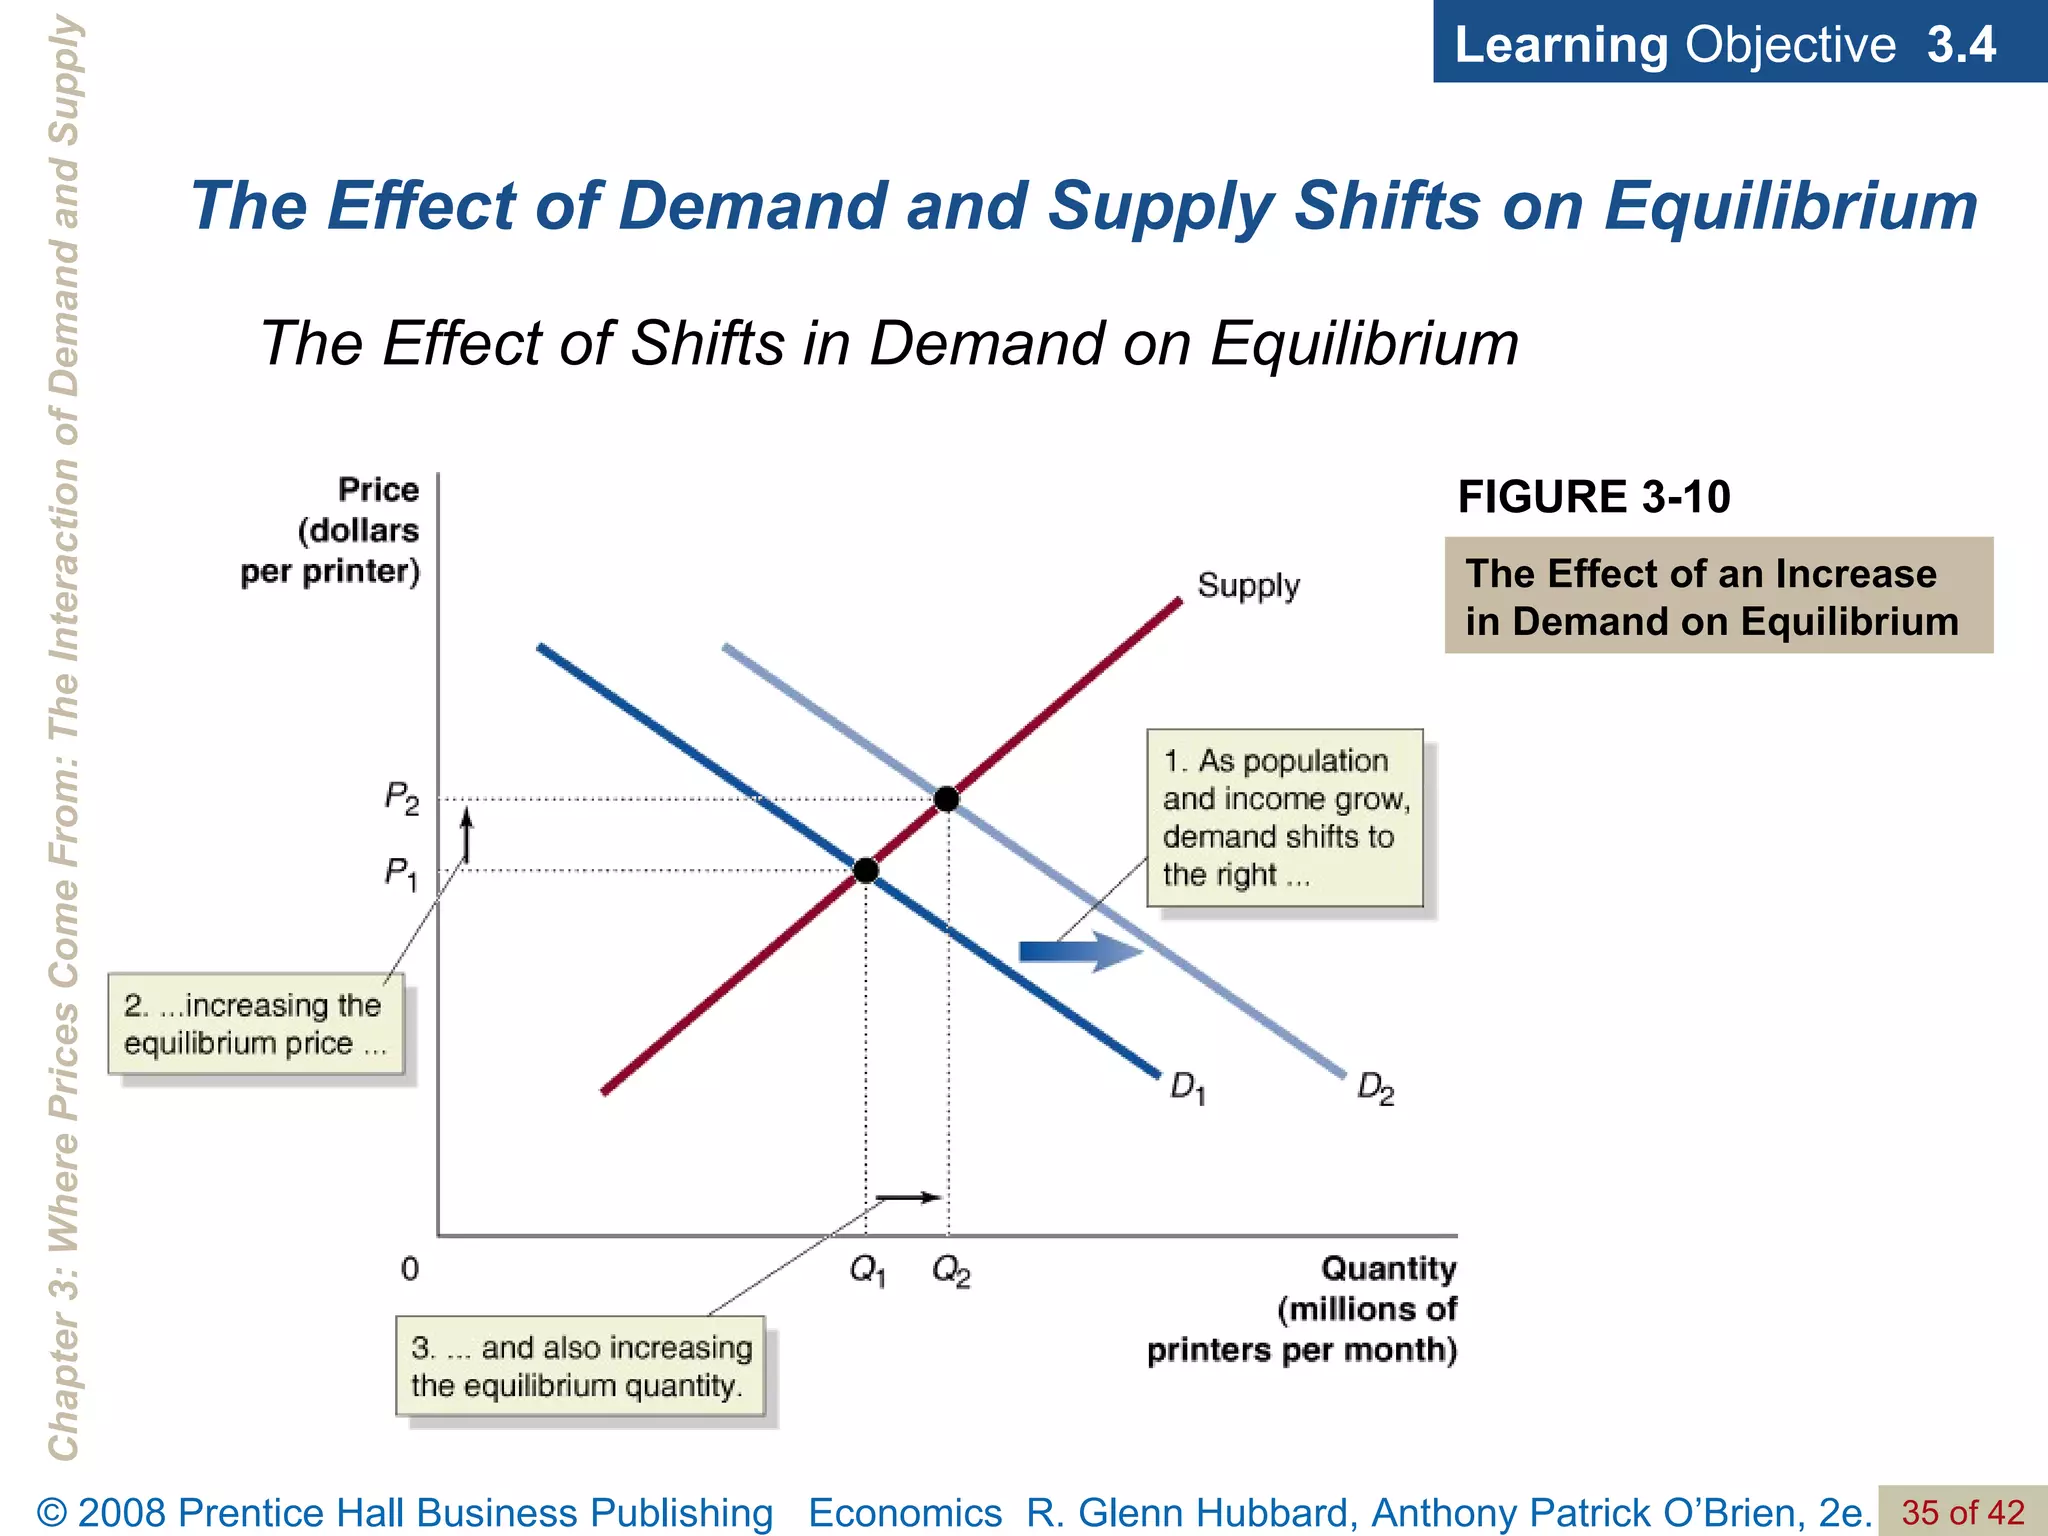
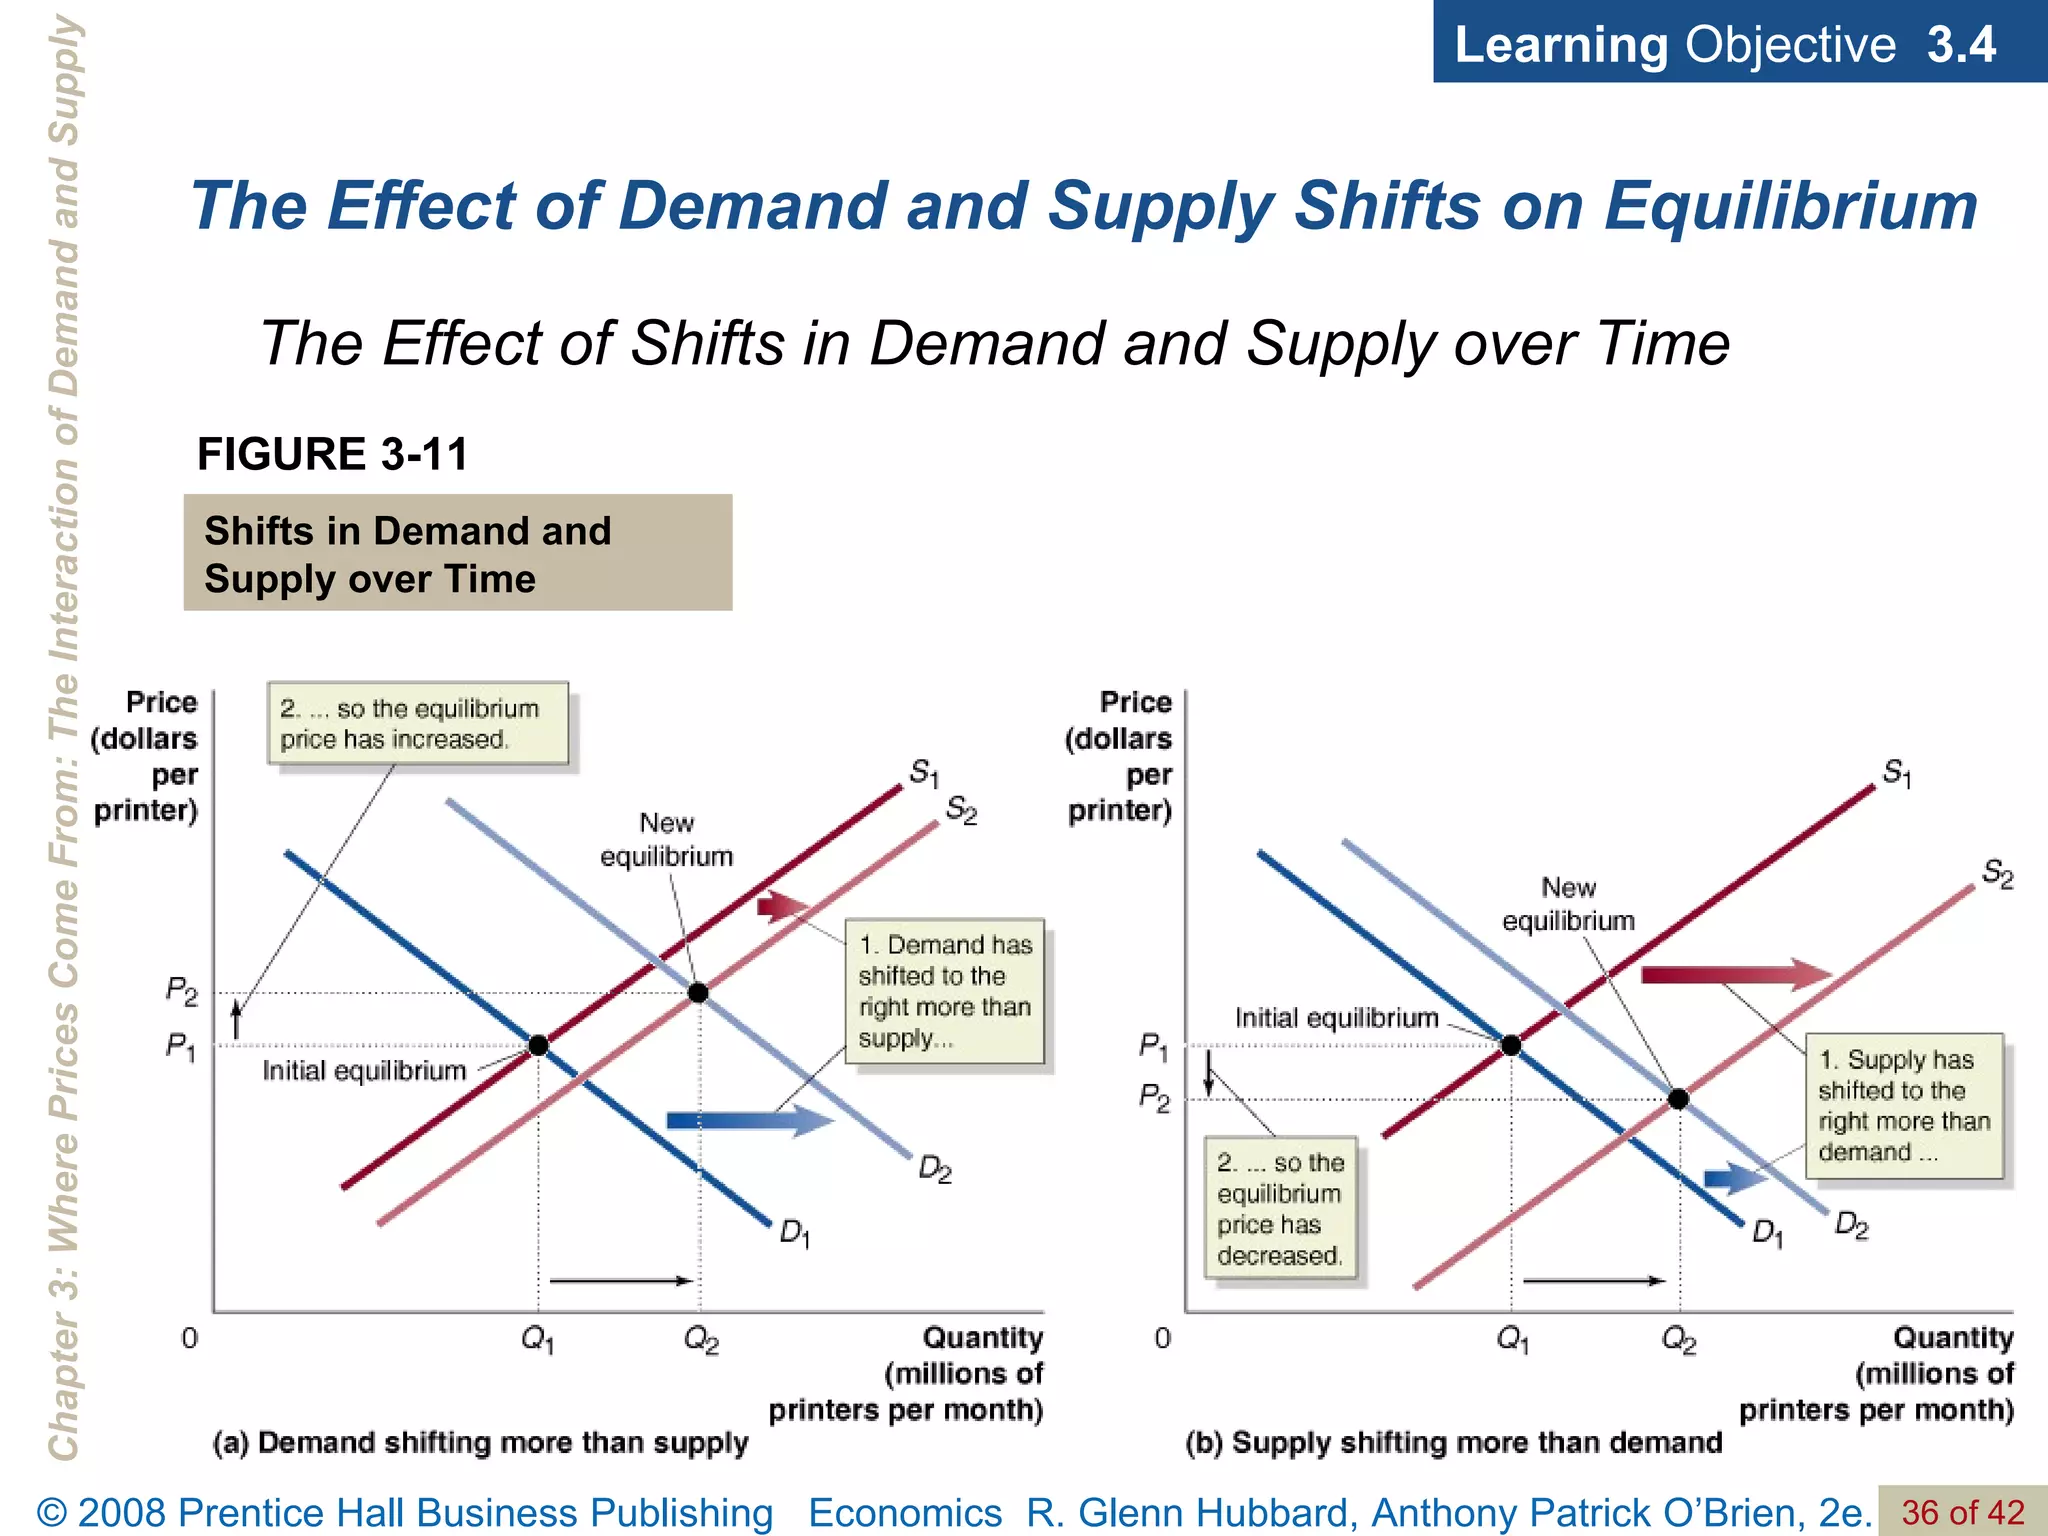
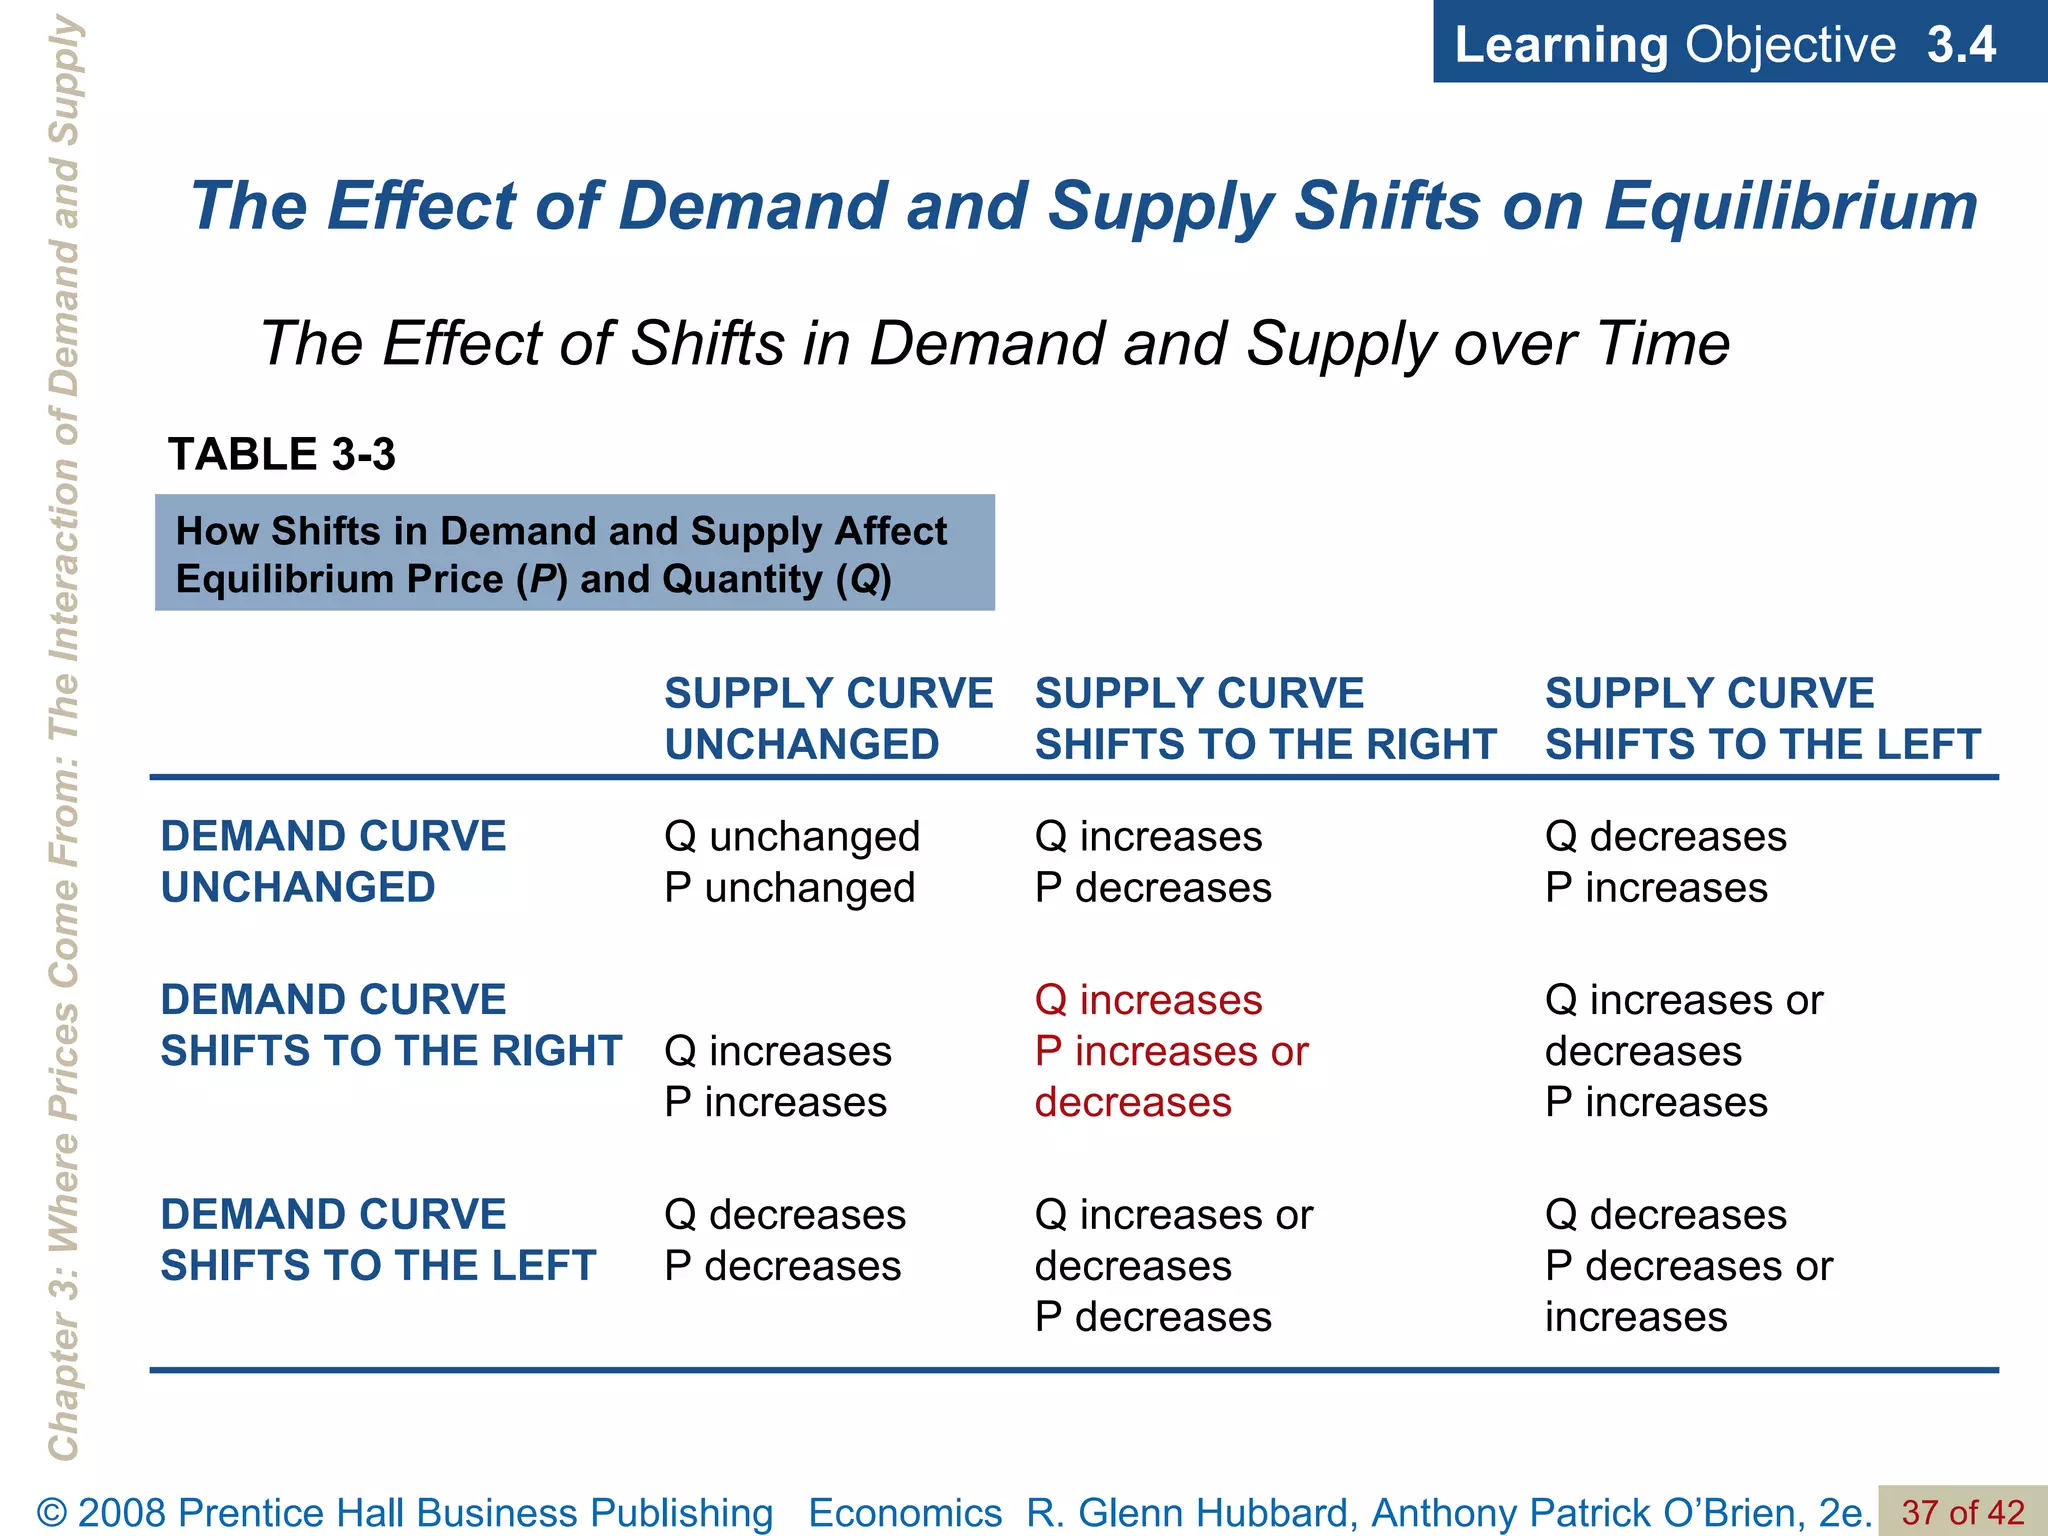
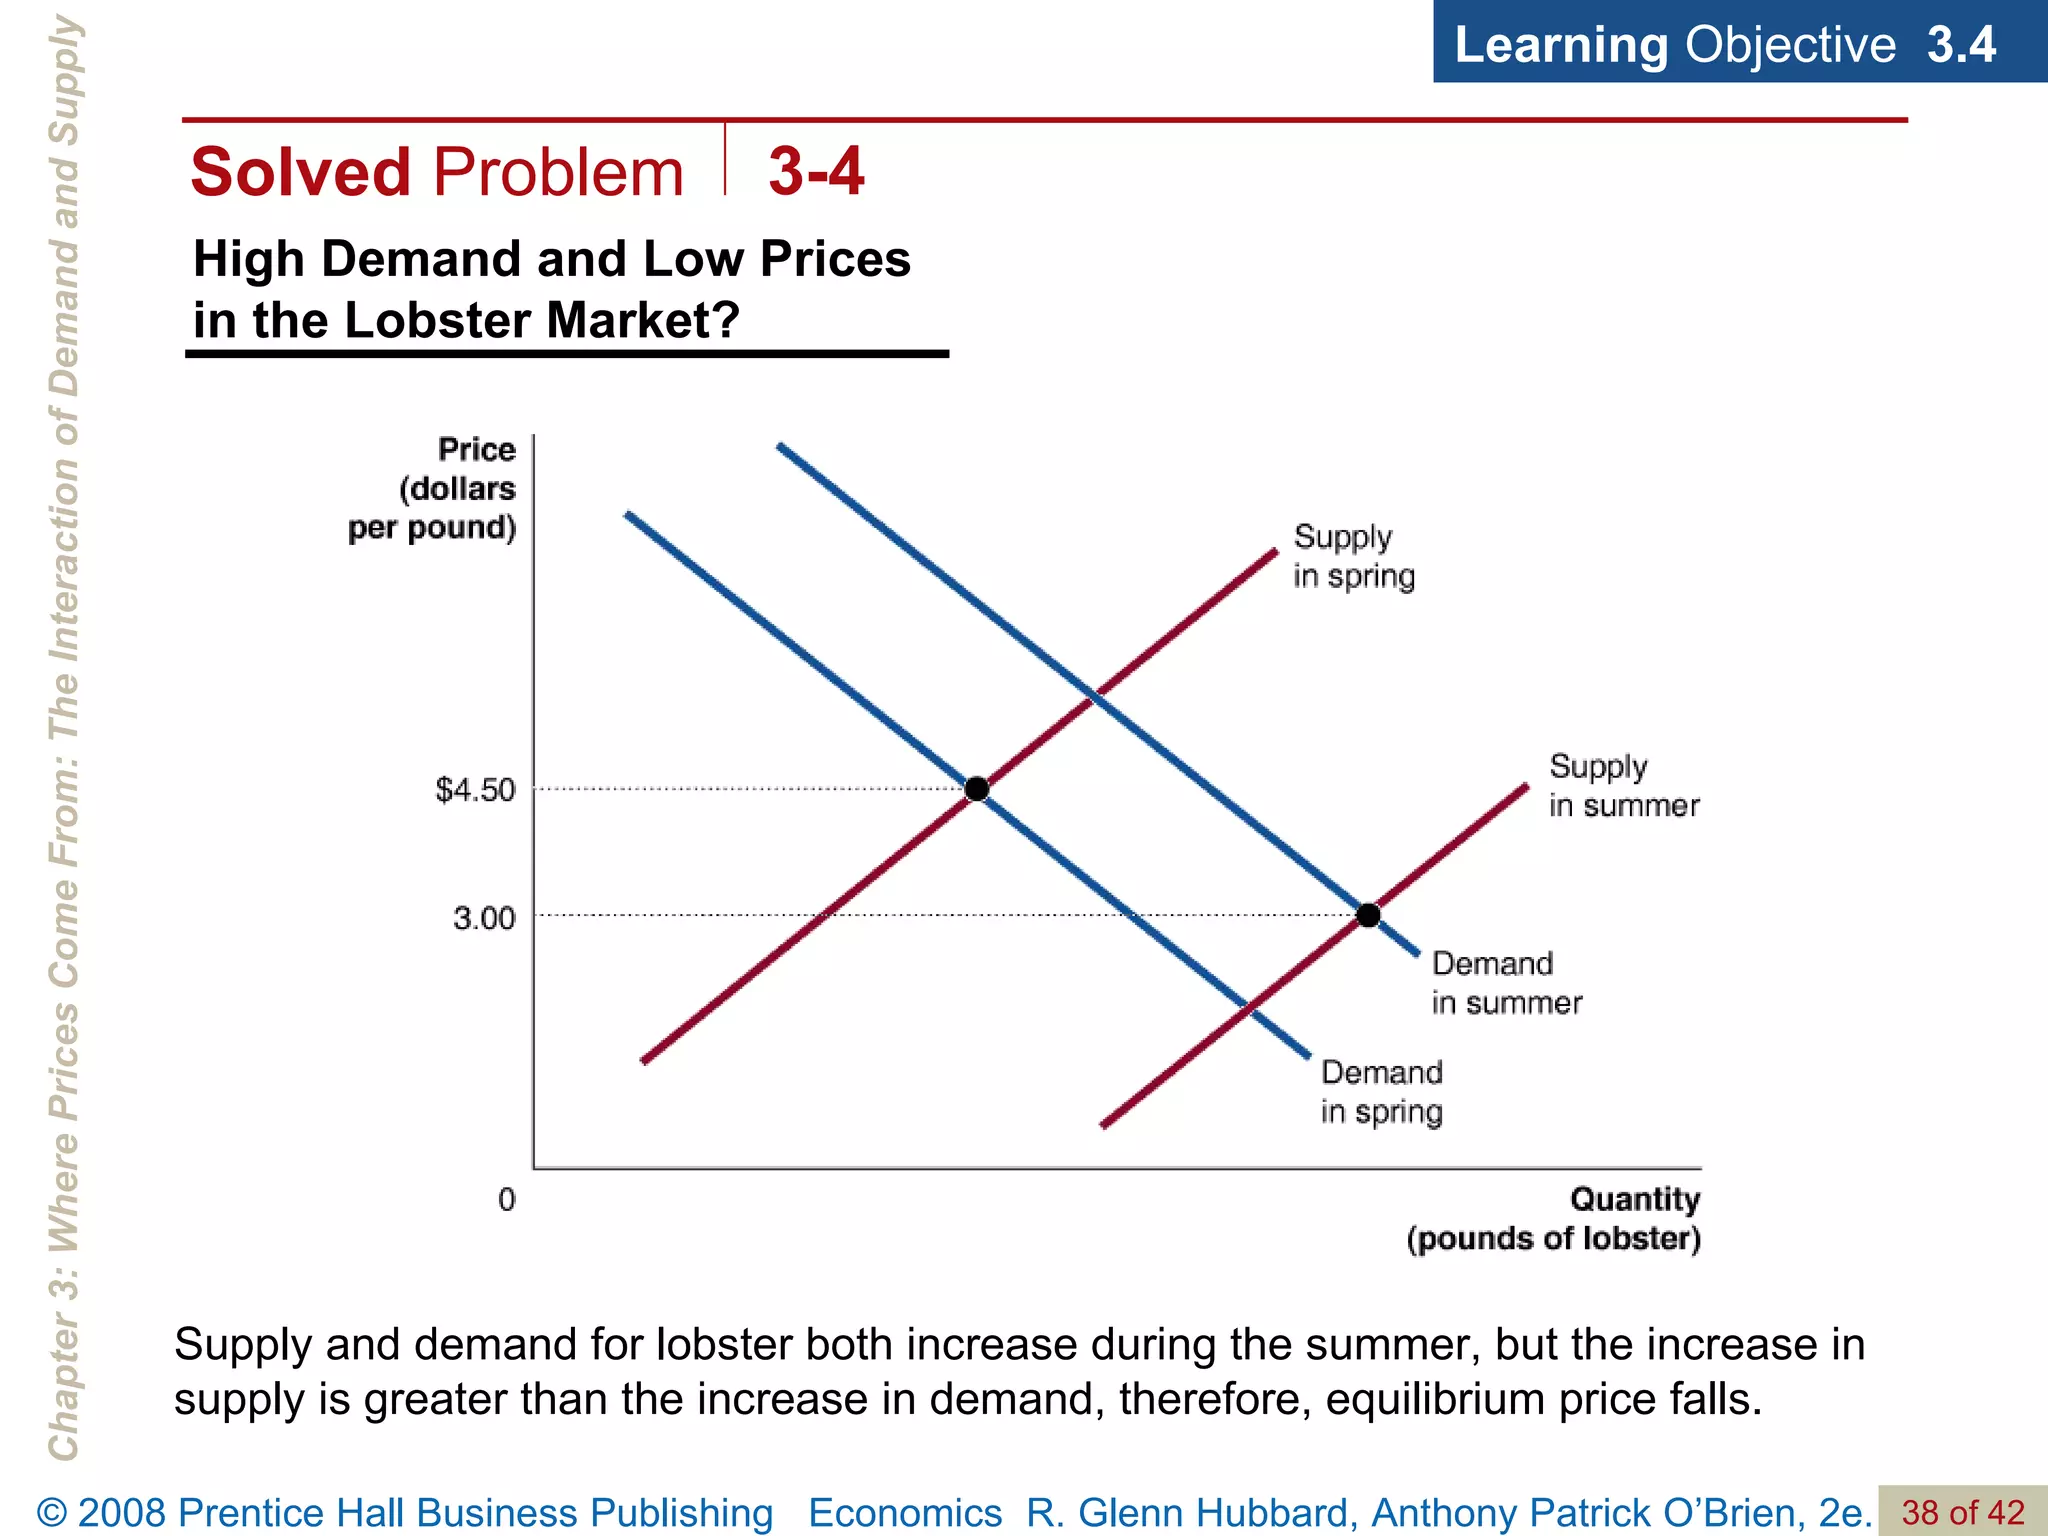
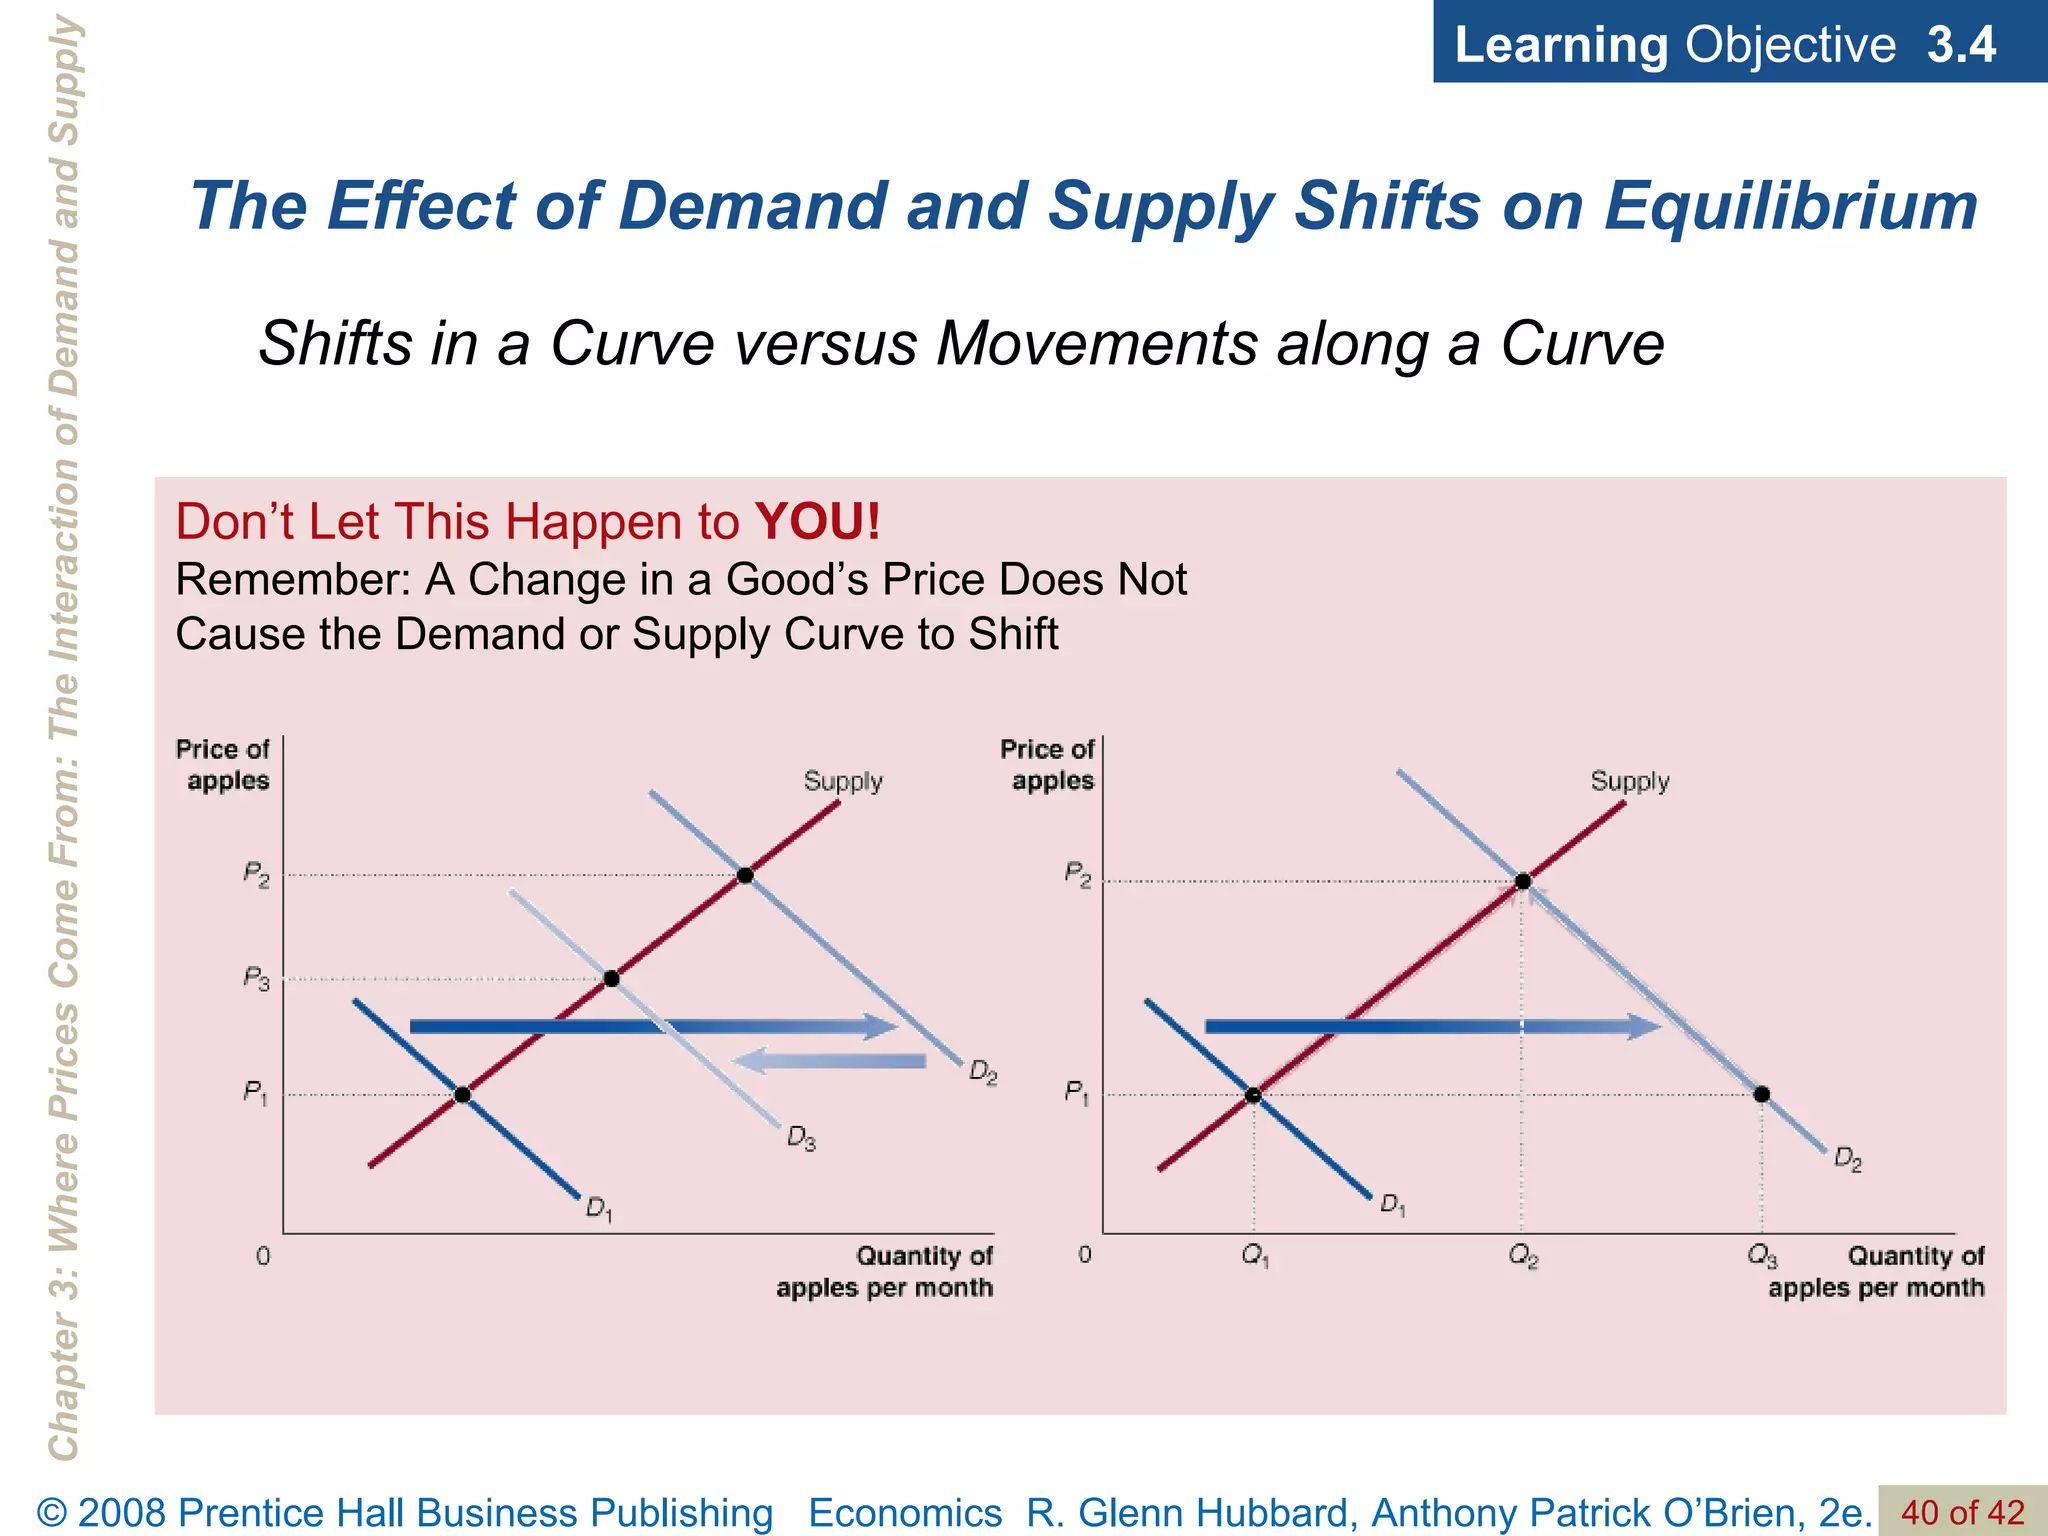
- The document discusses concepts related to demand and supply, including demand curves, supply curves, market equilibrium, factors that shift demand and supply, and the effects of changes in demand and supply on equilibrium price and quantity.