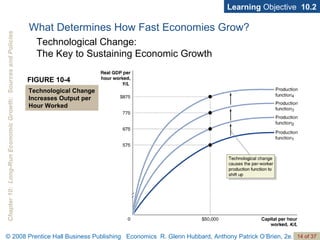
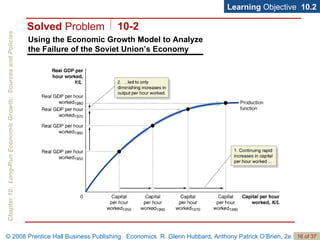
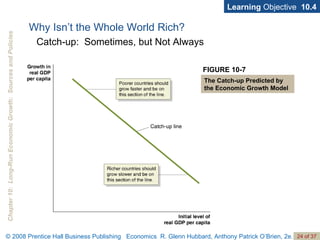
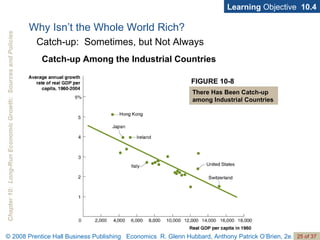
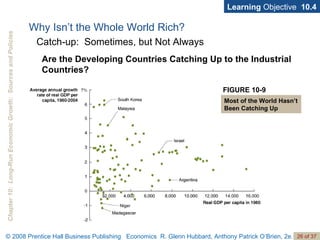
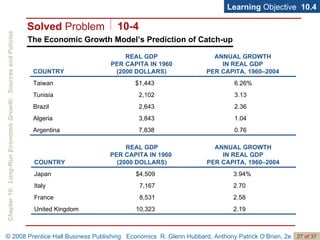
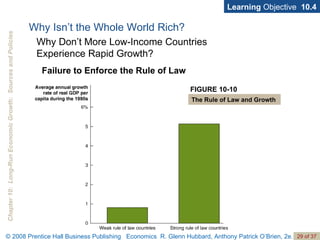
2. MySpace Meets the Chinese Economic Miracle Learning Objectives … per capita GDP in China will double every eight years. Discuss government policies that foster economic growth. 10.5 Explain economic catch-up and discuss why many poor countries have not experienced rapid economic growth. 10.4 Discuss fluctuations in productivity growth in the United States. 10.3 Use the economic growth model to explain why growth rates differ across countries. 10.2 Define economic growth , calculate economic growth rates, and describe global trends in economic growth. 10.1
3. Economic Growth Over Time and Around the World Industrial Revolution The application of mechanical power to the production of goods, beginning in England around 1750. Economic Growth from 1,000,000 B.C. to the Present Learning Objective 10.1
4.
5. Learning Objective 10.1 FIGURE 10-1 Average Annual Growth Rates for the World Economy Economic Growth Over Time and Around the World Economic Growth from 1,000,000 B.C. to the Present
6. In the long run, small differences in economic growth rates result in big differences in living standards. Learning Objective 10.1 Why Do Growth Rates Matter? Growth rates matter because an economy that grows too slowly fails to raise living standards. Don’t Let This Happen to YOU! Don’t Confuse the Average Annual Percentage Change with the Total Percentage Change Economic Growth Over Time and Around the World Small Differences in Growth Rates Are Important
7.
8. Learning Objective 10.1 FIGURE 10-2 GDP per Capita, 2006 Economic Growth Over Time and Around the World “ The Rich Get Richer and . . . ”
9. What Determines How Fast Economies Grow? Economic growth model A model that explains growth rates in real GDP per capita over the long run. Labor productivity The quantity of goods and services that can be produced by one worker or by one hour of work. Technological change A change in the quantity of output a firm can produce using a given quantity of inputs. Learning Objective 10.2
10. What Determines How Fast Economies Grow? • Better machinery and equipment. • Increases in human capital. Learning Objective 10.2 There are three main sources of technological change: Human capital The accumulated knowledge and skills that workers acquire from education and training or from their life experiences. • Better means of organizing and managing production.
11. Per-worker production function The relationship between real GDP per hour worked and capital per hour worked, holding the level of technology constant. Learning Objective 10.2 What Determines How Fast Economies Grow? The Per-Worker Production Function
12. Learning Objective 10.2 FIGURE 10-3 The Per-Worker Production Function What Determines How Fast Economies Grow? The Per-Worker Production Function
13. Learning Objective 10.2 Technological change helps economies avoid diminishing returns to capital. What Determines How Fast Economies Grow? Which Is More Important for Economic Growth: More Capital or Technological Change?
14. Learning Objective 10.2 FIGURE 10-4 Technological Change Increases Output per Hour Worked What Determines How Fast Economies Grow? Technological Change: The Key to Sustaining Economic Growth
15.
16. Using the Economic Growth Model to Analyze the Failure of the Soviet Union’s Economy Learning Objective 10.2 Solved Problem 10-2
17. Learning Objective 10.2 New growth theory A model of long-run economic growth which emphasizes that technological change is influenced by economic incentives and so is determined by the working of the market system. What Determines How Fast Economies Grow? New Growth Theory
18. Learning Objective 10.2 • Protecting intellectual property with patents and copyrights. Patent The exclusive right to a product for a period of 20 years from the date the product is invented. • Subsidizing research and development. • Subsidizing education. What Determines How Fast Economies Grow? New Growth Theory Government policy can help increase the accumulation of knowledge capital in three ways:
19. Learning Objective 10.2 Schumpeter developed a model of growth that emphasized his view that new products unleash a “gale of creative destruction” in which older products—and, often, the firms that produced them—are driven out of the market. What Determines How Fast Economies Grow? Joseph Schumpeter and Creative Destruction
20. Learning Objective 10.3 FIGURE 10-5 Average Annual Growth Rates in Real GDP per Hour Worked in the United States Economic Growth in the United States Economic Growth in the United States since 1950: Fast, Then Slow, Then Fast Again
21. • Measurement problems • High oil prices • A decline in labor quality Learning Objective 10.3 Was It a Measurement Problem? Was It the Effect of High Oil Prices? Was It the Declining Quality of Labor? The Productivity Slowdown Affected All Industrial Countries Economic Growth in the United States What Caused the Productivity Slowdown of 1973–1994?
22. Learning Objective 10.3 Why Has Productivity Growth Been Faster in the United States than in Other Countries? FIGURE 10-6 Productivity Growth in the Leading Industrial Economies, 1996–2006 Economic Growth in the United States The Productivity Boom: Are We in a “New Economy”?
23. Why Isn’t the Whole World Rich? Catch-up The prediction that the level of GDP per capita (or income per capita) in poor countries will grow faster than in rich countries. Learning Objective 10.4
24. Why Isn’t the Whole World Rich? Learning Objective 10.4 FIGURE 10-7 The Catch-up Predicted by the Economic Growth Model Catch-up: Sometimes, but Not Always
25. Learning Objective 10.4 FIGURE 10-8 There Has Been Catch-up among Industrial Countries Catch-up Among the Industrial Countries Why Isn’t the Whole World Rich? Catch-up: Sometimes, but Not Always
26. Learning Objective 10.4 FIGURE 10-9 Most of the World Hasn’t Been Catching Up Are the Developing Countries Catching Up to the Industrial Countries? Why Isn’t the Whole World Rich? Catch-up: Sometimes, but Not Always
27. The Economic Growth Model’s Prediction of Catch-up Learning Objective 10.4 Solved Problem 10-4 0.76 7,838 Argentina 1.04 3,843 Algeria 2.36 2,643 Brazil 3.13 2,102 Tunisia 6.26% $1,443 Taiwan ANNUAL GROWTH IN REAL GDP PER CAPITA, 1960–2004 REAL GDP PER CAPITA IN 1960 (2000 DOLLARS) COUNTRY 2.19 10,323 United Kingdom 2.58 8,531 France 2.70 7,167 Italy 3.94% $4,509 Japan ANNUAL GROWTH IN REAL GDP PER CAPITA, 1960–2004 REAL GDP PER CAPITA IN 1960 (2000 DOLLARS) COUNTRY
28. Why Isn’t the Whole World Rich? Learning Objective 10.4 Why Don’t More Low-Income Countries Experience Rapid Growth? Property rights The rights individuals or firms have to the exclusive use of their property, including the right to buy or sell it. Failure to Enforce the Rule of Law Rule of law The ability of a government to enforce the laws of the country, particularly with respect to protecting private property and enforcing contracts.
29. Learning Objective 10.4 Failure to Enforce the Rule of Law FIGURE 10-10 The Rule of Law and Growth Why Isn’t the Whole World Rich? Why Don’t More Low-Income Countries Experience Rapid Growth?
30. Learning Objective 10.4 Wars and Revolutions Why Isn’t the Whole World Rich? Why Don’t More Low-Income Countries Experience Rapid Growth? Wars have made it impossible for countries such as Afghanistan, Angola, Ethiopia, the Central African Republic and the Congo to accumulate capital or adopt new technologies.
31. Learning Objective 10.4 Poor Public Education and Health Low Rates of Saving and Investment Why Isn’t the Whole World Rich? Why Don’t More Low-Income Countries Experience Rapid Growth? Many low-income countries have weak public school systems, so many workers are unable to read and write. People who are sick work less and are less productive when they do work. The low savings rates in developing countries contribute to a vicious cycle of poverty.
32. Why Isn’t the Whole World Rich? Learning Objective 10.4 The Benefits of Globalization Foreign portfolio investment The purchase by an individual or a firm of stock or bonds issued in another country. Globalization The process of countries becoming more open to foreign trade and investment. Foreign direct investment (FDI) The purchase or building by a corporation of a facility in a foreign country.
33. Why Isn’t the Whole World Rich? Learning Objective 10.4 The Benefits of Globalization FIGURE 10-11 Globalization and Growth
34.
35. Growth Policies Learning Objective 10.5 Enhancing Property Rights and the Rule of Law Improving Health and Education Policies with Respect to Technology Policies with Respect to Saving and Investment Is Economic Growth Good or Bad? We have seen that even small differences in growth rates compounded over the years can lead to major differences in standards of living. Therefore, there is potentially a very high payoff to government policies that increase growth rates.
36. An Inside LOOK Entrepreneurship and Sustained Economic Growth in Europe Feeling Brighter Figure 1. To increase output per worker during the aftermath of World War II, Europe increased capital per worker. Figure 2. To increase output per worker today, Europe must find new and innovative ways to produce.
37. Catch-up Economic growth model Foreign direct investment (FDI) Foreign portfolio investment Globalization Human capital Industrial Revolution Labor productivity New growth theory Patent Per-worker production function Property rights Rule of law Technological change K e y T e r m s