The document summarizes the economic model of demand and supply. It explains key concepts such as:
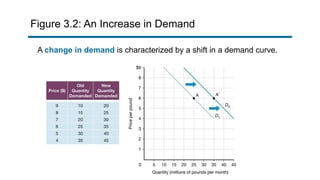
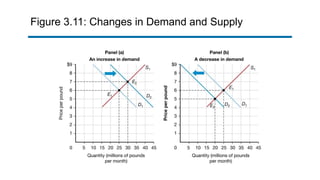
1) Demand curves which show the relationship between price and quantity demanded, and can shift due to non-price factors like income, preferences, and prices of related goods.
2) Supply curves which show the relationship between price and quantity supplied, and can shift due to non-price factors like costs of inputs, technology, and expectations.
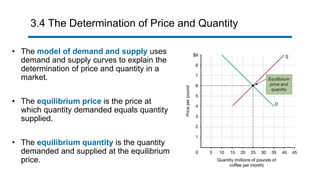
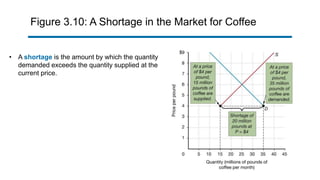
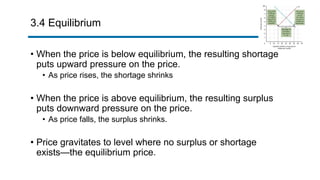
3) Equilibrium, where the quantity demanded equals the quantity supplied at the market clearing price. Surpluses and shortages occur when prices are above or below equilibrium.