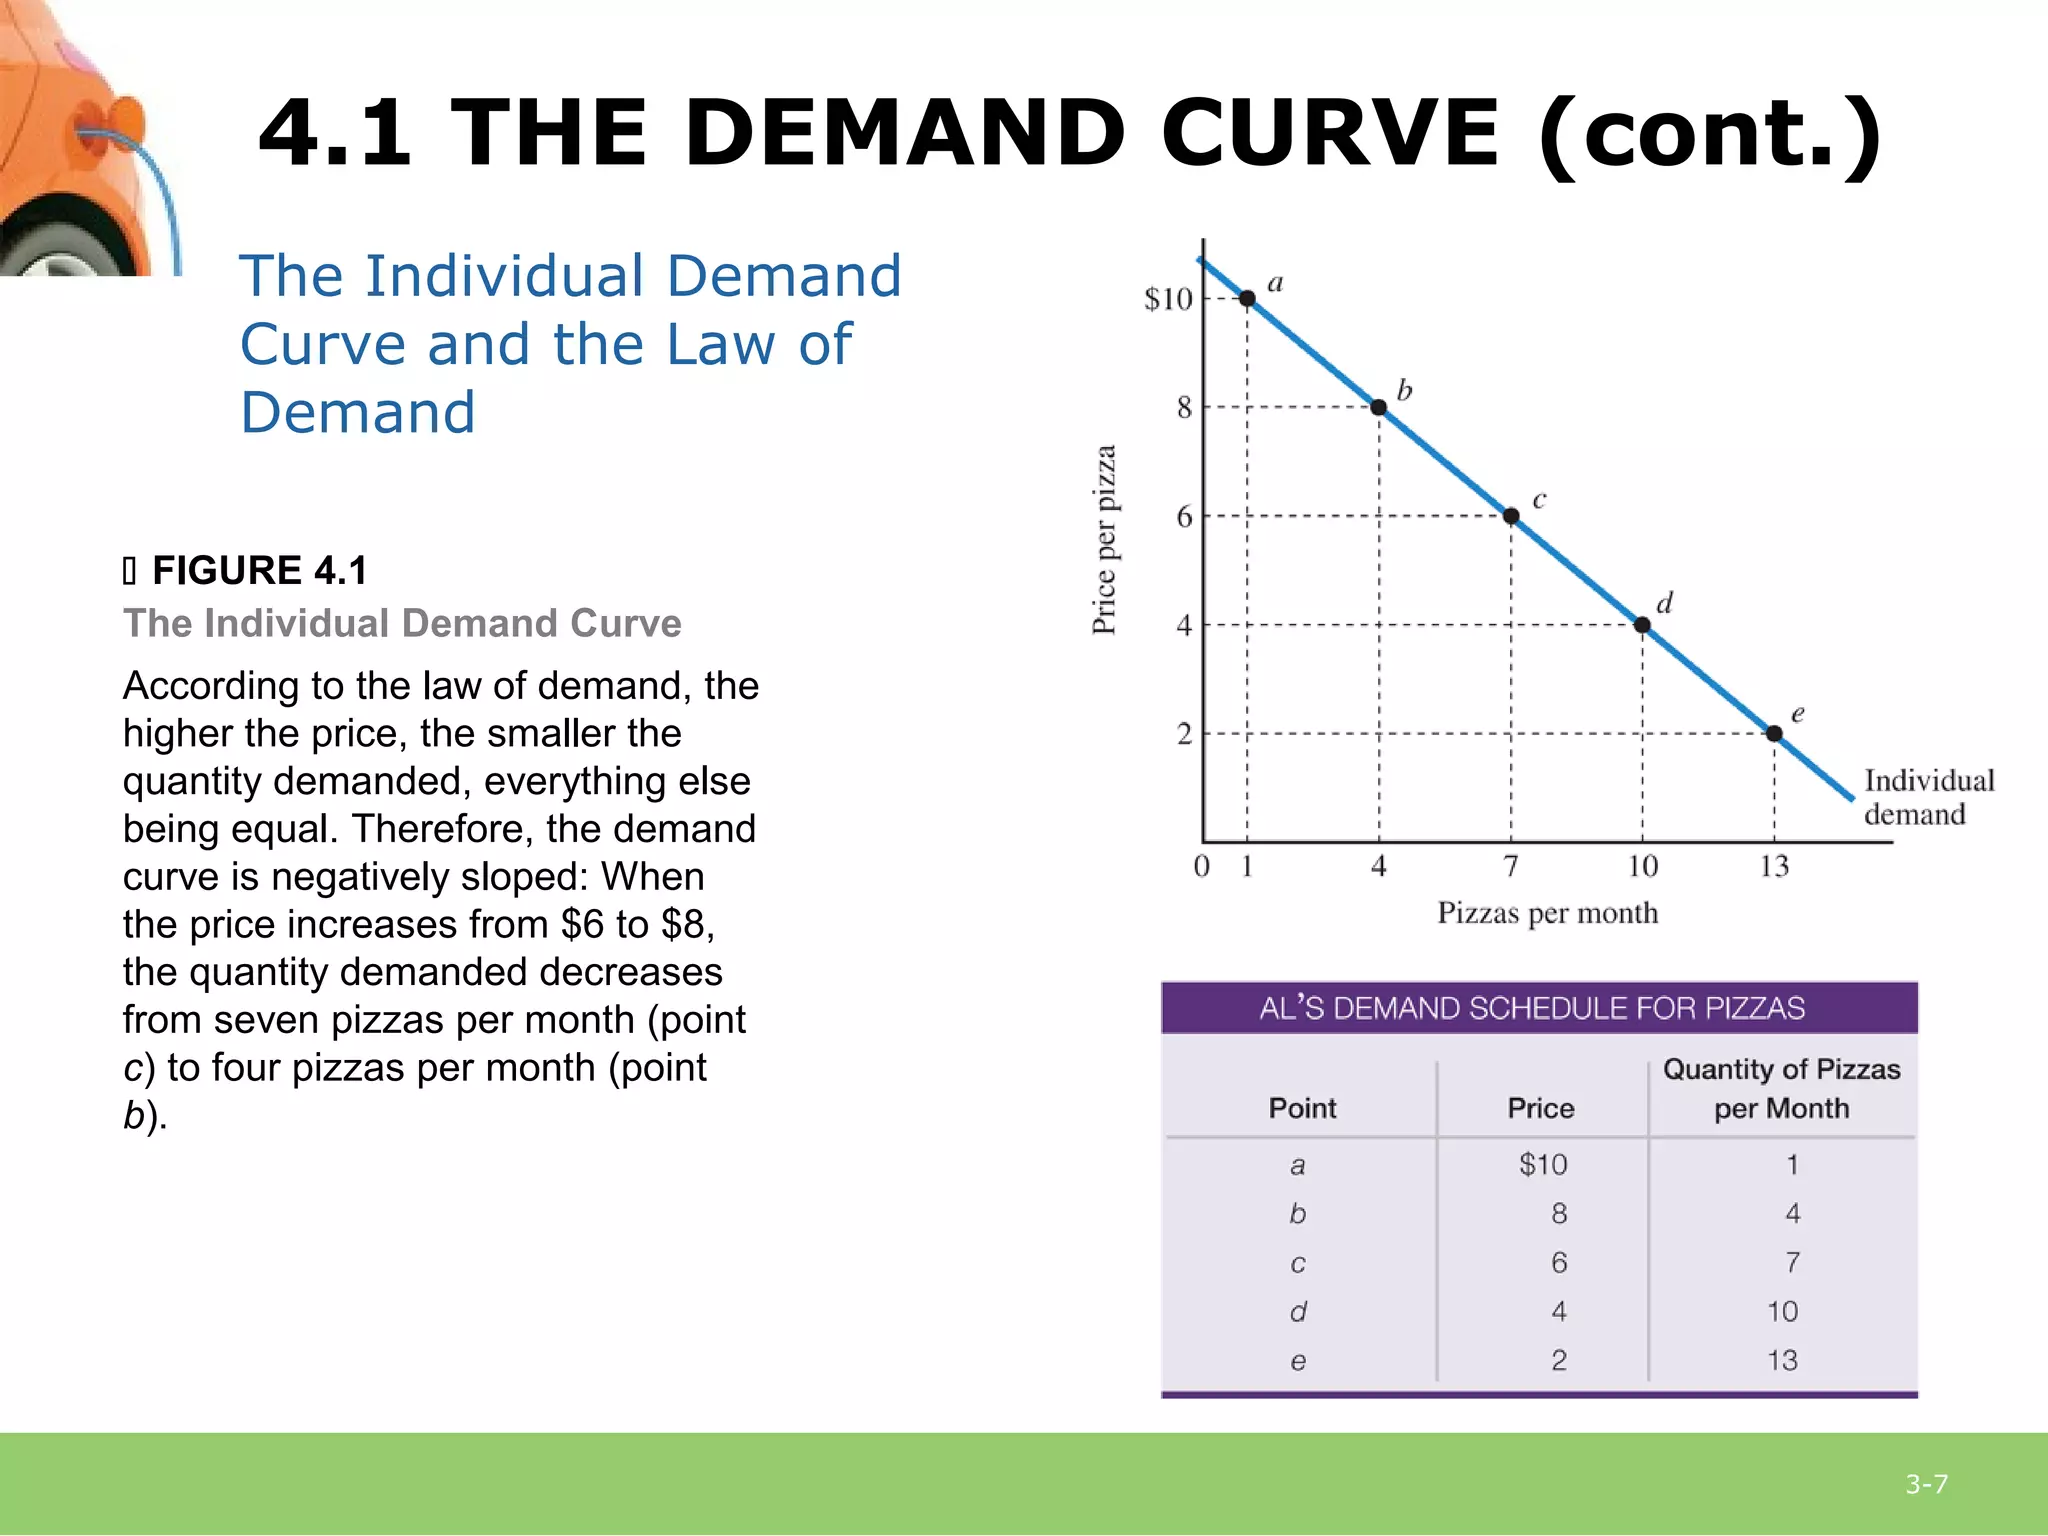
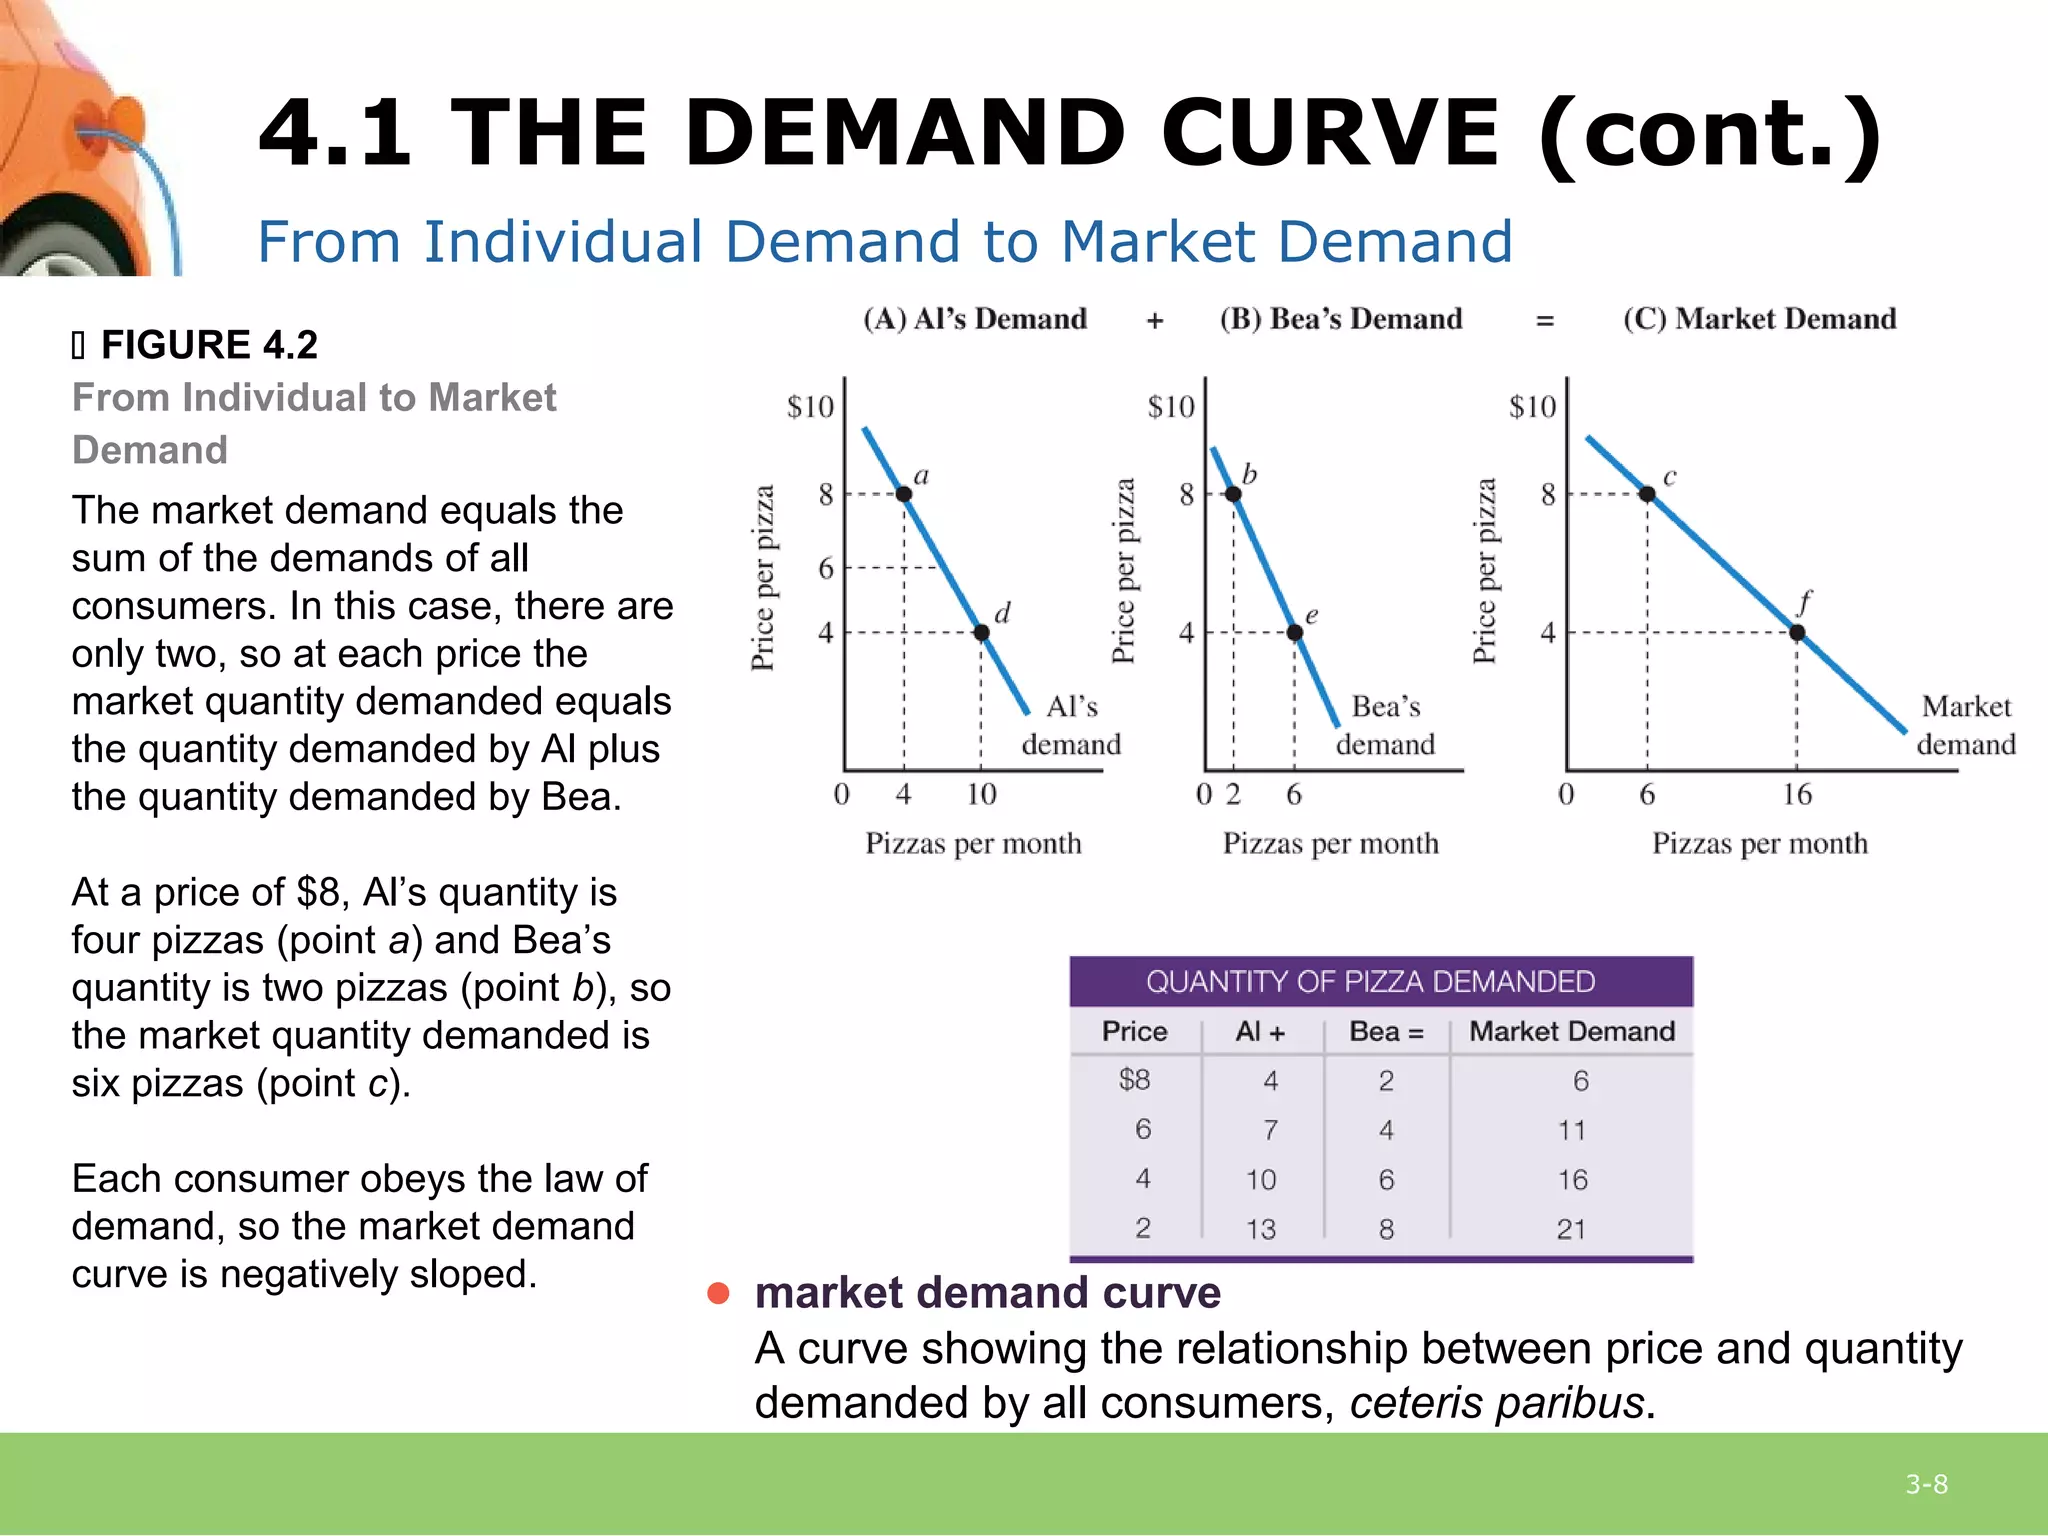
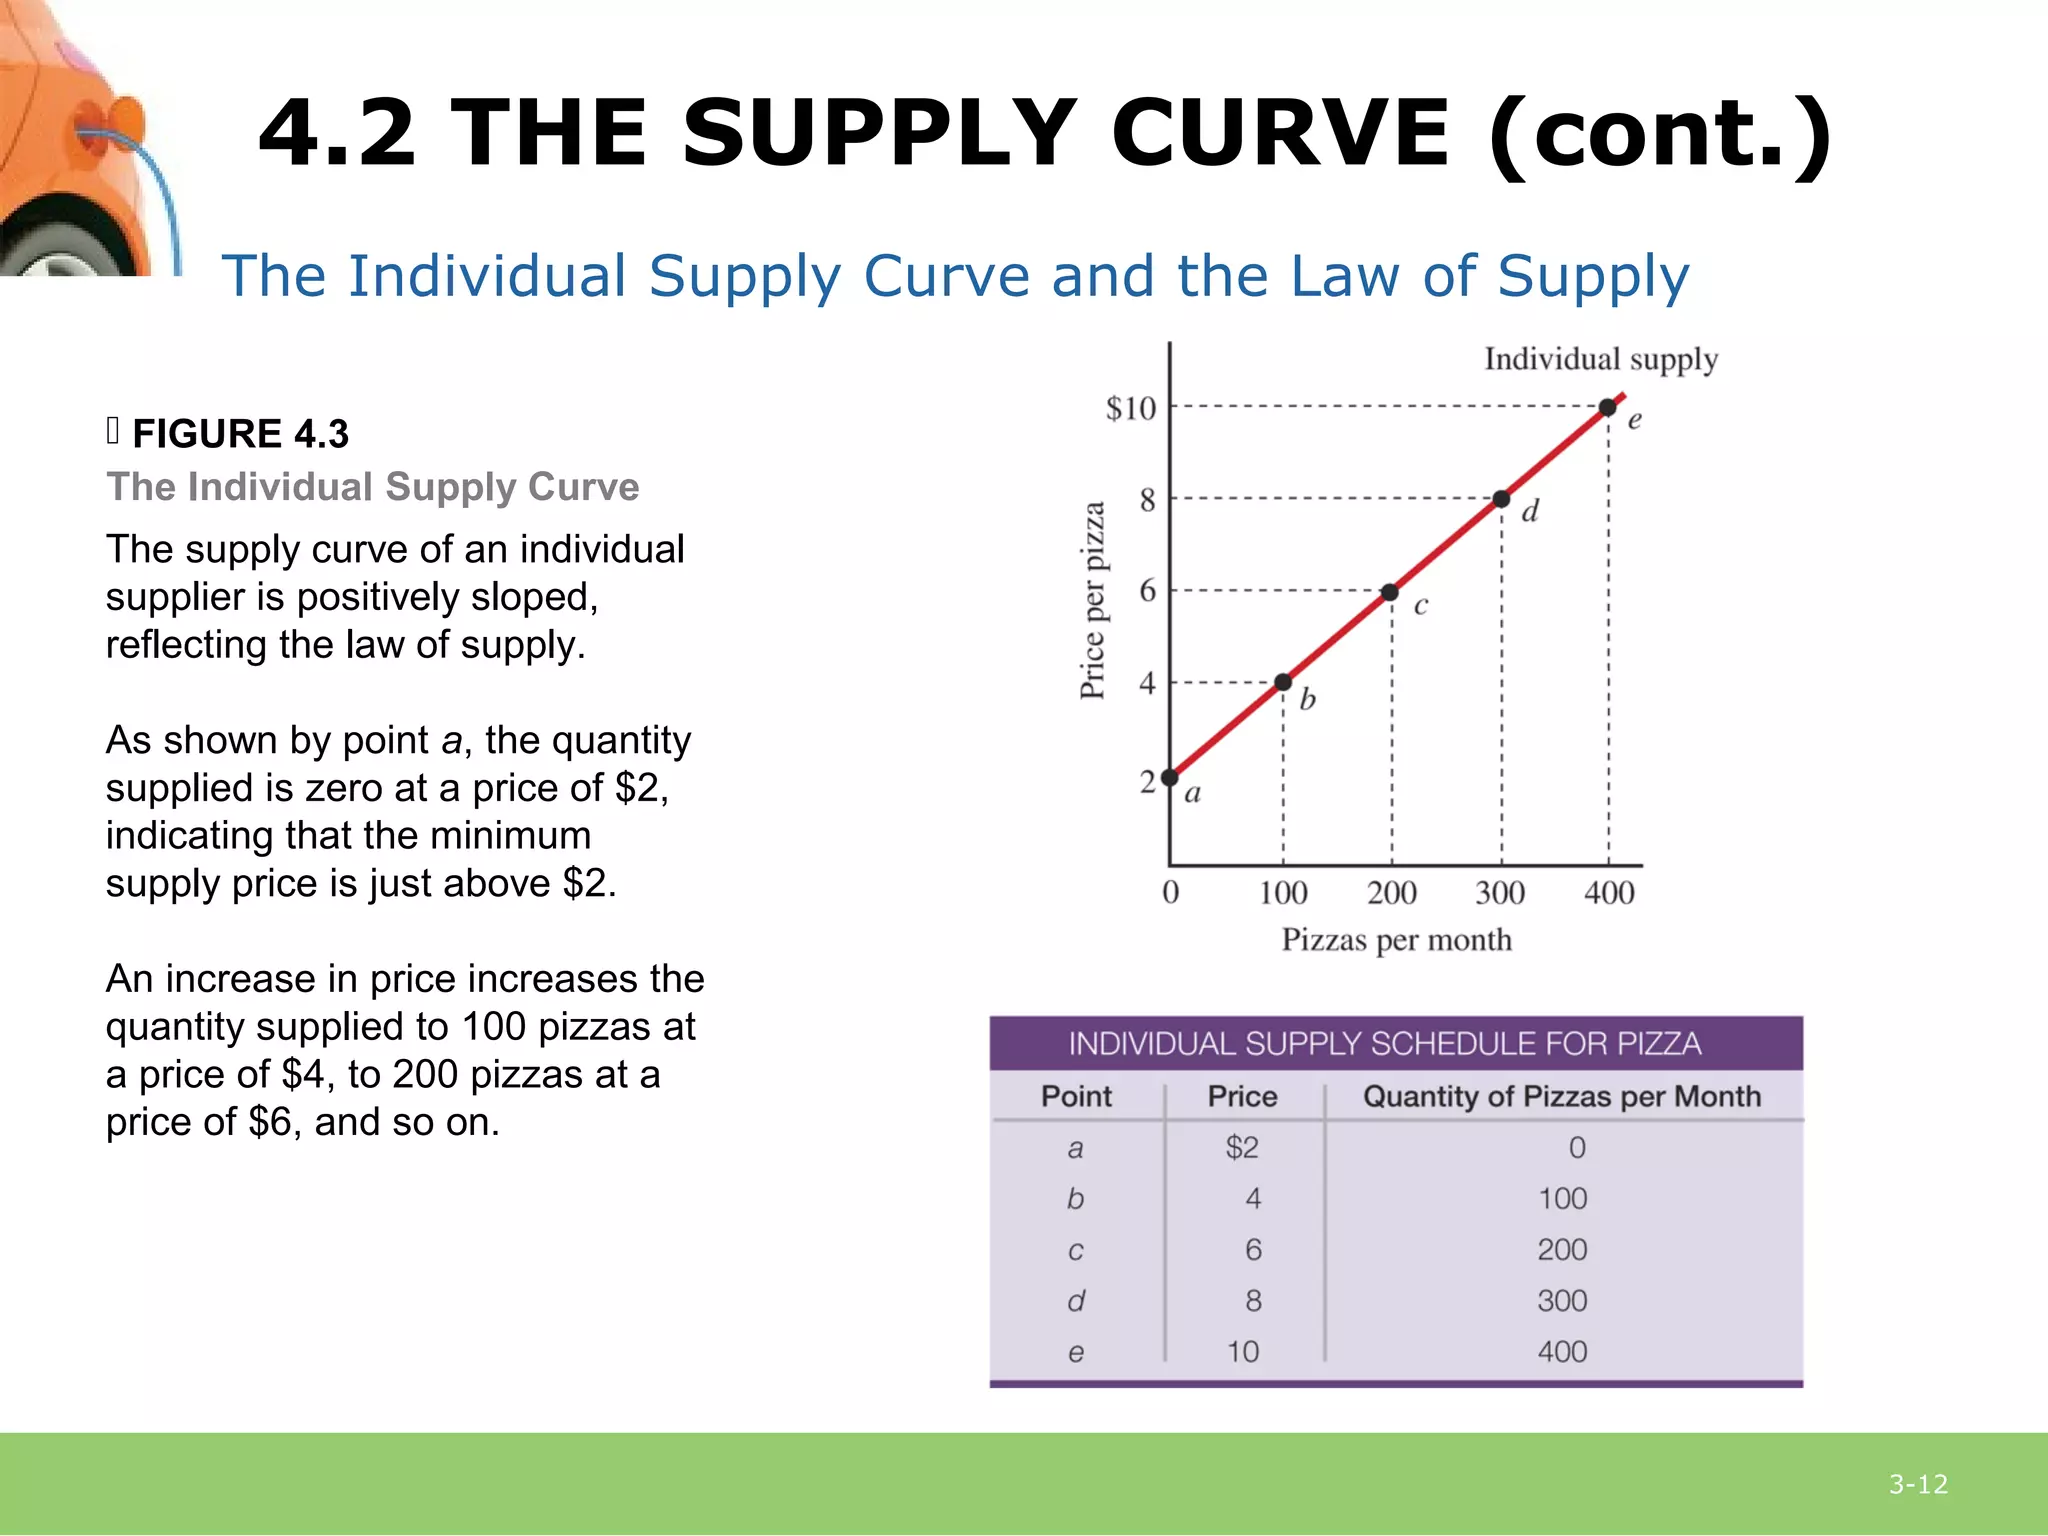
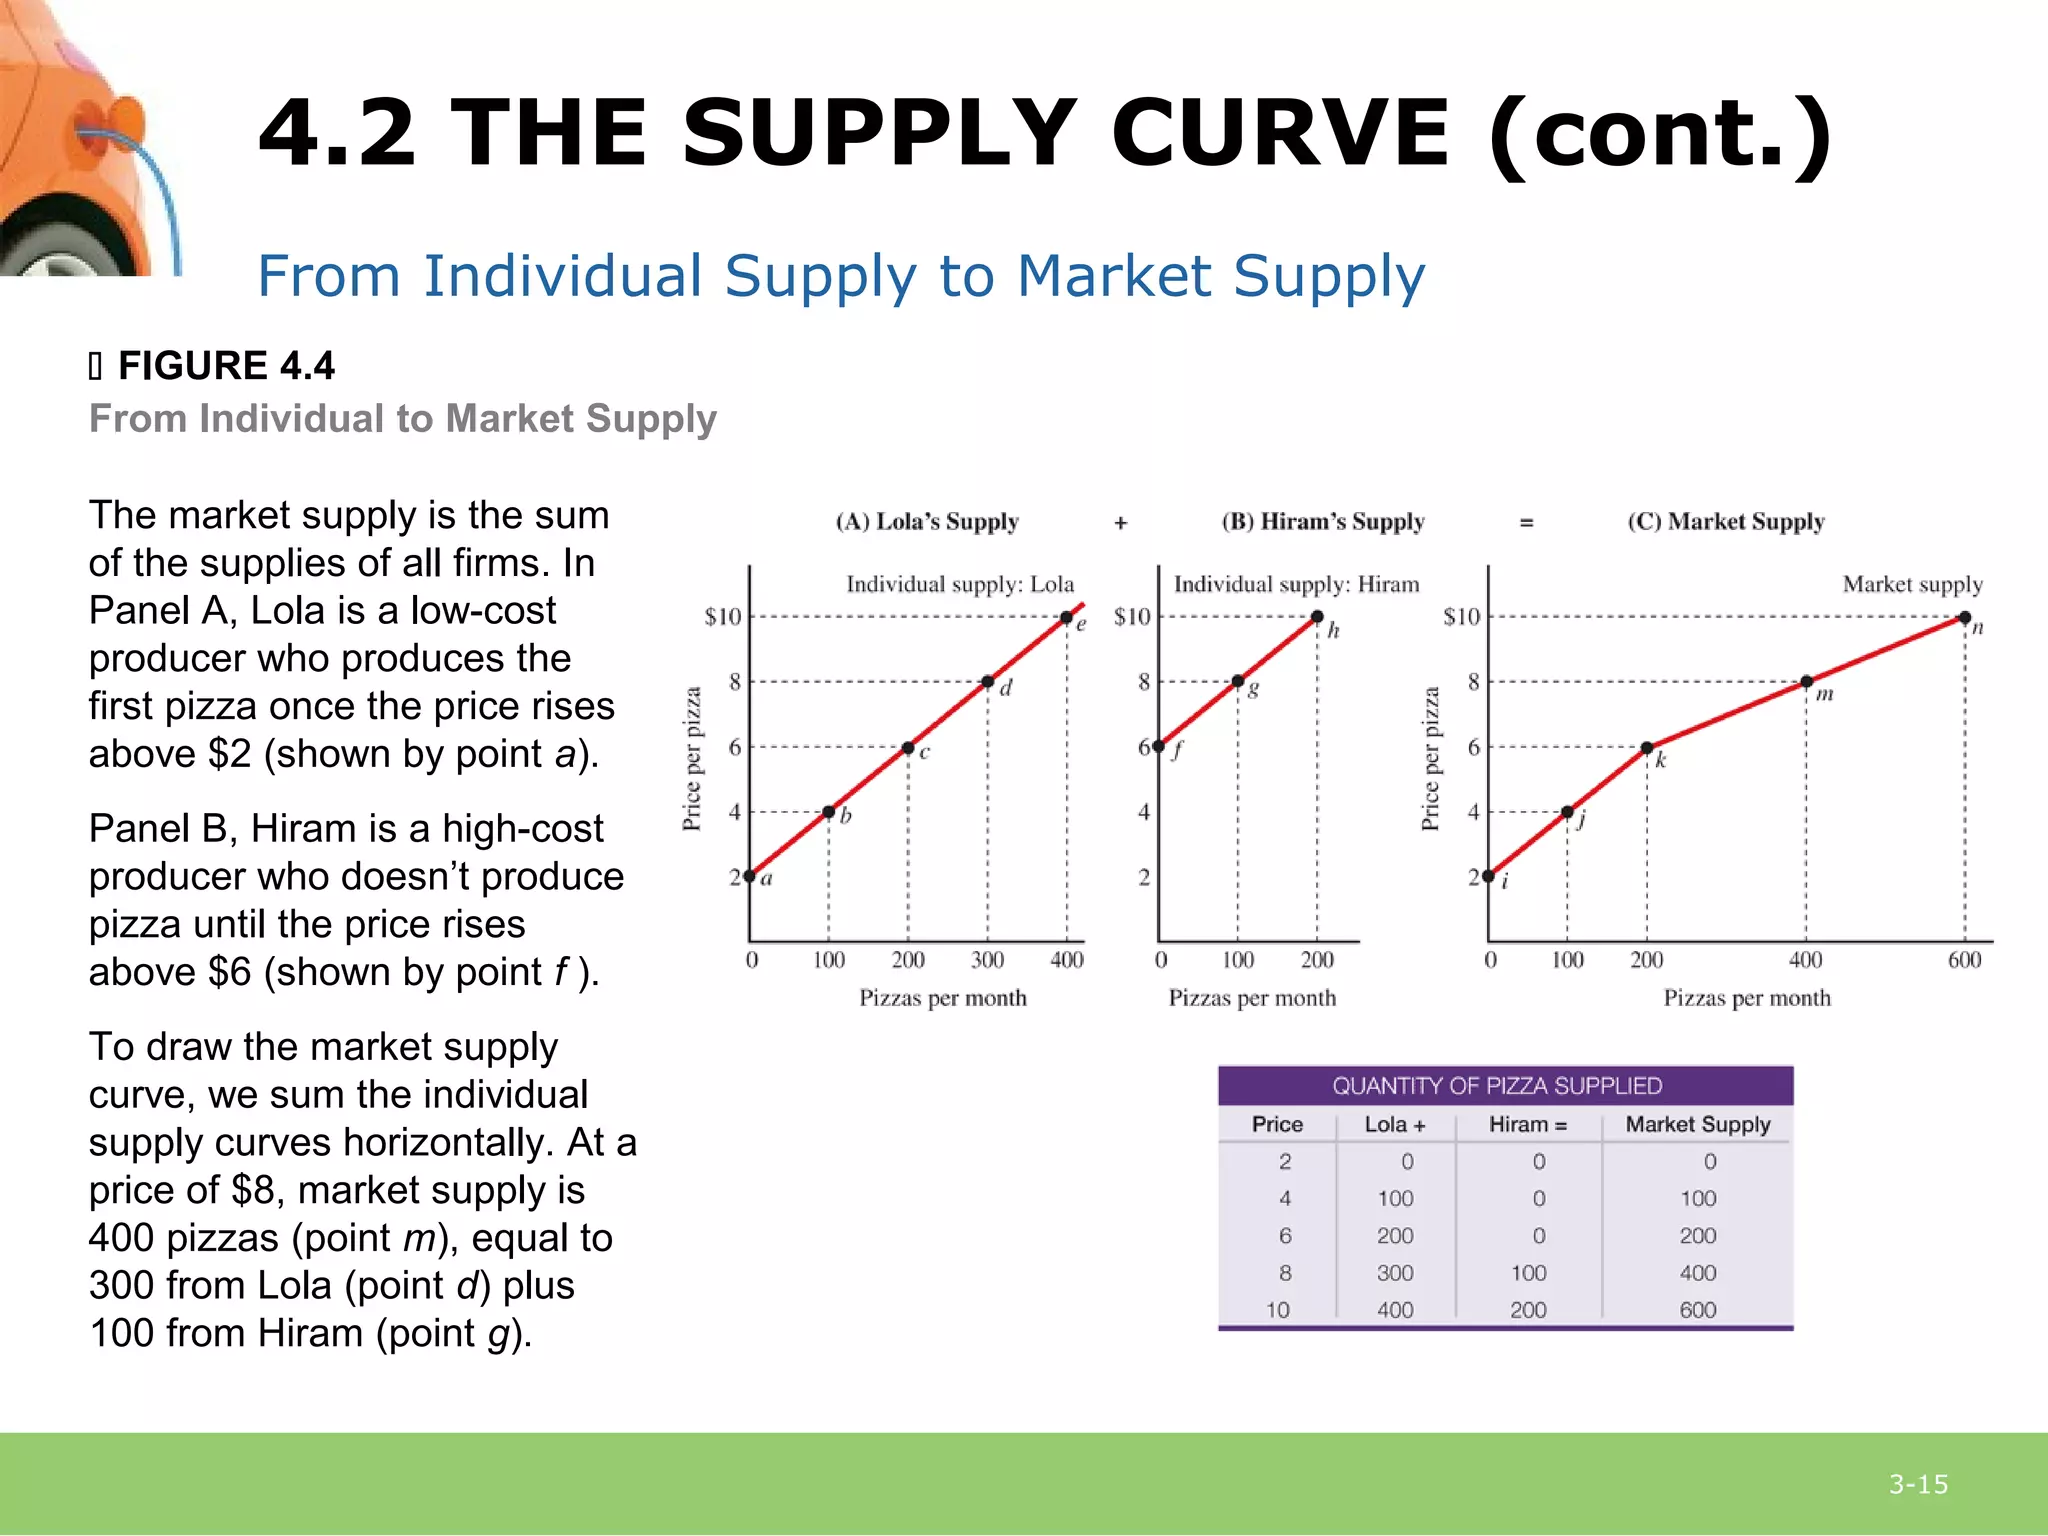
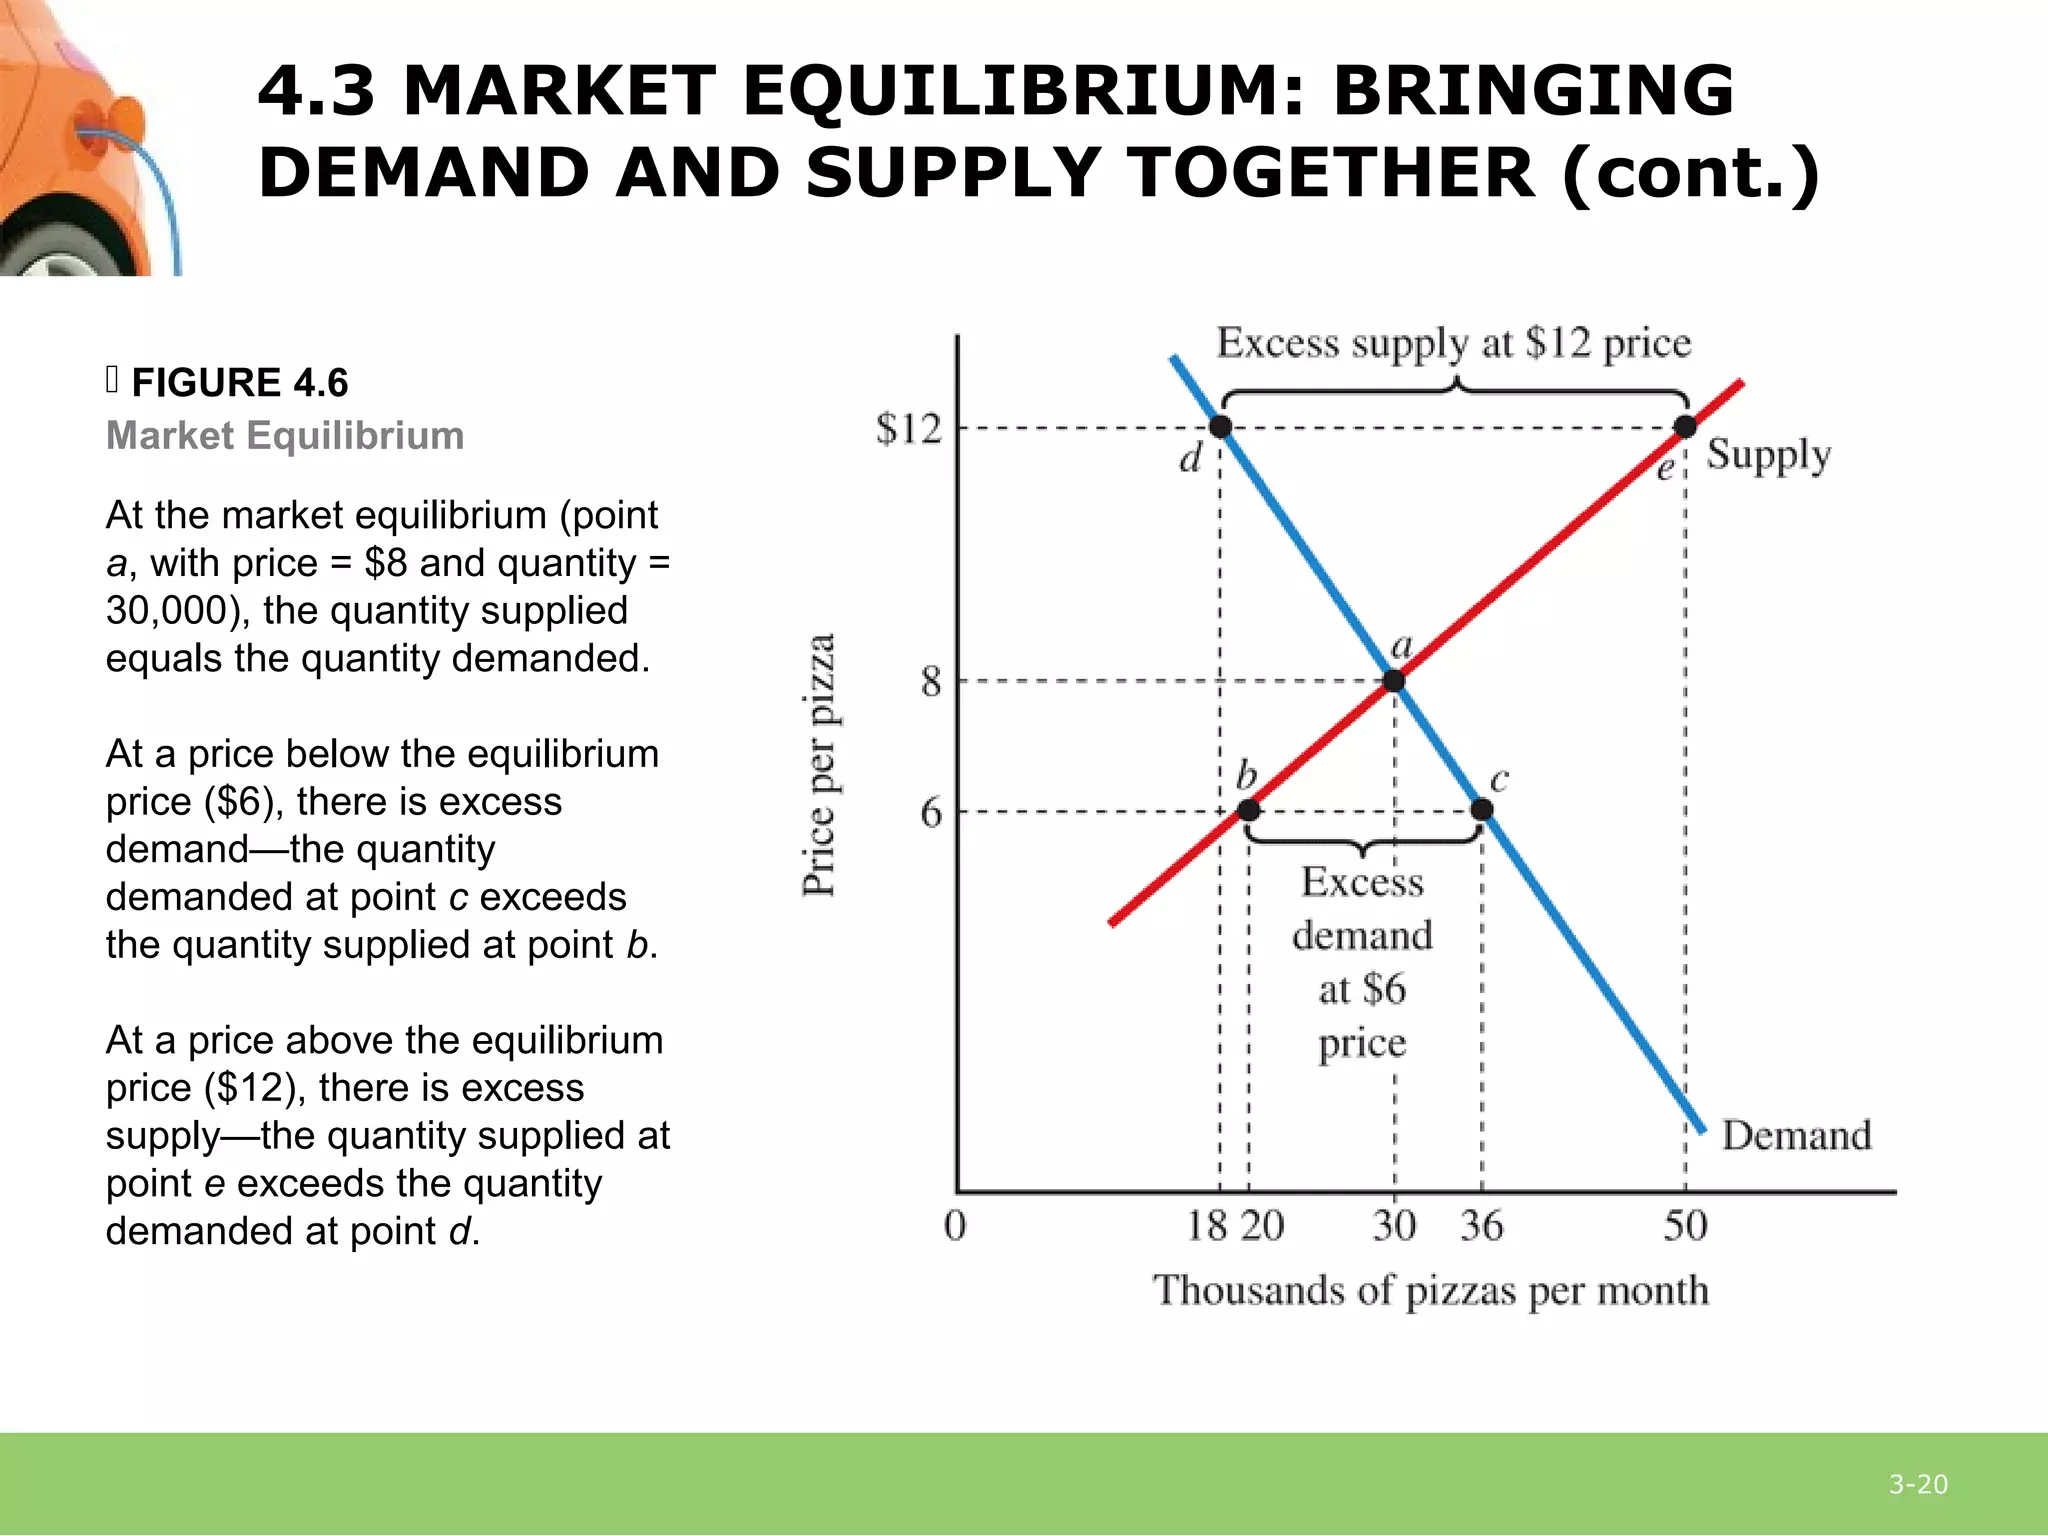
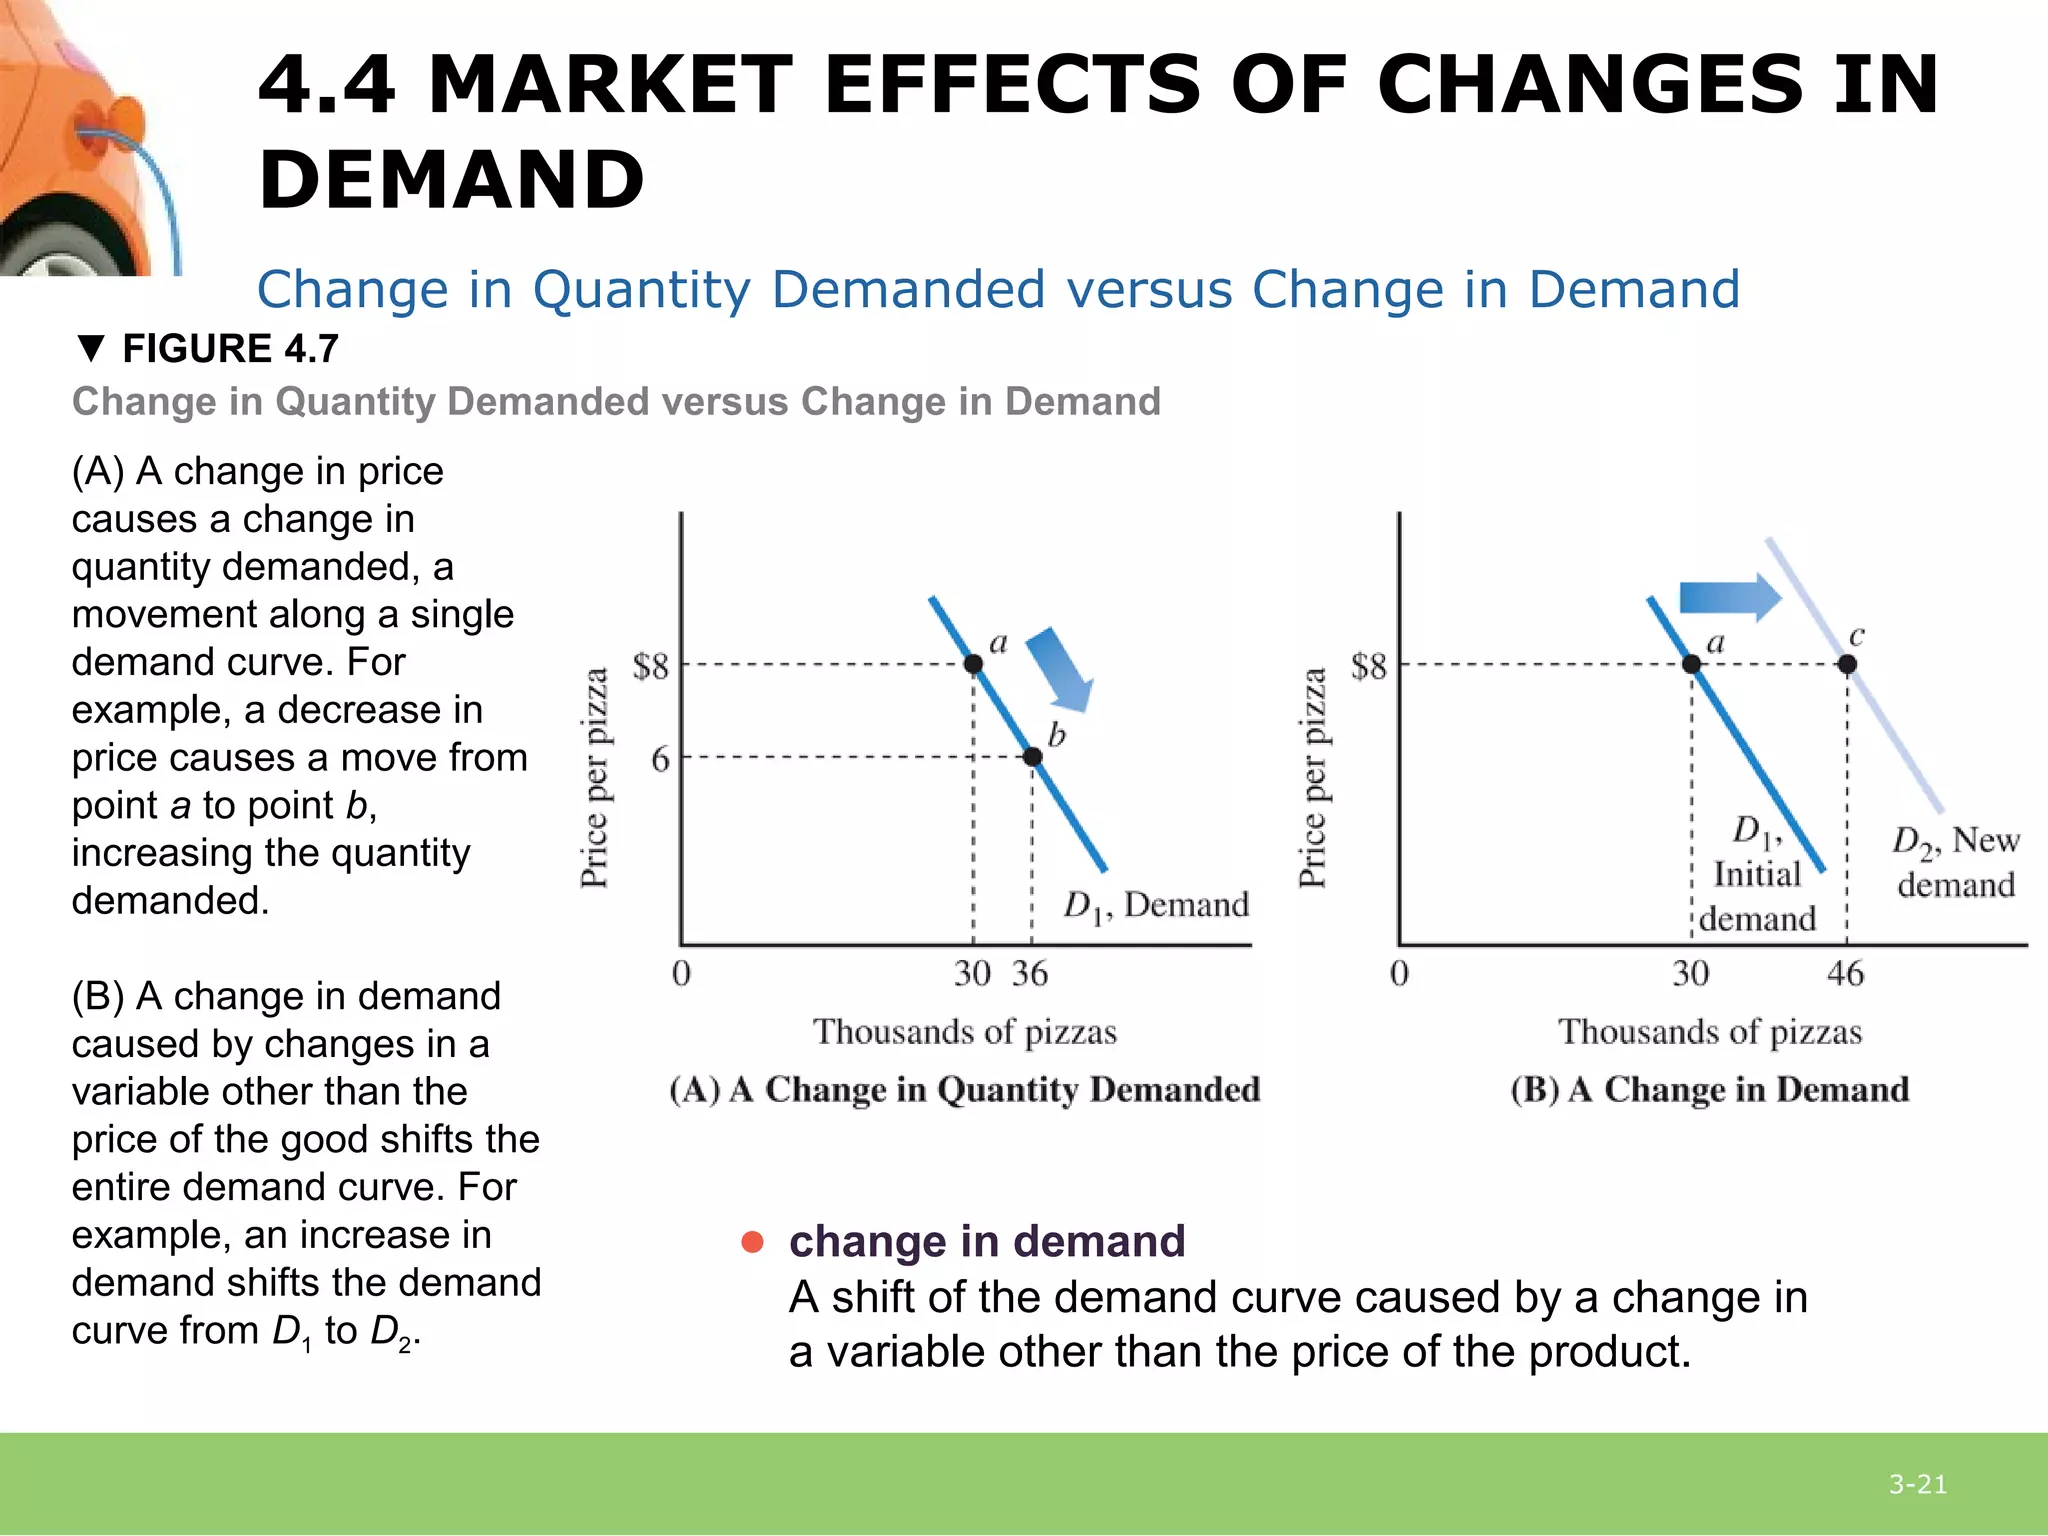
This document provides an overview of demand, supply, and market equilibrium. It defines key terms like demand, supply, quantity demanded, quantity supplied, and discusses the laws of demand and supply. Specifically, it explains that the law of demand states that as price increases, quantity demanded decreases, while the law of supply states that as price increases, quantity supplied also increases. It then discusses how individual demand and supply curves combine to form market demand and supply curves and how equilibrium is reached at the price where quantity demanded equals quantity supplied. Finally, it analyzes how changes in demand or supply can shift the curves and impact equilibrium price and quantity.
Mankiew chapter 7 Consumers, Producers, and the Efficiency of MarketsAbd ELRahman ALFar
What is consumer surplus? How is it related to the demand curve?
What is producer surplus? How is it related to the supply curve?
Do markets produce a desirable allocation of resources? Or could the market outcome be improved upon?
The Indian economy is classified into different sectors to simplify the analysis and understanding of economic activities. For Class 10, it's essential to grasp the sectors of the Indian economy, understand their characteristics, and recognize their importance. This guide will provide detailed notes on the Sectors of the Indian Economy Class 10, using specific long-tail keywords to enhance comprehension.
For more information, visit-www.vavaclasses.com
How to Create Map Views in the Odoo 17 ERPCeline George
The map views are useful for providing a geographical representation of data. They allow users to visualize and analyze the data in a more intuitive manner.
Operation “Blue Star” is the only event in the history of Independent India where the state went into war with its own people. Even after about 40 years it is not clear if it was culmination of states anger over people of the region, a political game of power or start of dictatorial chapter in the democratic setup.
The people of Punjab felt alienated from main stream due to denial of their just demands during a long democratic struggle since independence. As it happen all over the word, it led to militant struggle with great loss of lives of military, police and civilian personnel. Killing of Indira Gandhi and massacre of innocent Sikhs in Delhi and other India cities was also associated with this movement.
The French Revolution, which began in 1789, was a period of radical social and political upheaval in France. It marked the decline of absolute monarchies, the rise of secular and democratic republics, and the eventual rise of Napoleon Bonaparte. This revolutionary period is crucial in understanding the transition from feudalism to modernity in Europe.
For more information, visit-www.vavaclasses.com
Unit 8 - Information and Communication Technology (Paper I).pdfThiyagu K
This slides describes the basic concepts of ICT, basics of Email, Emerging Technology and Digital Initiatives in Education. This presentations aligns with the UGC Paper I syllabus.
We all have good and bad thoughts from time to time and situation to situation. We are bombarded daily with spiraling thoughts(both negative and positive) creating all-consuming feel , making us difficult to manage with associated suffering. Good thoughts are like our Mob Signal (Positive thought) amidst noise(negative thought) in the atmosphere. Negative thoughts like noise outweigh positive thoughts. These thoughts often create unwanted confusion, trouble, stress and frustration in our mind as well as chaos in our physical world. Negative thoughts are also known as “distorted thinking”.
Synthetic Fiber Construction in lab .pptxPavel ( NSTU)
Synthetic fiber production is a fascinating and complex field that blends chemistry, engineering, and environmental science. By understanding these aspects, students can gain a comprehensive view of synthetic fiber production, its impact on society and the environment, and the potential for future innovations. Synthetic fibers play a crucial role in modern society, impacting various aspects of daily life, industry, and the environment. ynthetic fibers are integral to modern life, offering a range of benefits from cost-effectiveness and versatility to innovative applications and performance characteristics. While they pose environmental challenges, ongoing research and development aim to create more sustainable and eco-friendly alternatives. Understanding the importance of synthetic fibers helps in appreciating their role in the economy, industry, and daily life, while also emphasizing the need for sustainable practices and innovation.
Students, digital devices and success - Andreas Schleicher - 27 May 2024..pptxEduSkills OECD
Andreas Schleicher presents at the OECD webinar ‘Digital devices in schools: detrimental distraction or secret to success?’ on 27 May 2024. The presentation was based on findings from PISA 2022 results and the webinar helped launch the PISA in Focus ‘Managing screen time: How to protect and equip students against distraction’ https://www.oecd-ilibrary.org/education/managing-screen-time_7c225af4-en and the OECD Education Policy Perspective ‘Students, digital devices and success’ can be found here - https://oe.cd/il/5yV
How to Split Bills in the Odoo 17 POS ModuleCeline George
Bills have a main role in point of sale procedure. It will help to track sales, handling payments and giving receipts to customers. Bill splitting also has an important role in POS. For example, If some friends come together for dinner and if they want to divide the bill then it is possible by POS bill splitting. This slide will show how to split bills in odoo 17 POS.
2. 3-2
Learning Objectives
1. Describe and explain the law of demand
2. Describe and explain the law of supply
3. Explain the role of price in reaching a market
equilibrium
4. Describe the effect of a change in demand on the
equilibrium price
5. Describe the effect of a change in supply on the
equilibrium price
6. Use information on price and quantity to
determine what caused a change in price
3. 3-3
DEMAND, SUPPLY, AND MARKET
EQUILIBRIUM
● perfectly competitive market
A market with many buyers and sellers of a
homogeneous product and no barriers to entry.
4. 3-4
● quantity demanded
The amount of a product that consumers are willing
and able to buy.
● demand schedule
A table that shows the relationship between the price of
a product and the quantity demanded, ceteris paribus.
4.1 THE DEMAND CURVE
5. 3-5
Here is a list of the variables that affect an individual consumer’s
decision, using the pizza market as an example:
• The price of the product (for example, the price of a pizza)
• The consumer’s income
• The price of substitute goods (for example, the prices of tacos or
sandwiches or other goods that can be consumed instead of pizza)
• The price of complementary goods (for example, the price of
lemonade or other goods consumed with pizza)
• The consumer’s preferences or tastes and advertising that may
influence preferences
• The consumer’s expectations about future prices
4.1 THE DEMAND CURVE (cont.)
6. 3-6
The Individual Demand Curve and the Law of Demand
● law of demand
There is a negative relationship between price and
quantity demanded, ceteris paribus.
● change in quantity demanded
A change in the quantity consumers are willing and
able to buy when the price changes; represented
graphically by movement along the demand curve.
● individual demand curve
A curve that shows the relationship between the price of a
good and quantity demanded by an individual consumer,
ceteris paribus.
4.1 THE DEMAND CURVE (cont.)
7. 3-7
The Individual Demand
Curve and the Law of
Demand
FIGURE 4.1
The Individual Demand Curve
According to the law of demand, the
higher the price, the smaller the
quantity demanded, everything else
being equal. Therefore, the demand
curve is negatively sloped: When
the price increases from $6 to $8,
the quantity demanded decreases
from seven pizzas per month (point
c) to four pizzas per month (point
b).
4.1 THE DEMAND CURVE (cont.)
8. 3-8
From Individual Demand to Market Demand
● market demand curve
A curve showing the relationship between price and quantity
demanded by all consumers, ceteris paribus.
FIGURE 4.2
From Individual to Market
Demand
The market demand equals the
sum of the demands of all
consumers. In this case, there are
only two, so at each price the
market quantity demanded equals
the quantity demanded by Al plus
the quantity demanded by Bea.
At a price of $8, Al’s quantity is
four pizzas (point a) and Bea’s
quantity is two pizzas (point b), so
the market quantity demanded is
six pizzas (point c).
Each consumer obeys the law of
demand, so the market demand
curve is negatively sloped.
4.1 THE DEMAND CURVE (cont.)
9. 3-9
LAW OF DEMAND AND CIGARETTES
APPLYING THE CONCEPTS #1: What is the Law of Demand?
A P P L I C A T I O N 1
• As price decreases and we move downward along the market demand for
cigarettes, the quantity of cigarettes demanded increases for two reasons.
First, people who smoked cigarettes at the original price respond to the
lower price by smoking more. Second, some people start smoking.
• A change in cigarette taxes in Canada illustrates the second effect, the
new-smoker effect. In 1994, several provinces in eastern Canada cut their
cigarette taxes and the price of cigarettes in the provinces decreased by
roughly 50 percent. Researchers tracked the choices of 591 youths from
the Waterloo Smoking Prevention Program, and concluded that the lower
price increased the smoking rate by roughly 17 percent.
10. 3-10
Suppose you ask the manager of a firm, “How much of your product
are you willing to produce and sell?” The manager’s decision about
how much to produce depends on many variables, including the
following, using pizza as an example:
• The price of the product (for example, the price per pizza)
• The wage paid to workers
• The price of materials (for example, the price of dough and
cheese)
• The cost of capital (for example, the cost of a pizza oven)
• The state of production technology (for example, the knowledge
used in making pizza)
• Producers’ expectations about future prices
• Taxes paid to the government or subsidies (payments from the
government to firms to produce a product)
4.2 THE SUPPLY CURVE
11. 3-11
The Individual Supply Curve and the Law of Supply
● supply schedule
A table that shows the relationship between the price
of a product and quantity supplied, ceteris paribus.
● individual supply curve
A curve showing the relationship between price and
quantity supplied by a single firm, ceteris paribus.
● quantity supplied
The amount of a product that firms are willing and
able to sell.
4.2 THE SUPPLY CURVE (cont.)
12. 3-12
The Individual Supply Curve and the Law of Supply
FIGURE 4.3
The Individual Supply Curve
The supply curve of an individual
supplier is positively sloped,
reflecting the law of supply.
As shown by point a, the quantity
supplied is zero at a price of $2,
indicating that the minimum
supply price is just above $2.
An increase in price increases the
quantity supplied to 100 pizzas at
a price of $4, to 200 pizzas at a
price of $6, and so on.
4.2 THE SUPPLY CURVE (cont.)
13. 3-13
The Individual Supply Curve and the Law of Supply
● law of supply
There is a positive relationship between
price and quantity supplied, ceteris
paribus.
● change in quantity supplied
A change in the quantity firms are willing
and able to sell when the price changes;
represented graphically by movement
along the supply curve.
● minimum supply price
The lowest price at which a product will
be supplied.
4.2 THE SUPPLY CURVE (cont.)
14. 3-14
Why Is the Individual Supply Curve Positively Sloped?
From Individual Supply to Market Supply
● market supply curve
A curve showing the relationship
between the market price and quantity
supplied by all firms, ceteris paribus.
M A R G I N A L P R I N C I P L E
Consistent with the Law of Supply, increase the level of an activity as long as
its marginal benefit exceeds its marginal cost. Choose the level at which the
marginal benefit equals the marginal cost.
4.2 THE SUPPLY CURVE (cont.)
15. 3-15
From Individual Supply to Market Supply
FIGURE 4.4
From Individual to Market Supply
The market supply is the sum
of the supplies of all firms. In
Panel A, Lola is a low-cost
producer who produces the
first pizza once the price rises
above $2 (shown by point a).
Panel B, Hiram is a high-cost
producer who doesn’t produce
pizza until the price rises
above $6 (shown by point f ).
To draw the market supply
curve, we sum the individual
supply curves horizontally. At a
price of $8, market supply is
400 pizzas (point m), equal to
300 from Lola (point d) plus
100 from Hiram (point g).
4.2 THE SUPPLY CURVE (cont.)
16. 3-16
From Individual Supply to Market Supply
FIGURE 4.5
The Market Supply
Curve with Many Firms
The market supply is the sum
of the supplies of all firms.
The minimum supply price is
$2 (point a), and the quantity
supplied increases by 10,000
for each $2 increase in price
to 10,000 at a price of $4
(point b), to 20,000 at a price
of $6 (point c), and so on.
4.2 THE SUPPLY CURVE (cont.)
17. 3-17
Why Is the Market Supply Curve Positively Sloped?
To explain the positive slope, consider the two responses by firms to an
increase in price:
• Individual firm. As we saw earlier, a higher price encourages a firm to
increase its output by purchasing more materials and hiring more
workers.
• New firms. In the long run, new firms can enter the market and
existing firms can expand their production facilities to produce more
output.
4.2 THE SUPPLY CURVE (cont.)
18. 3-18
LAW OF SUPPLY AND WOOLYMPICS
APPLYING THE CONCEPTS #2: What is the Law of Supply?
A P P L I C A T I O N 2
• In the 1990s, the world price of wool decreased by about 30 percent, and prices
have remained relatively low since then. Based on the law of supply, we would
expect the quantity of wool supplied in New Zealand and other exporters to
decrease, and that’s what happened. Land that formerly grew grass for wool-
producing sheep has been converted into other uses, including dairy products,
forestry, and the domestication of deer.
• There have been several attempts to revive the wool industry by boosting the
demand for wool and thus increase its price. The United Nations General
Assembly declared 2009 as the International Year of Natural Fibers, with the
objective “to raise awareness and stimulate demand for natural fibers.” In 2012,
the Federated Farmers of New Zealand proposed that sheep shearing be added
to the Commonwealth Games and Olympics as a demonstration sport. Of
course, it’s not obvious that Olympic shearing would increase the demand for
wool, and then there is the problem of what to do with all the sheared wool.
Extreme knitting?
19. 3-19
Excess Demand Causes the Price to Rise
● excess demand (shortage)
A situation in which, at the prevailing
price, the quantity demanded exceeds
the quantity supplied.
Excess Supply Causes the Price to Drop
● excess supply (surplus)
A situation in which the quantity supplied
exceeds the quantity demanded at the
prevailing price.
● market equilibrium
A situation in which the quantity
demanded equals the quantity supplied
at the prevailing market price.
4.3 MARKET EQUILIBRIUM: BRINGING
DEMAND AND SUPPLY TOGETHER
20. 3-20
FIGURE 4.6
Market Equilibrium
At the market equilibrium (point
a, with price = $8 and quantity =
30,000), the quantity supplied
equals the quantity demanded.
At a price below the equilibrium
price ($6), there is excess
demand—the quantity
demanded at point c exceeds
the quantity supplied at point b.
At a price above the equilibrium
price ($12), there is excess
supply—the quantity supplied at
point e exceeds the quantity
demanded at point d.
4.3 MARKET EQUILIBRIUM: BRINGING
DEMAND AND SUPPLY TOGETHER (cont.)
21. 3-21
Change in Quantity Demanded versus Change in Demand
▼ FIGURE 4.7
Change in Quantity Demanded versus Change in Demand
● change in demand
A shift of the demand curve caused by a change in
a variable other than the price of the product.
(A) A change in price
causes a change in
quantity demanded, a
movement along a single
demand curve. For
example, a decrease in
price causes a move from
point a to point b,
increasing the quantity
demanded.
(B) A change in demand
caused by changes in a
variable other than the
price of the good shifts the
entire demand curve. For
example, an increase in
demand shifts the demand
curve from D1 to D2.
4.4 MARKET EFFECTS OF CHANGES IN
DEMAND
22. 3-22
Increases in Demand Shift the Demand Curve
● normal good
A good for which an increase in income
increases demand.
● inferior good
A good for which an increase in income
decreases demand.
● substitutes
Two goods for which an increase in the price
of one good increases the demand for the
other good.
● complements
Two goods for which a decrease in the price
of one good increases the demand for the
other good.
4.4 MARKET EFFECTS OF CHANGES IN
DEMAND (cont.)
23. 3-23
change in demand
change in quantity demanded
change in quantity supplied
change in supply
complements
demand schedule
excess demand (shortage)
excess supply (surplus)
individual demand curve
individual supply curve
inferior good
K E Y T E R M S
law of demand
law of supply
market demand curve
market equilibrium
market supply curve
minimum supply price
normal good
perfectly competitive market
quantity demanded
quantity supplied
substitutes
supply schedule