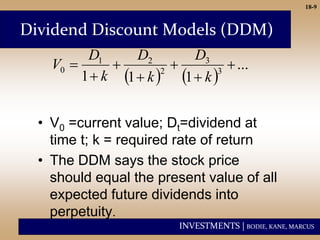
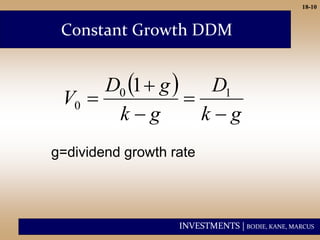
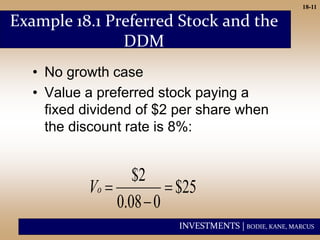
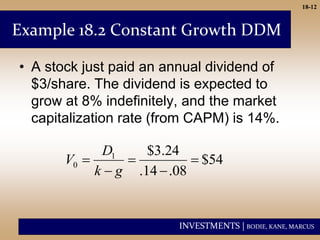
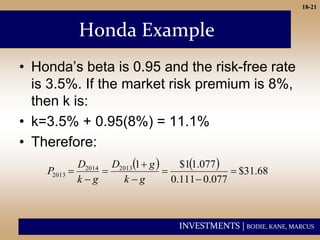
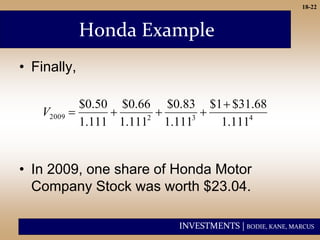
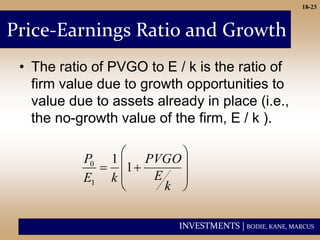
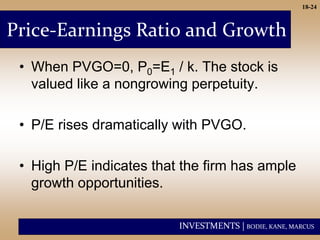
INVESTMENTS | BODIE, KANE, MARCUS
Copyright © 2011 by The McGraw-Hill Companies, Inc. All rights reserved.
McGraw-Hill/Irwin
CHAPTER 18
Equity Valuation Models
INVESTMENTS | BODIE, KANE, MARCUS
18-2
Valuation: Fundamental Analysis
• Fundamental analysis models a
company’s value by assessing its current
and future profitability.
• The purpose of fundamental analysis is to
identify mispriced stocks relative to some
measure of “true” value derived from
financial data.
INVESTMENTS | BODIE, KANE, MARCUS
18-3
• Balance Sheet Models
• Dividend Discount Models (DDM)
• Price/Earnings Ratios
• Free Cash Flow Models
Models of Equity Valuation
INVESTMENTS | BODIE, KANE, MARCUS
18-4
Valuation by Comparables
• Compare valuation ratios of firm to
industry averages.
• Ratios like price/sales are useful for
valuing start-ups that have yet to
generate positive earnings.
INVESTMENTS | BODIE, KANE, MARCUS
18-5
Limitations of Book Value
• Book values are based on historical cost,
not actual market values.
• It is possible, but uncommon, for market
value to be less than book value.
• “Floor” or minimum value is the liquidation
value per share.
• Tobin’s q is the ratio of market price to
replacement cost.
INVESTMENTS | BODIE, KANE, MARCUS
18-6
Intrinsic Value vs. Market Price
• The return on a stock is composed of
dividends and capital gains or losses.
• The expected HPR may be more or less
than the required rate of return, based on
the stock’s risk.
 
1 1 0
0
( ) ( )
Expected HPR= ( )
E D E P P
E r
P
 

INVESTMENTS | BODIE, KANE, MARCUS
18-7
Required Return
• CAPM gives the required return, k:
• If the stock is priced correctly, k
should equal expected return.
• k is the market capitalization rate.
( )
f M f
k r E r r
  
  
 
INVESTMENTS | BODIE, KANE, MARCUS
18-8
• The intrinsic value (IV) is the “true” value,
according to a model.
• The market value (MV) is the consensus
value of all market participants
Trading Signal:
IV > MV Buy
IV < MV Sell or Short Sell
IV = MV Hold or Fairly Priced
Intrinsic Value and Market Price
INVESTMENTS | BODIE, KANE, MARCUS
18-9
• V0 =current value; Dt=dividend at
time t; k = required rate of return
• The DDM says the stock price
should equal the present value of all
expected future dividends into
perpetuity.
Dividend Discount Models (DDM)
   
...
1
1
1 3
3
2
2
1
0 






k
D
k
D
k
D
V
INVESTMENTS | BODIE, KANE, MARCUS
18-10
Constant Growth DDM
 
g
k
D
g
k
g
D
V




 1
0
0
1
g=dividend growth rate
INVESTMENTS | BODIE, KANE, MARCUS
18-11
25
$
0
08
.
0
2
$



o
V
• No growth case
• Value a preferred stock paying a
fixed dividend of $2 per share when
the discount rate is 8%:
Example 18.1 Preferred Stock and the
DDM
INVESTMENTS | BODIE, KANE, MARCUS
18-12
Example 18.2 Constant Growth DDM
• A stock just paid an annual dividend of
$3/share. The dividend is expected to
grow at 8% indefinitely, and the market
capitalization rate (from CAPM) is 14%.
54
$
08
.
14
.
24
.
3
$
1
0 




g
k
D
V
INVESTMENTS | BODIE, KANE, MARCUS
18-13
DDM Implications
• The constant-growth rate DDM implies that a
stock’s value will be greater:
1.The larger its expected dividend per share.
2.The lower the market capitalization rate, k.
3.The higher the expected growth rate of
dividends.
• The stock price is expected to grow at the
same rate as dividends.
INVESTMENTS | BODIE, KANE, MARCUS
18-14
g = growth rate in dividends
ROE = Return on Equity for the firm
b = plowback or retention percentage rate
(1- dividend payout percentage rate)
Estimating Dividend Growth Rates
b
ROE
g x

INVESTMENTS | BODIE, KANE, MARCUS
18-15
Figure 18.1 Dividend Growth for Two
Earnings Reinvestment Policies
INVESTMENTS | BODIE, KANE, MARCUS
18-16
Present Value of Growth Opportunities
• The value of the firm equals the value
of the assets already in place, the no-
growth value of the firm,
• Plus the NPV of its future investments,
• Which is called the present value of
growth opportunities or PVGO.
INVESTMENTS | BODIE, KANE, MARCUS
18-17
Present Value of Growth Opportunities
• Price = No-growth value per share +
PVGO
1
0
E
P PVGO
k
 
INVESTMENTS | BODIE, KANE, MARCUS
18-18
• Firm reinvests 60% of its earnings in
projects with ROE of 10%,
capitalization rate is 15%. Expected
year-end dividend is $2/share, paid out
of earnings of $5/share.
• g=ROE x b = 10% x .6 = 6%
Example 18.4 Growth Opportunities
22
.
22
$
06
.
15
.
2
$
0 


P
INVESTMENTS | BODIE, KANE, MARCUS
18-19
Example 18.4 Growth Opportunities
• PVGO =Price per share – no-growth value per
share
22
.
22
$
06
.
15
.
2
$
0 


P
11
.
11
$
15
.
5
$
22
.
22
$ 



PVGO
INVESTMENTS | BODIE, KANE, MARCUS
18-20
Life Cycles and Multistage Growth Models
• Expected dividends for Honda:
2010 $.50 2012 $ .83
2011 $.66 2013 $1.00
• Since the dividend payout ratio is
30% and ROE is 11%, the “steady-
state” growth rate is 7.7%.
INVESTMENTS | BODIE, KANE, MARCUS
18-21
Honda Example
• Honda’s beta is 0.95 and the risk-free rate
is 3.5%. If the market risk premium is 8%,
then k is:
• k=3.5% + 0.95(8%) = 11.1%
• Therefore:
    68
.
31
$
077
.
0
111
.
0
077
.
1
1
$
1
2013
2014
2013 







g
k
g
D
g
k
D
P
INVESTMENTS | BODIE, KANE, MARCUS
18-22
Honda Example
• Finally,
• In 2009, one share of Honda Motor
Company Stock was worth $23.04.
4
3
2
2009
111
.
1
68
.
31
$
1
$
111
.
1
83
.
0
$
111
.
1
66
.
0
$
111
.
1
50
.
0
$ 




V
INVESTMENTS | BODIE, KANE, MARCUS
18-23
Price-Earnings Ratio and Growth
• The ratio of PVGO to E / k is the ratio of
firm value due to growth opportunities to
value due to assets already in place (i.e.,
the no-growth value of the firm, E / k ).










k
E
PVGO
k
E
P
1
1
1
0
INVESTMENTS | BODIE, KANE, MARCUS
18-24
Price-Earnings Ratio and Growth
• When PVGO=0, P0=E1 / k. The stock is
valued like a nongrowing perpetuity.
• P/E rises dramatically with PVGO.
• High P/E indicates that the firm has ample
growth opportunities.
INVESTMENTS | BODIE, KANE, MARCUS
18-25
Price-Earnings Ratio and Growth
• P/E increases:
– As ROE increases
– As plowback increases, as long as ROE>k
b
ROE
k
b
E
P
x
1
1
0



INVESTMENTS | BODIE, KANE, MARCUS
18-26
Table 18.3 Effect of ROE and Plowback on
Growth and the P/E Ratio
INVESTMENTS | BODIE, KANE, MARCUS
18-27
P/E and Growth Rate
• Wall Street rule of thumb: The growth rate
is roughly equal to the P/E ratio.
• “If the P/E ratio of Coca Cola is 15, you’d expect
the company to be growing at about 15% per
year, etc. But if the P/E ratio is less than the
growth rate, you may have found yourself a
bargain.”
Quote from Peter Lynch in One Up on Wall Street.
INVESTMENTS | BODIE, KANE, MARCUS
18-28
P/E Ratios and Stock Risk
• When risk is higher, k is higher;
therefore, P/E is lower.
1
P b
E k g



INVESTMENTS | BODIE, KANE, MARCUS
18-29
Pitfalls in P/E Analysis
• Use of accounting earnings
– Earnings Management
– Choices on GAAP
• Inflation
• Reported earnings fluctuate around the
business cycle
INVESTMENTS | BODIE, KANE, MARCUS
18-30
Figure 18.3 P/E Ratios of the S&P 500 Index
and Inflation
INVESTMENTS | BODIE, KANE, MARCUS
18-31
Figure 18.4 Earnings Growth for Two
Companies
INVESTMENTS | BODIE, KANE, MARCUS
18-32
Figure 18.6 P/E Ratios for Different
Industries, 2007
INVESTMENTS | BODIE, KANE, MARCUS
18-33
Other Comparative Value Approaches
• Price-to-book ratio
• Price-to-cash-flow ratio
• Price-to-sales ratio
INVESTMENTS | BODIE, KANE, MARCUS
18-34
Figure 18.7 Market Valuation Statistics
INVESTMENTS | BODIE, KANE, MARCUS
18-35
Free Cash Flow Approach
• Value the firm by discounting free cash
flow at WACC.
• Free cash flow to the firm, FCFF,
equals:
After tax EBIT
Plus depreciation
Minus capital expenditures
Minus increase in net working capital
INVESTMENTS | BODIE, KANE, MARCUS
18-36
Comparing the Valuation Models
• In practice
– Values from these models may differ
– Analysts are always forced to make
simplifying assumptions
INVESTMENTS | BODIE, KANE, MARCUS
18-37
The Aggregate Stock Market
• Explaining Past Behavior
• Forecasting the Stock Market
INVESTMENTS | BODIE, KANE, MARCUS
18-38
Table 18.4 S&P 500 Price Forecasts Under
Various Scenarios

Chap018.ppt

  • 1.
    INVESTMENTS | BODIE,KANE, MARCUS Copyright © 2011 by The McGraw-Hill Companies, Inc. All rights reserved. McGraw-Hill/Irwin CHAPTER 18 Equity Valuation Models
  • 2.
    INVESTMENTS | BODIE,KANE, MARCUS 18-2 Valuation: Fundamental Analysis • Fundamental analysis models a company’s value by assessing its current and future profitability. • The purpose of fundamental analysis is to identify mispriced stocks relative to some measure of “true” value derived from financial data.
  • 3.
    INVESTMENTS | BODIE,KANE, MARCUS 18-3 • Balance Sheet Models • Dividend Discount Models (DDM) • Price/Earnings Ratios • Free Cash Flow Models Models of Equity Valuation
  • 4.
    INVESTMENTS | BODIE,KANE, MARCUS 18-4 Valuation by Comparables • Compare valuation ratios of firm to industry averages. • Ratios like price/sales are useful for valuing start-ups that have yet to generate positive earnings.
  • 5.
    INVESTMENTS | BODIE,KANE, MARCUS 18-5 Limitations of Book Value • Book values are based on historical cost, not actual market values. • It is possible, but uncommon, for market value to be less than book value. • “Floor” or minimum value is the liquidation value per share. • Tobin’s q is the ratio of market price to replacement cost.
  • 6.
    INVESTMENTS | BODIE,KANE, MARCUS 18-6 Intrinsic Value vs. Market Price • The return on a stock is composed of dividends and capital gains or losses. • The expected HPR may be more or less than the required rate of return, based on the stock’s risk.   1 1 0 0 ( ) ( ) Expected HPR= ( ) E D E P P E r P   
  • 7.
    INVESTMENTS | BODIE,KANE, MARCUS 18-7 Required Return • CAPM gives the required return, k: • If the stock is priced correctly, k should equal expected return. • k is the market capitalization rate. ( ) f M f k r E r r        
  • 8.
    INVESTMENTS | BODIE,KANE, MARCUS 18-8 • The intrinsic value (IV) is the “true” value, according to a model. • The market value (MV) is the consensus value of all market participants Trading Signal: IV > MV Buy IV < MV Sell or Short Sell IV = MV Hold or Fairly Priced Intrinsic Value and Market Price
  • 9.
    INVESTMENTS | BODIE,KANE, MARCUS 18-9 • V0 =current value; Dt=dividend at time t; k = required rate of return • The DDM says the stock price should equal the present value of all expected future dividends into perpetuity. Dividend Discount Models (DDM)     ... 1 1 1 3 3 2 2 1 0        k D k D k D V
  • 10.
    INVESTMENTS | BODIE,KANE, MARCUS 18-10 Constant Growth DDM   g k D g k g D V      1 0 0 1 g=dividend growth rate
  • 11.
    INVESTMENTS | BODIE,KANE, MARCUS 18-11 25 $ 0 08 . 0 2 $    o V • No growth case • Value a preferred stock paying a fixed dividend of $2 per share when the discount rate is 8%: Example 18.1 Preferred Stock and the DDM
  • 12.
    INVESTMENTS | BODIE,KANE, MARCUS 18-12 Example 18.2 Constant Growth DDM • A stock just paid an annual dividend of $3/share. The dividend is expected to grow at 8% indefinitely, and the market capitalization rate (from CAPM) is 14%. 54 $ 08 . 14 . 24 . 3 $ 1 0      g k D V
  • 13.
    INVESTMENTS | BODIE,KANE, MARCUS 18-13 DDM Implications • The constant-growth rate DDM implies that a stock’s value will be greater: 1.The larger its expected dividend per share. 2.The lower the market capitalization rate, k. 3.The higher the expected growth rate of dividends. • The stock price is expected to grow at the same rate as dividends.
  • 14.
    INVESTMENTS | BODIE,KANE, MARCUS 18-14 g = growth rate in dividends ROE = Return on Equity for the firm b = plowback or retention percentage rate (1- dividend payout percentage rate) Estimating Dividend Growth Rates b ROE g x 
  • 15.
    INVESTMENTS | BODIE,KANE, MARCUS 18-15 Figure 18.1 Dividend Growth for Two Earnings Reinvestment Policies
  • 16.
    INVESTMENTS | BODIE,KANE, MARCUS 18-16 Present Value of Growth Opportunities • The value of the firm equals the value of the assets already in place, the no- growth value of the firm, • Plus the NPV of its future investments, • Which is called the present value of growth opportunities or PVGO.
  • 17.
    INVESTMENTS | BODIE,KANE, MARCUS 18-17 Present Value of Growth Opportunities • Price = No-growth value per share + PVGO 1 0 E P PVGO k  
  • 18.
    INVESTMENTS | BODIE,KANE, MARCUS 18-18 • Firm reinvests 60% of its earnings in projects with ROE of 10%, capitalization rate is 15%. Expected year-end dividend is $2/share, paid out of earnings of $5/share. • g=ROE x b = 10% x .6 = 6% Example 18.4 Growth Opportunities 22 . 22 $ 06 . 15 . 2 $ 0    P
  • 19.
    INVESTMENTS | BODIE,KANE, MARCUS 18-19 Example 18.4 Growth Opportunities • PVGO =Price per share – no-growth value per share 22 . 22 $ 06 . 15 . 2 $ 0    P 11 . 11 $ 15 . 5 $ 22 . 22 $     PVGO
  • 20.
    INVESTMENTS | BODIE,KANE, MARCUS 18-20 Life Cycles and Multistage Growth Models • Expected dividends for Honda: 2010 $.50 2012 $ .83 2011 $.66 2013 $1.00 • Since the dividend payout ratio is 30% and ROE is 11%, the “steady- state” growth rate is 7.7%.
  • 21.
    INVESTMENTS | BODIE,KANE, MARCUS 18-21 Honda Example • Honda’s beta is 0.95 and the risk-free rate is 3.5%. If the market risk premium is 8%, then k is: • k=3.5% + 0.95(8%) = 11.1% • Therefore:     68 . 31 $ 077 . 0 111 . 0 077 . 1 1 $ 1 2013 2014 2013         g k g D g k D P
  • 22.
    INVESTMENTS | BODIE,KANE, MARCUS 18-22 Honda Example • Finally, • In 2009, one share of Honda Motor Company Stock was worth $23.04. 4 3 2 2009 111 . 1 68 . 31 $ 1 $ 111 . 1 83 . 0 $ 111 . 1 66 . 0 $ 111 . 1 50 . 0 $      V
  • 23.
    INVESTMENTS | BODIE,KANE, MARCUS 18-23 Price-Earnings Ratio and Growth • The ratio of PVGO to E / k is the ratio of firm value due to growth opportunities to value due to assets already in place (i.e., the no-growth value of the firm, E / k ).           k E PVGO k E P 1 1 1 0
  • 24.
    INVESTMENTS | BODIE,KANE, MARCUS 18-24 Price-Earnings Ratio and Growth • When PVGO=0, P0=E1 / k. The stock is valued like a nongrowing perpetuity. • P/E rises dramatically with PVGO. • High P/E indicates that the firm has ample growth opportunities.
  • 25.
    INVESTMENTS | BODIE,KANE, MARCUS 18-25 Price-Earnings Ratio and Growth • P/E increases: – As ROE increases – As plowback increases, as long as ROE>k b ROE k b E P x 1 1 0   
  • 26.
    INVESTMENTS | BODIE,KANE, MARCUS 18-26 Table 18.3 Effect of ROE and Plowback on Growth and the P/E Ratio
  • 27.
    INVESTMENTS | BODIE,KANE, MARCUS 18-27 P/E and Growth Rate • Wall Street rule of thumb: The growth rate is roughly equal to the P/E ratio. • “If the P/E ratio of Coca Cola is 15, you’d expect the company to be growing at about 15% per year, etc. But if the P/E ratio is less than the growth rate, you may have found yourself a bargain.” Quote from Peter Lynch in One Up on Wall Street.
  • 28.
    INVESTMENTS | BODIE,KANE, MARCUS 18-28 P/E Ratios and Stock Risk • When risk is higher, k is higher; therefore, P/E is lower. 1 P b E k g   
  • 29.
    INVESTMENTS | BODIE,KANE, MARCUS 18-29 Pitfalls in P/E Analysis • Use of accounting earnings – Earnings Management – Choices on GAAP • Inflation • Reported earnings fluctuate around the business cycle
  • 30.
    INVESTMENTS | BODIE,KANE, MARCUS 18-30 Figure 18.3 P/E Ratios of the S&P 500 Index and Inflation
  • 31.
    INVESTMENTS | BODIE,KANE, MARCUS 18-31 Figure 18.4 Earnings Growth for Two Companies
  • 32.
    INVESTMENTS | BODIE,KANE, MARCUS 18-32 Figure 18.6 P/E Ratios for Different Industries, 2007
  • 33.
    INVESTMENTS | BODIE,KANE, MARCUS 18-33 Other Comparative Value Approaches • Price-to-book ratio • Price-to-cash-flow ratio • Price-to-sales ratio
  • 34.
    INVESTMENTS | BODIE,KANE, MARCUS 18-34 Figure 18.7 Market Valuation Statistics
  • 35.
    INVESTMENTS | BODIE,KANE, MARCUS 18-35 Free Cash Flow Approach • Value the firm by discounting free cash flow at WACC. • Free cash flow to the firm, FCFF, equals: After tax EBIT Plus depreciation Minus capital expenditures Minus increase in net working capital
  • 36.
    INVESTMENTS | BODIE,KANE, MARCUS 18-36 Comparing the Valuation Models • In practice – Values from these models may differ – Analysts are always forced to make simplifying assumptions
  • 37.
    INVESTMENTS | BODIE,KANE, MARCUS 18-37 The Aggregate Stock Market • Explaining Past Behavior • Forecasting the Stock Market
  • 38.
    INVESTMENTS | BODIE,KANE, MARCUS 18-38 Table 18.4 S&P 500 Price Forecasts Under Various Scenarios