SlideShare a Scribd company logo
3.1
Chapter 3
Data and Signals
Copyright © The McGraw-Hill Companies, Inc. Permission required for reproduction or display.
3.2
To be transmitted, data must be
transformed to electromagnetic signals.
Note
3.3
3-1 ANALOG AND DIGITAL3-1 ANALOG AND DIGITAL
Data can beData can be analoganalog oror digitaldigital. The term. The term analog dataanalog data refersrefers
to information that is continuous;to information that is continuous; digital datadigital data refers torefers to
information that has discrete states. Analog data take oninformation that has discrete states. Analog data take on
continuous values. Digital data take on discrete values.continuous values. Digital data take on discrete values.
 Analog and Digital Data
 Analog and Digital Signals
 Periodic and Nonperiodic Signals
Topics discussed in this section:Topics discussed in this section:
3.4
Analog and Digital Data
 Data can be analog or digital.
 Analog data are continuous and take
continuous values.
 Digital data have discrete states and take
discrete values.
3.5
Analog and Digital Signals
• Signals can be analog or digital.
• Analog signals can have an infinite number
of values in a range.
• Digital signals can have only a limited
number of values.
3.6
Figure 3.1 Comparison of analog and digital signals
3.7
3-2 PERIODIC ANALOG SIGNALS3-2 PERIODIC ANALOG SIGNALS
In data communications, we commonly use periodic
analog signals and nonperiodic digital signals.
Periodic analog signals can be classified asPeriodic analog signals can be classified as simplesimple oror
compositecomposite. A simple periodic analog signal, a. A simple periodic analog signal, a sine wavesine wave,,
cannot be decomposed into simpler signals. A compositecannot be decomposed into simpler signals. A composite
periodic analog signal is composed of multiple sineperiodic analog signal is composed of multiple sine
waves.waves.
 Sine Wave
 Wavelength
 Time and Frequency Domain
 Composite Signals
 Bandwidth
Topics discussed in this section:Topics discussed in this section:
3.8
Figure 3.2 A sine wave
3.9
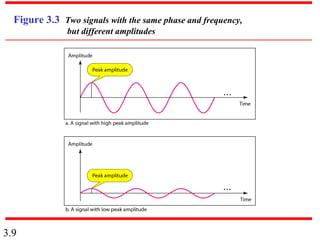
Figure 3.3 Two signals with the same phase and frequency,
but different amplitudes
3.10
Frequency and period are the inverse of
each other.
Note
3.11
Figure 3.4 Two signals with the same amplitude and phase,
but different frequencies
3.12
Table 3.1 Units of period and frequency
3.13
The power we use at home has a frequency of 60 Hz.
The period of this sine wave can be determined as
follows:
Example 3.1
3.14
The period of a signal is 100 ms. What is its frequency in
kilohertz?
Example 3.2
Solution
First we change 100 ms to seconds, and then we
calculate the frequency from the period (1 Hz = 10−3
kHz).
3.15
Frequency
• Frequency is the rate of change with respect
to time.
• Change in a short span of time means high
frequency.
• Change over a long span of
time means low frequency.
3.16
If a signal does not change at all, its
frequency is zero.
If a signal changes instantaneously, its
frequency is infinite.
Note
3.17
Phase describes the position of the
waveform relative to time 0.
Note
3.18
Figure 3.5 Three sine waves with the same amplitude and frequency,
but different phases
3.19
A sine wave is offset 1/6 cycle with respect to time 0.
What is its phase in degrees and radians?
Example 3.3
Solution
We know that 1 complete cycle is 360°. Therefore, 1/6
cycle is
3.20
Figure 3.6 Wavelength and period
3.21
Figure 3.7 The time-domain and frequency-domain plots of a sine wave
3.22
A complete sine wave in the time
domain can be represented by one
single spike in the frequency domain.
Note
3.23
The frequency domain is more compact and
useful when we are dealing with more than one
sine wave. For example, Figure 3.8 shows three
sine waves, each with different amplitude and
frequency. All can be represented by three
spikes in the frequency domain.
Example 3.7
3.24
Figure 3.8 The time domain and frequency domain of three sine waves
3.25
Signals and Communication
 A single-frequency sine wave is not
useful in data communications
 We need to send a composite signal, a
signal made of many simple sine
waves.
 According to Fourier analysis, any
composite signal is a combination of
simple sine waves with different
frequencies, amplitudes, and phases.
3.26
Composite Signals and
Periodicity
 If the composite signal is periodic, the
decomposition gives a series of signals
with discrete frequencies.
 If the composite signal is nonperiodic, the
decomposition gives a combination of
sine waves with continuous frequencies.
3.27
Figure 3.9 shows a periodic composite signal with
frequency f. This type of signal is not typical of those
found in data communications. We can consider it to be
three alarm systems, each with a different frequency.
The analysis of this signal can give us a good
understanding of how to decompose signals.
Example 3.4
3.28
Figure 3.9 A composite periodic signal
3.29
Figure 3.10 Decomposition of a composite periodic signal in the time and
frequency domains
3.30
Figure 3.11 shows a nonperiodic composite signal. It
can be the signal created by a microphone or a telephone
set when a word or two is pronounced. In this case, the
composite signal cannot be periodic, because that
implies that we are repeating the same word or words
with exactly the same tone.
Example 3.5
3.31
Figure 3.11 The time and frequency domains of a nonperiodic signal
3.32
Bandwidth and Signal
Frequency
 The bandwidth of a composite signal is
the difference between the highest and
the lowest frequencies contained in that
signal.
3.33
Figure 3.12 The bandwidth of periodic and nonperiodic composite signals
3.34
If a periodic signal is decomposed into five sine waves
with frequencies of 100, 300, 500, 700, and 900 Hz, what
is its bandwidth? Draw the spectrum, assuming all
components have a maximum amplitude of 10 V.
Solution
Let fh be the highest frequency, fl the lowest frequency,
and B the bandwidth. Then
Example 3.6
The spectrum has only five spikes, at 100, 300, 500, 700,
and 900 Hz (see Figure 3.13).
3.35
Figure 3.13 The bandwidth for Example 3.6
3.36
A periodic signal has a bandwidth of 20 Hz. The highest
frequency is 60 Hz. What is the lowest frequency? Draw
the spectrum if the signal contains all frequencies of the
same amplitude.
Solution
Let fh be the highest frequency, fl the lowest frequency,
and B the bandwidth. Then
Example 3.7
The spectrum contains all integer frequencies. We show
this by a series of spikes (see Figure 3.14).
3.37
Figure 3.14 The bandwidth for Example 3.7
3.38
A nonperiodic composite signal has a bandwidth of 200
kHz, with a middle frequency of 140 kHz and peak
amplitude of 20 V. The two extreme frequencies have an
amplitude of 0. Draw the frequency domain of the
signal.
Solution
The lowest frequency must be at 40 kHz and the highest
at 240 kHz. Figure 3.15 shows the frequency domain
and the bandwidth.
Example 3.8
3.39
Figure 3.15 The bandwidth for Example 3.8
3.40
An example of a nonperiodic composite signal is the
signal propagated by an AM radio station. In the United
States, each AM radio station is assigned a 10-kHz
bandwidth. The total bandwidth dedicated to AM radio
ranges from 530 to 1700 kHz. We will show the rationale
behind this 10-kHz bandwidth in Chapter 5.
Example 3.9
3.41
Another example of a nonperiodic composite signal is
the signal propagated by an FM radio station. In the
United States, each FM radio station is assigned a 200-
kHz bandwidth. The total bandwidth dedicated to FM
radio ranges from 88 to 108 MHz. We will show the
rationale behind this 200-kHz bandwidth in Chapter 5.
Example 3.10
3.42
Another example of a nonperiodic composite signal is
the signal received by an old-fashioned analog black-
and-white TV. A TV screen is made up of pixels. If we
assume a resolution of 525 × 700, we have 367,500
pixels per screen. If we scan the screen 30 times per
second, this is 367,500 × 30 = 11,025,000 pixels per
second. The worst-case scenario is alternating black and
white pixels. We can send 2 pixels per cycle. Therefore,
we need 11,025,000 / 2 = 5,512,500 cycles per second, or
Hz. The bandwidth needed is 5.5125 MHz.
Example 3.11
3.43
Fourier analysis is a tool that changes a
time domain signal to a frequency
domain signal and vice versa.
Note
Fourier Analysis
3.44
Fourier Series
 Every composite periodic signal can be
represented with a series of sine and cosine
functions.
 The functions are integral harmonics of the
fundamental frequency “f” of the composite
signal.
 Using the series we can decompose any
periodic signal into its harmonics.
3.45
Fourier Series
3.46
Examples of Signals and the
Fourier Series Representation
3.47
Sawtooth Signal
3.48
Fourier Transform
 Fourier Transform gives the frequency
domain of a nonperiodic time domain
signal.
3.49
Example of a Fourier
Transform
3.50
Inverse Fourier Transform
3.51
Time limited and Band limited
Signals
 A time limited signal is a signal for which
the amplitude s(t) = 0 for t > T1 and t < T2
 A band limited signal is a signal for which
the amplitude S(f) = 0 for f > F1 and f < F2

More Related Content

What's hot

Distance Vector Routing
Distance Vector RoutingDistance Vector Routing
Distance Vector Routing
ShouvikDhali
 
Topic: Virtual circuit & message switching
Topic: Virtual circuit & message switchingTopic: Virtual circuit & message switching
Topic: Virtual circuit & message switching
Dr Rajiv Srivastava
 
Congestion control in TCP
Congestion control in TCPCongestion control in TCP
Congestion control in TCP
selvakumar_b1985
 
Computer networks - Channelization
Computer networks - ChannelizationComputer networks - Channelization
Computer networks - Channelization
Elambaruthi Elambaruthi
 
Cdma2000
Cdma2000Cdma2000
Cdma2000
vivek kumar
 
HDLC(high level data link control)
HDLC(high level data link control)HDLC(high level data link control)
HDLC(high level data link control)Anand Biradar
 
Chapter 13
Chapter 13Chapter 13
Chapter 13
Faisal Mehmood
 
Classification of routing protocols
Classification of routing protocolsClassification of routing protocols
Classification of routing protocols
Menaga Selvaraj
 
Wdm benefits and performance parameters
Wdm benefits and performance parametersWdm benefits and performance parameters
Wdm benefits and performance parameters
CKSunith1
 
Chapter 3
Chapter 3Chapter 3
Chapter 3
Faisal Mehmood
 
Ch 20 UNICAST ROUTING SECTION 2
Ch 20   UNICAST ROUTING  SECTION  2Ch 20   UNICAST ROUTING  SECTION  2
Ch 20 UNICAST ROUTING SECTION 2
Hossam El-Deen Osama
 
Chapter 2
Chapter 2Chapter 2
Chapter 2
Faisal Mehmood
 
Line coding presentation
Line coding presentationLine coding presentation
Line coding presentation
Dibyendu Porey
 
Data Communication & Computer network: Channel capacity
Data Communication & Computer network: Channel capacityData Communication & Computer network: Channel capacity
Data Communication & Computer network: Channel capacity
Dr Rajiv Srivastava
 
Digital Data, Digital Signal | Scrambling Techniques
Digital Data, Digital Signal | Scrambling TechniquesDigital Data, Digital Signal | Scrambling Techniques
Digital Data, Digital Signal | Scrambling Techniques
Biplap Bhattarai
 
Circuit Switching, Packet Switching, Virtual Circuit Networks and Datagram Ne...
Circuit Switching, Packet Switching, Virtual Circuit Networks and Datagram Ne...Circuit Switching, Packet Switching, Virtual Circuit Networks and Datagram Ne...
Circuit Switching, Packet Switching, Virtual Circuit Networks and Datagram Ne...
Kaushik Panta
 
HDLC
HDLCHDLC
Chapter 3 - Data and Signals
Chapter 3 - Data and SignalsChapter 3 - Data and Signals
Chapter 3 - Data and Signals
Wayne Jones Jnr
 
Image Enhancement - Point Processing
Image Enhancement - Point ProcessingImage Enhancement - Point Processing
Image Enhancement - Point Processing
Gayathri31093
 

What's hot (20)

Distance Vector Routing
Distance Vector RoutingDistance Vector Routing
Distance Vector Routing
 
Topic: Virtual circuit & message switching
Topic: Virtual circuit & message switchingTopic: Virtual circuit & message switching
Topic: Virtual circuit & message switching
 
Congestion control in TCP
Congestion control in TCPCongestion control in TCP
Congestion control in TCP
 
Computer networks - Channelization
Computer networks - ChannelizationComputer networks - Channelization
Computer networks - Channelization
 
Cdma2000
Cdma2000Cdma2000
Cdma2000
 
HDLC(high level data link control)
HDLC(high level data link control)HDLC(high level data link control)
HDLC(high level data link control)
 
Chapter 13
Chapter 13Chapter 13
Chapter 13
 
Classification of routing protocols
Classification of routing protocolsClassification of routing protocols
Classification of routing protocols
 
Wdm benefits and performance parameters
Wdm benefits and performance parametersWdm benefits and performance parameters
Wdm benefits and performance parameters
 
Chapter 3
Chapter 3Chapter 3
Chapter 3
 
Ch 20 UNICAST ROUTING SECTION 2
Ch 20   UNICAST ROUTING  SECTION  2Ch 20   UNICAST ROUTING  SECTION  2
Ch 20 UNICAST ROUTING SECTION 2
 
Chapter 2
Chapter 2Chapter 2
Chapter 2
 
Line coding presentation
Line coding presentationLine coding presentation
Line coding presentation
 
Data Communication & Computer network: Channel capacity
Data Communication & Computer network: Channel capacityData Communication & Computer network: Channel capacity
Data Communication & Computer network: Channel capacity
 
Digital Data, Digital Signal | Scrambling Techniques
Digital Data, Digital Signal | Scrambling TechniquesDigital Data, Digital Signal | Scrambling Techniques
Digital Data, Digital Signal | Scrambling Techniques
 
Circuit Switching, Packet Switching, Virtual Circuit Networks and Datagram Ne...
Circuit Switching, Packet Switching, Virtual Circuit Networks and Datagram Ne...Circuit Switching, Packet Switching, Virtual Circuit Networks and Datagram Ne...
Circuit Switching, Packet Switching, Virtual Circuit Networks and Datagram Ne...
 
HDLC
HDLCHDLC
HDLC
 
Gsm radio-interface
Gsm radio-interfaceGsm radio-interface
Gsm radio-interface
 
Chapter 3 - Data and Signals
Chapter 3 - Data and SignalsChapter 3 - Data and Signals
Chapter 3 - Data and Signals
 
Image Enhancement - Point Processing
Image Enhancement - Point ProcessingImage Enhancement - Point Processing
Image Enhancement - Point Processing
 

Viewers also liked

Library website features (February 2016)
Library website features (February 2016)Library website features (February 2016)
Library website features (February 2016)
lis02215
 
CMU Portugal inRes Initiative Presentation April 2014
CMU Portugal inRes Initiative Presentation April 2014CMU Portugal inRes Initiative Presentation April 2014
CMU Portugal inRes Initiative Presentation April 2014
CMUPortugal_
 
Food Safety Webcast: Allergen Management
Food Safety Webcast: Allergen ManagementFood Safety Webcast: Allergen Management
Food Safety Webcast: Allergen Management
Foodservice Equipment & Supplies Magazine
 
201502 cmu portugal_highlights
201502 cmu portugal_highlights201502 cmu portugal_highlights
201502 cmu portugal_highlights
CMUPortugal_
 
Ch3 5 v1
Ch3 5 v1Ch3 5 v1
Ch3 5 v1
bhagavanprasad
 
Research guides tour (February 2016)
Research guides tour (February 2016)Research guides tour (February 2016)
Research guides tour (February 2016)
lis02215
 
The analytic hero's journey
The analytic hero's journeyThe analytic hero's journey
The analytic hero's journey
3Sixty Insights
 
Naperville north tech workshop day 1
Naperville north tech workshop day 1Naperville north tech workshop day 1
Naperville north tech workshop day 1joeewilson
 
10 Things About the Library Website
10 Things About the Library Website10 Things About the Library Website
10 Things About the Library Website
lis02215
 
Presentation encuesta
Presentation encuesta Presentation encuesta
Presentation encuesta
Pedro Antonio García López
 
Construyendo la reputacion corporativa desde el principio
Construyendo la reputacion corporativa desde el principioConstruyendo la reputacion corporativa desde el principio
Construyendo la reputacion corporativa desde el principio
Pedro Antonio García López
 
Why AWS's Redshift is a Game Changer
Why AWS's Redshift is a Game ChangerWhy AWS's Redshift is a Game Changer
Why AWS's Redshift is a Game Changer
3Sixty Insights
 
Shopper insights Tracking
Shopper insights Tracking Shopper insights Tracking
Shopper insights Tracking
Pedro Antonio García López
 
Chapter01
Chapter01Chapter01
Chapter01
bhagavanprasad
 
Presentation1 karen-mc-clintock
Presentation1 karen-mc-clintockPresentation1 karen-mc-clintock
Presentation1 karen-mc-clintock
MilliCanada
 
The Analytic Hero’s Journey
The Analytic Hero’s JourneyThe Analytic Hero’s Journey
The Analytic Hero’s Journey3Sixty Insights
 
Investing in the Front End of Compliance
Investing in the Front End of ComplianceInvesting in the Front End of Compliance
Investing in the Front End of Compliance
3Sixty Insights
 
Research Guides Tour
Research Guides TourResearch Guides Tour
Research Guides Tour
lis02215
 
Ch4 1 v1
Ch4 1 v1Ch4 1 v1
Ch4 1 v1
bhagavanprasad
 
Ch5 1 v1
Ch5 1 v1Ch5 1 v1
Ch5 1 v1
bhagavanprasad
 

Viewers also liked (20)

Library website features (February 2016)
Library website features (February 2016)Library website features (February 2016)
Library website features (February 2016)
 
CMU Portugal inRes Initiative Presentation April 2014
CMU Portugal inRes Initiative Presentation April 2014CMU Portugal inRes Initiative Presentation April 2014
CMU Portugal inRes Initiative Presentation April 2014
 
Food Safety Webcast: Allergen Management
Food Safety Webcast: Allergen ManagementFood Safety Webcast: Allergen Management
Food Safety Webcast: Allergen Management
 
201502 cmu portugal_highlights
201502 cmu portugal_highlights201502 cmu portugal_highlights
201502 cmu portugal_highlights
 
Ch3 5 v1
Ch3 5 v1Ch3 5 v1
Ch3 5 v1
 
Research guides tour (February 2016)
Research guides tour (February 2016)Research guides tour (February 2016)
Research guides tour (February 2016)
 
The analytic hero's journey
The analytic hero's journeyThe analytic hero's journey
The analytic hero's journey
 
Naperville north tech workshop day 1
Naperville north tech workshop day 1Naperville north tech workshop day 1
Naperville north tech workshop day 1
 
10 Things About the Library Website
10 Things About the Library Website10 Things About the Library Website
10 Things About the Library Website
 
Presentation encuesta
Presentation encuesta Presentation encuesta
Presentation encuesta
 
Construyendo la reputacion corporativa desde el principio
Construyendo la reputacion corporativa desde el principioConstruyendo la reputacion corporativa desde el principio
Construyendo la reputacion corporativa desde el principio
 
Why AWS's Redshift is a Game Changer
Why AWS's Redshift is a Game ChangerWhy AWS's Redshift is a Game Changer
Why AWS's Redshift is a Game Changer
 
Shopper insights Tracking
Shopper insights Tracking Shopper insights Tracking
Shopper insights Tracking
 
Chapter01
Chapter01Chapter01
Chapter01
 
Presentation1 karen-mc-clintock
Presentation1 karen-mc-clintockPresentation1 karen-mc-clintock
Presentation1 karen-mc-clintock
 
The Analytic Hero’s Journey
The Analytic Hero’s JourneyThe Analytic Hero’s Journey
The Analytic Hero’s Journey
 
Investing in the Front End of Compliance
Investing in the Front End of ComplianceInvesting in the Front End of Compliance
Investing in the Front End of Compliance
 
Research Guides Tour
Research Guides TourResearch Guides Tour
Research Guides Tour
 
Ch4 1 v1
Ch4 1 v1Ch4 1 v1
Ch4 1 v1
 
Ch5 1 v1
Ch5 1 v1Ch5 1 v1
Ch5 1 v1
 

Similar to Ch3 1 v1

computer networks
computer networkscomputer networks
computer networks
vimalraman
 
3. Data and Signals-1.ppt
3. Data and Signals-1.ppt3. Data and Signals-1.ppt
3. Data and Signals-1.ppt
test22333
 
ch3_1_v1.ppt
ch3_1_v1.pptch3_1_v1.ppt
ch3_1_v1.ppt
Mohd Saifudeen
 
Ch03
Ch03Ch03
Computer Networks/Computer Engineering.pdf
Computer Networks/Computer Engineering.pdfComputer Networks/Computer Engineering.pdf
Computer Networks/Computer Engineering.pdf
abdnazar2003
 
Ch3Data communication and networking by neha g. kurale
Ch3Data communication and networking by neha g. kuraleCh3Data communication and networking by neha g. kurale
Ch3Data communication and networking by neha g. kurale
Neha Kurale
 
Lecture-3 Data Communication ~www.fida.com.bd
Lecture-3 Data Communication ~www.fida.com.bdLecture-3 Data Communication ~www.fida.com.bd
Lecture-3 Data Communication ~www.fida.com.bd
QUT (Queensland University of Technology)
 
Data and Signals.ppt
Data and Signals.pptData and Signals.ppt
Data and Signals.ppt
ChanderThukral
 
Lecture 2.ppt
Lecture 2.pptLecture 2.ppt
Lecture 2.ppt
AmirKhan877722
 
Ch03-Data And Signals
Ch03-Data And SignalsCh03-Data And Signals
Ch03-Data And Signals
asadawan123
 
Data and Signals
Data and SignalsData and Signals
Data and SignalsTechiNerd
 
Chapter 3 data and signals computer_network
Chapter 3 data and signals  computer_networkChapter 3 data and signals  computer_network
Chapter 3 data and signals computer_network
Dhairya Joshi
 
03 Data and_Signals
03 Data and_Signals03 Data and_Signals
03 Data and_Signals
Ahmar Hashmi
 
data-signal-slides.pdf
data-signal-slides.pdfdata-signal-slides.pdf
data-signal-slides.pdf
HanumanJadhav
 
Data and signals.ppt
Data and signals.pptData and signals.ppt
Data and signals.ppt
AyeCS11
 
Data Communications and Networking ch03
Data Communications and Networking  ch03Data Communications and Networking  ch03
Data Communications and Networking ch03
ssuserdf9c52
 
Ch03
Ch03Ch03
Ch03H K
 
ch03.pdf
ch03.pdfch03.pdf
ch03.pdf
researchict
 

Similar to Ch3 1 v1 (20)

computer networks
computer networkscomputer networks
computer networks
 
3. Data and Signals-1.ppt
3. Data and Signals-1.ppt3. Data and Signals-1.ppt
3. Data and Signals-1.ppt
 
ch3_1_v1.ppt
ch3_1_v1.pptch3_1_v1.ppt
ch3_1_v1.ppt
 
Ch03
Ch03Ch03
Ch03
 
Computer Networks/Computer Engineering.pdf
Computer Networks/Computer Engineering.pdfComputer Networks/Computer Engineering.pdf
Computer Networks/Computer Engineering.pdf
 
Ch3Data communication and networking by neha g. kurale
Ch3Data communication and networking by neha g. kuraleCh3Data communication and networking by neha g. kurale
Ch3Data communication and networking by neha g. kurale
 
Lecture-3 Data Communication ~www.fida.com.bd
Lecture-3 Data Communication ~www.fida.com.bdLecture-3 Data Communication ~www.fida.com.bd
Lecture-3 Data Communication ~www.fida.com.bd
 
Data and Signals.ppt
Data and Signals.pptData and Signals.ppt
Data and Signals.ppt
 
Lecture 2.ppt
Lecture 2.pptLecture 2.ppt
Lecture 2.ppt
 
Ch03-Data And Signals
Ch03-Data And SignalsCh03-Data And Signals
Ch03-Data And Signals
 
Ch03
Ch03Ch03
Ch03
 
Data and Signals
Data and SignalsData and Signals
Data and Signals
 
Chapter 3 data and signals computer_network
Chapter 3 data and signals  computer_networkChapter 3 data and signals  computer_network
Chapter 3 data and signals computer_network
 
03 Data and_Signals
03 Data and_Signals03 Data and_Signals
03 Data and_Signals
 
data-signal-slides.pdf
data-signal-slides.pdfdata-signal-slides.pdf
data-signal-slides.pdf
 
Network : Ch03
Network : Ch03Network : Ch03
Network : Ch03
 
Data and signals.ppt
Data and signals.pptData and signals.ppt
Data and signals.ppt
 
Data Communications and Networking ch03
Data Communications and Networking  ch03Data Communications and Networking  ch03
Data Communications and Networking ch03
 
Ch03
Ch03Ch03
Ch03
 
ch03.pdf
ch03.pdfch03.pdf
ch03.pdf
 

More from bhagavanprasad

Chapter03
Chapter03Chapter03
Chapter03
bhagavanprasad
 
Chapter03
Chapter03Chapter03
Chapter03
bhagavanprasad
 
Chapter02
Chapter02Chapter02
Chapter02
bhagavanprasad
 
Chapter01
Chapter01Chapter01
Chapter01
bhagavanprasad
 
Chapter08
Chapter08Chapter08
Chapter08
bhagavanprasad
 
Chapter07
Chapter07Chapter07
Chapter07
bhagavanprasad
 
Chapter06
Chapter06Chapter06
Chapter06
bhagavanprasad
 
Chapter05
Chapter05 Chapter05
Chapter05
bhagavanprasad
 
Chapter04
Chapter04Chapter04
Chapter04
bhagavanprasad
 
Ch10 2 v1
Ch10 2 v1Ch10 2 v1
Ch10 2 v1
bhagavanprasad
 
Ch10 1 v1
Ch10 1 v1Ch10 1 v1
Ch10 1 v1
bhagavanprasad
 
Ch7 1 v1
Ch7 1 v1Ch7 1 v1
Ch7 1 v1
bhagavanprasad
 
Ch6 2 v1
Ch6 2 v1Ch6 2 v1
Ch6 2 v1
bhagavanprasad
 
Ch6 1 v1
Ch6 1 v1Ch6 1 v1
Ch6 1 v1
bhagavanprasad
 
Ch5 2 v1
Ch5 2 v1Ch5 2 v1
Ch5 2 v1
bhagavanprasad
 
Ch4 2 v1
Ch4 2 v1Ch4 2 v1
Ch4 2 v1
bhagavanprasad
 
Ch3 4 v1
Ch3 4 v1Ch3 4 v1
Ch3 4 v1
bhagavanprasad
 
Ch3 3 v1
Ch3 3 v1Ch3 3 v1
Ch3 3 v1
bhagavanprasad
 
Ch3 2 v1
Ch3 2 v1Ch3 2 v1
Ch3 2 v1
bhagavanprasad
 
Ch2 v1
Ch2 v1Ch2 v1

More from bhagavanprasad (20)

Chapter03
Chapter03Chapter03
Chapter03
 
Chapter03
Chapter03Chapter03
Chapter03
 
Chapter02
Chapter02Chapter02
Chapter02
 
Chapter01
Chapter01Chapter01
Chapter01
 
Chapter08
Chapter08Chapter08
Chapter08
 
Chapter07
Chapter07Chapter07
Chapter07
 
Chapter06
Chapter06Chapter06
Chapter06
 
Chapter05
Chapter05 Chapter05
Chapter05
 
Chapter04
Chapter04Chapter04
Chapter04
 
Ch10 2 v1
Ch10 2 v1Ch10 2 v1
Ch10 2 v1
 
Ch10 1 v1
Ch10 1 v1Ch10 1 v1
Ch10 1 v1
 
Ch7 1 v1
Ch7 1 v1Ch7 1 v1
Ch7 1 v1
 
Ch6 2 v1
Ch6 2 v1Ch6 2 v1
Ch6 2 v1
 
Ch6 1 v1
Ch6 1 v1Ch6 1 v1
Ch6 1 v1
 
Ch5 2 v1
Ch5 2 v1Ch5 2 v1
Ch5 2 v1
 
Ch4 2 v1
Ch4 2 v1Ch4 2 v1
Ch4 2 v1
 
Ch3 4 v1
Ch3 4 v1Ch3 4 v1
Ch3 4 v1
 
Ch3 3 v1
Ch3 3 v1Ch3 3 v1
Ch3 3 v1
 
Ch3 2 v1
Ch3 2 v1Ch3 2 v1
Ch3 2 v1
 
Ch2 v1
Ch2 v1Ch2 v1
Ch2 v1
 

Recently uploaded

Harnessing WebAssembly for Real-time Stateless Streaming Pipelines
Harnessing WebAssembly for Real-time Stateless Streaming PipelinesHarnessing WebAssembly for Real-time Stateless Streaming Pipelines
Harnessing WebAssembly for Real-time Stateless Streaming Pipelines
Christina Lin
 
Cosmetic shop management system project report.pdf
Cosmetic shop management system project report.pdfCosmetic shop management system project report.pdf
Cosmetic shop management system project report.pdf
Kamal Acharya
 
Final project report on grocery store management system..pdf
Final project report on grocery store management system..pdfFinal project report on grocery store management system..pdf
Final project report on grocery store management system..pdf
Kamal Acharya
 
Industrial Training at Shahjalal Fertilizer Company Limited (SFCL)
Industrial Training at Shahjalal Fertilizer Company Limited (SFCL)Industrial Training at Shahjalal Fertilizer Company Limited (SFCL)
Industrial Training at Shahjalal Fertilizer Company Limited (SFCL)
MdTanvirMahtab2
 
Planning Of Procurement o different goods and services
Planning Of Procurement o different goods and servicesPlanning Of Procurement o different goods and services
Planning Of Procurement o different goods and services
JoytuBarua2
 
DfMAy 2024 - key insights and contributions
DfMAy 2024 - key insights and contributionsDfMAy 2024 - key insights and contributions
DfMAy 2024 - key insights and contributions
gestioneergodomus
 
Forklift Classes Overview by Intella Parts
Forklift Classes Overview by Intella PartsForklift Classes Overview by Intella Parts
Forklift Classes Overview by Intella Parts
Intella Parts
 
一比一原版(Otago毕业证)奥塔哥大学毕业证成绩单如何办理
一比一原版(Otago毕业证)奥塔哥大学毕业证成绩单如何办理一比一原版(Otago毕业证)奥塔哥大学毕业证成绩单如何办理
一比一原版(Otago毕业证)奥塔哥大学毕业证成绩单如何办理
dxobcob
 
Literature Review Basics and Understanding Reference Management.pptx
Literature Review Basics and Understanding Reference Management.pptxLiterature Review Basics and Understanding Reference Management.pptx
Literature Review Basics and Understanding Reference Management.pptx
Dr Ramhari Poudyal
 
NUMERICAL SIMULATIONS OF HEAT AND MASS TRANSFER IN CONDENSING HEAT EXCHANGERS...
NUMERICAL SIMULATIONS OF HEAT AND MASS TRANSFER IN CONDENSING HEAT EXCHANGERS...NUMERICAL SIMULATIONS OF HEAT AND MASS TRANSFER IN CONDENSING HEAT EXCHANGERS...
NUMERICAL SIMULATIONS OF HEAT AND MASS TRANSFER IN CONDENSING HEAT EXCHANGERS...
ssuser7dcef0
 
Unbalanced Three Phase Systems and circuits.pptx
Unbalanced Three Phase Systems and circuits.pptxUnbalanced Three Phase Systems and circuits.pptx
Unbalanced Three Phase Systems and circuits.pptx
ChristineTorrepenida1
 
Technical Drawings introduction to drawing of prisms
Technical Drawings introduction to drawing of prismsTechnical Drawings introduction to drawing of prisms
Technical Drawings introduction to drawing of prisms
heavyhaig
 
Tutorial for 16S rRNA Gene Analysis with QIIME2.pdf
Tutorial for 16S rRNA Gene Analysis with QIIME2.pdfTutorial for 16S rRNA Gene Analysis with QIIME2.pdf
Tutorial for 16S rRNA Gene Analysis with QIIME2.pdf
aqil azizi
 
Modelagem de um CSTR com reação endotermica.pdf
Modelagem de um CSTR com reação endotermica.pdfModelagem de um CSTR com reação endotermica.pdf
Modelagem de um CSTR com reação endotermica.pdf
camseq
 
Top 10 Oil and Gas Projects in Saudi Arabia 2024.pdf
Top 10 Oil and Gas Projects in Saudi Arabia 2024.pdfTop 10 Oil and Gas Projects in Saudi Arabia 2024.pdf
Top 10 Oil and Gas Projects in Saudi Arabia 2024.pdf
Teleport Manpower Consultant
 
AKS UNIVERSITY Satna Final Year Project By OM Hardaha.pdf
AKS UNIVERSITY Satna Final Year Project By OM Hardaha.pdfAKS UNIVERSITY Satna Final Year Project By OM Hardaha.pdf
AKS UNIVERSITY Satna Final Year Project By OM Hardaha.pdf
SamSarthak3
 
PPT on GRP pipes manufacturing and testing
PPT on GRP pipes manufacturing and testingPPT on GRP pipes manufacturing and testing
PPT on GRP pipes manufacturing and testing
anoopmanoharan2
 
Fundamentals of Electric Drives and its applications.pptx
Fundamentals of Electric Drives and its applications.pptxFundamentals of Electric Drives and its applications.pptx
Fundamentals of Electric Drives and its applications.pptx
manasideore6
 
Water billing management system project report.pdf
Water billing management system project report.pdfWater billing management system project report.pdf
Water billing management system project report.pdf
Kamal Acharya
 
MCQ Soil mechanics questions (Soil shear strength).pdf
MCQ Soil mechanics questions (Soil shear strength).pdfMCQ Soil mechanics questions (Soil shear strength).pdf
MCQ Soil mechanics questions (Soil shear strength).pdf
Osamah Alsalih
 

Recently uploaded (20)

Harnessing WebAssembly for Real-time Stateless Streaming Pipelines
Harnessing WebAssembly for Real-time Stateless Streaming PipelinesHarnessing WebAssembly for Real-time Stateless Streaming Pipelines
Harnessing WebAssembly for Real-time Stateless Streaming Pipelines
 
Cosmetic shop management system project report.pdf
Cosmetic shop management system project report.pdfCosmetic shop management system project report.pdf
Cosmetic shop management system project report.pdf
 
Final project report on grocery store management system..pdf
Final project report on grocery store management system..pdfFinal project report on grocery store management system..pdf
Final project report on grocery store management system..pdf
 
Industrial Training at Shahjalal Fertilizer Company Limited (SFCL)
Industrial Training at Shahjalal Fertilizer Company Limited (SFCL)Industrial Training at Shahjalal Fertilizer Company Limited (SFCL)
Industrial Training at Shahjalal Fertilizer Company Limited (SFCL)
 
Planning Of Procurement o different goods and services
Planning Of Procurement o different goods and servicesPlanning Of Procurement o different goods and services
Planning Of Procurement o different goods and services
 
DfMAy 2024 - key insights and contributions
DfMAy 2024 - key insights and contributionsDfMAy 2024 - key insights and contributions
DfMAy 2024 - key insights and contributions
 
Forklift Classes Overview by Intella Parts
Forklift Classes Overview by Intella PartsForklift Classes Overview by Intella Parts
Forklift Classes Overview by Intella Parts
 
一比一原版(Otago毕业证)奥塔哥大学毕业证成绩单如何办理
一比一原版(Otago毕业证)奥塔哥大学毕业证成绩单如何办理一比一原版(Otago毕业证)奥塔哥大学毕业证成绩单如何办理
一比一原版(Otago毕业证)奥塔哥大学毕业证成绩单如何办理
 
Literature Review Basics and Understanding Reference Management.pptx
Literature Review Basics and Understanding Reference Management.pptxLiterature Review Basics and Understanding Reference Management.pptx
Literature Review Basics and Understanding Reference Management.pptx
 
NUMERICAL SIMULATIONS OF HEAT AND MASS TRANSFER IN CONDENSING HEAT EXCHANGERS...
NUMERICAL SIMULATIONS OF HEAT AND MASS TRANSFER IN CONDENSING HEAT EXCHANGERS...NUMERICAL SIMULATIONS OF HEAT AND MASS TRANSFER IN CONDENSING HEAT EXCHANGERS...
NUMERICAL SIMULATIONS OF HEAT AND MASS TRANSFER IN CONDENSING HEAT EXCHANGERS...
 
Unbalanced Three Phase Systems and circuits.pptx
Unbalanced Three Phase Systems and circuits.pptxUnbalanced Three Phase Systems and circuits.pptx
Unbalanced Three Phase Systems and circuits.pptx
 
Technical Drawings introduction to drawing of prisms
Technical Drawings introduction to drawing of prismsTechnical Drawings introduction to drawing of prisms
Technical Drawings introduction to drawing of prisms
 
Tutorial for 16S rRNA Gene Analysis with QIIME2.pdf
Tutorial for 16S rRNA Gene Analysis with QIIME2.pdfTutorial for 16S rRNA Gene Analysis with QIIME2.pdf
Tutorial for 16S rRNA Gene Analysis with QIIME2.pdf
 
Modelagem de um CSTR com reação endotermica.pdf
Modelagem de um CSTR com reação endotermica.pdfModelagem de um CSTR com reação endotermica.pdf
Modelagem de um CSTR com reação endotermica.pdf
 
Top 10 Oil and Gas Projects in Saudi Arabia 2024.pdf
Top 10 Oil and Gas Projects in Saudi Arabia 2024.pdfTop 10 Oil and Gas Projects in Saudi Arabia 2024.pdf
Top 10 Oil and Gas Projects in Saudi Arabia 2024.pdf
 
AKS UNIVERSITY Satna Final Year Project By OM Hardaha.pdf
AKS UNIVERSITY Satna Final Year Project By OM Hardaha.pdfAKS UNIVERSITY Satna Final Year Project By OM Hardaha.pdf
AKS UNIVERSITY Satna Final Year Project By OM Hardaha.pdf
 
PPT on GRP pipes manufacturing and testing
PPT on GRP pipes manufacturing and testingPPT on GRP pipes manufacturing and testing
PPT on GRP pipes manufacturing and testing
 
Fundamentals of Electric Drives and its applications.pptx
Fundamentals of Electric Drives and its applications.pptxFundamentals of Electric Drives and its applications.pptx
Fundamentals of Electric Drives and its applications.pptx
 
Water billing management system project report.pdf
Water billing management system project report.pdfWater billing management system project report.pdf
Water billing management system project report.pdf
 
MCQ Soil mechanics questions (Soil shear strength).pdf
MCQ Soil mechanics questions (Soil shear strength).pdfMCQ Soil mechanics questions (Soil shear strength).pdf
MCQ Soil mechanics questions (Soil shear strength).pdf
 

Ch3 1 v1

  • 1. 3.1 Chapter 3 Data and Signals Copyright © The McGraw-Hill Companies, Inc. Permission required for reproduction or display.
  • 2. 3.2 To be transmitted, data must be transformed to electromagnetic signals. Note
  • 3. 3.3 3-1 ANALOG AND DIGITAL3-1 ANALOG AND DIGITAL Data can beData can be analoganalog oror digitaldigital. The term. The term analog dataanalog data refersrefers to information that is continuous;to information that is continuous; digital datadigital data refers torefers to information that has discrete states. Analog data take oninformation that has discrete states. Analog data take on continuous values. Digital data take on discrete values.continuous values. Digital data take on discrete values.  Analog and Digital Data  Analog and Digital Signals  Periodic and Nonperiodic Signals Topics discussed in this section:Topics discussed in this section:
  • 4. 3.4 Analog and Digital Data  Data can be analog or digital.  Analog data are continuous and take continuous values.  Digital data have discrete states and take discrete values.
  • 5. 3.5 Analog and Digital Signals • Signals can be analog or digital. • Analog signals can have an infinite number of values in a range. • Digital signals can have only a limited number of values.
  • 6. 3.6 Figure 3.1 Comparison of analog and digital signals
  • 7. 3.7 3-2 PERIODIC ANALOG SIGNALS3-2 PERIODIC ANALOG SIGNALS In data communications, we commonly use periodic analog signals and nonperiodic digital signals. Periodic analog signals can be classified asPeriodic analog signals can be classified as simplesimple oror compositecomposite. A simple periodic analog signal, a. A simple periodic analog signal, a sine wavesine wave,, cannot be decomposed into simpler signals. A compositecannot be decomposed into simpler signals. A composite periodic analog signal is composed of multiple sineperiodic analog signal is composed of multiple sine waves.waves.  Sine Wave  Wavelength  Time and Frequency Domain  Composite Signals  Bandwidth Topics discussed in this section:Topics discussed in this section:
  • 8. 3.8 Figure 3.2 A sine wave
  • 9. 3.9 Figure 3.3 Two signals with the same phase and frequency, but different amplitudes
  • 10. 3.10 Frequency and period are the inverse of each other. Note
  • 11. 3.11 Figure 3.4 Two signals with the same amplitude and phase, but different frequencies
  • 12. 3.12 Table 3.1 Units of period and frequency
  • 13. 3.13 The power we use at home has a frequency of 60 Hz. The period of this sine wave can be determined as follows: Example 3.1
  • 14. 3.14 The period of a signal is 100 ms. What is its frequency in kilohertz? Example 3.2 Solution First we change 100 ms to seconds, and then we calculate the frequency from the period (1 Hz = 10−3 kHz).
  • 15. 3.15 Frequency • Frequency is the rate of change with respect to time. • Change in a short span of time means high frequency. • Change over a long span of time means low frequency.
  • 16. 3.16 If a signal does not change at all, its frequency is zero. If a signal changes instantaneously, its frequency is infinite. Note
  • 17. 3.17 Phase describes the position of the waveform relative to time 0. Note
  • 18. 3.18 Figure 3.5 Three sine waves with the same amplitude and frequency, but different phases
  • 19. 3.19 A sine wave is offset 1/6 cycle with respect to time 0. What is its phase in degrees and radians? Example 3.3 Solution We know that 1 complete cycle is 360°. Therefore, 1/6 cycle is
  • 21. 3.21 Figure 3.7 The time-domain and frequency-domain plots of a sine wave
  • 22. 3.22 A complete sine wave in the time domain can be represented by one single spike in the frequency domain. Note
  • 23. 3.23 The frequency domain is more compact and useful when we are dealing with more than one sine wave. For example, Figure 3.8 shows three sine waves, each with different amplitude and frequency. All can be represented by three spikes in the frequency domain. Example 3.7
  • 24. 3.24 Figure 3.8 The time domain and frequency domain of three sine waves
  • 25. 3.25 Signals and Communication  A single-frequency sine wave is not useful in data communications  We need to send a composite signal, a signal made of many simple sine waves.  According to Fourier analysis, any composite signal is a combination of simple sine waves with different frequencies, amplitudes, and phases.
  • 26. 3.26 Composite Signals and Periodicity  If the composite signal is periodic, the decomposition gives a series of signals with discrete frequencies.  If the composite signal is nonperiodic, the decomposition gives a combination of sine waves with continuous frequencies.
  • 27. 3.27 Figure 3.9 shows a periodic composite signal with frequency f. This type of signal is not typical of those found in data communications. We can consider it to be three alarm systems, each with a different frequency. The analysis of this signal can give us a good understanding of how to decompose signals. Example 3.4
  • 28. 3.28 Figure 3.9 A composite periodic signal
  • 29. 3.29 Figure 3.10 Decomposition of a composite periodic signal in the time and frequency domains
  • 30. 3.30 Figure 3.11 shows a nonperiodic composite signal. It can be the signal created by a microphone or a telephone set when a word or two is pronounced. In this case, the composite signal cannot be periodic, because that implies that we are repeating the same word or words with exactly the same tone. Example 3.5
  • 31. 3.31 Figure 3.11 The time and frequency domains of a nonperiodic signal
  • 32. 3.32 Bandwidth and Signal Frequency  The bandwidth of a composite signal is the difference between the highest and the lowest frequencies contained in that signal.
  • 33. 3.33 Figure 3.12 The bandwidth of periodic and nonperiodic composite signals
  • 34. 3.34 If a periodic signal is decomposed into five sine waves with frequencies of 100, 300, 500, 700, and 900 Hz, what is its bandwidth? Draw the spectrum, assuming all components have a maximum amplitude of 10 V. Solution Let fh be the highest frequency, fl the lowest frequency, and B the bandwidth. Then Example 3.6 The spectrum has only five spikes, at 100, 300, 500, 700, and 900 Hz (see Figure 3.13).
  • 35. 3.35 Figure 3.13 The bandwidth for Example 3.6
  • 36. 3.36 A periodic signal has a bandwidth of 20 Hz. The highest frequency is 60 Hz. What is the lowest frequency? Draw the spectrum if the signal contains all frequencies of the same amplitude. Solution Let fh be the highest frequency, fl the lowest frequency, and B the bandwidth. Then Example 3.7 The spectrum contains all integer frequencies. We show this by a series of spikes (see Figure 3.14).
  • 37. 3.37 Figure 3.14 The bandwidth for Example 3.7
  • 38. 3.38 A nonperiodic composite signal has a bandwidth of 200 kHz, with a middle frequency of 140 kHz and peak amplitude of 20 V. The two extreme frequencies have an amplitude of 0. Draw the frequency domain of the signal. Solution The lowest frequency must be at 40 kHz and the highest at 240 kHz. Figure 3.15 shows the frequency domain and the bandwidth. Example 3.8
  • 39. 3.39 Figure 3.15 The bandwidth for Example 3.8
  • 40. 3.40 An example of a nonperiodic composite signal is the signal propagated by an AM radio station. In the United States, each AM radio station is assigned a 10-kHz bandwidth. The total bandwidth dedicated to AM radio ranges from 530 to 1700 kHz. We will show the rationale behind this 10-kHz bandwidth in Chapter 5. Example 3.9
  • 41. 3.41 Another example of a nonperiodic composite signal is the signal propagated by an FM radio station. In the United States, each FM radio station is assigned a 200- kHz bandwidth. The total bandwidth dedicated to FM radio ranges from 88 to 108 MHz. We will show the rationale behind this 200-kHz bandwidth in Chapter 5. Example 3.10
  • 42. 3.42 Another example of a nonperiodic composite signal is the signal received by an old-fashioned analog black- and-white TV. A TV screen is made up of pixels. If we assume a resolution of 525 × 700, we have 367,500 pixels per screen. If we scan the screen 30 times per second, this is 367,500 × 30 = 11,025,000 pixels per second. The worst-case scenario is alternating black and white pixels. We can send 2 pixels per cycle. Therefore, we need 11,025,000 / 2 = 5,512,500 cycles per second, or Hz. The bandwidth needed is 5.5125 MHz. Example 3.11
  • 43. 3.43 Fourier analysis is a tool that changes a time domain signal to a frequency domain signal and vice versa. Note Fourier Analysis
  • 44. 3.44 Fourier Series  Every composite periodic signal can be represented with a series of sine and cosine functions.  The functions are integral harmonics of the fundamental frequency “f” of the composite signal.  Using the series we can decompose any periodic signal into its harmonics.
  • 46. 3.46 Examples of Signals and the Fourier Series Representation
  • 48. 3.48 Fourier Transform  Fourier Transform gives the frequency domain of a nonperiodic time domain signal.
  • 49. 3.49 Example of a Fourier Transform
  • 51. 3.51 Time limited and Band limited Signals  A time limited signal is a signal for which the amplitude s(t) = 0 for t > T1 and t < T2  A band limited signal is a signal for which the amplitude S(f) = 0 for f > F1 and f < F2