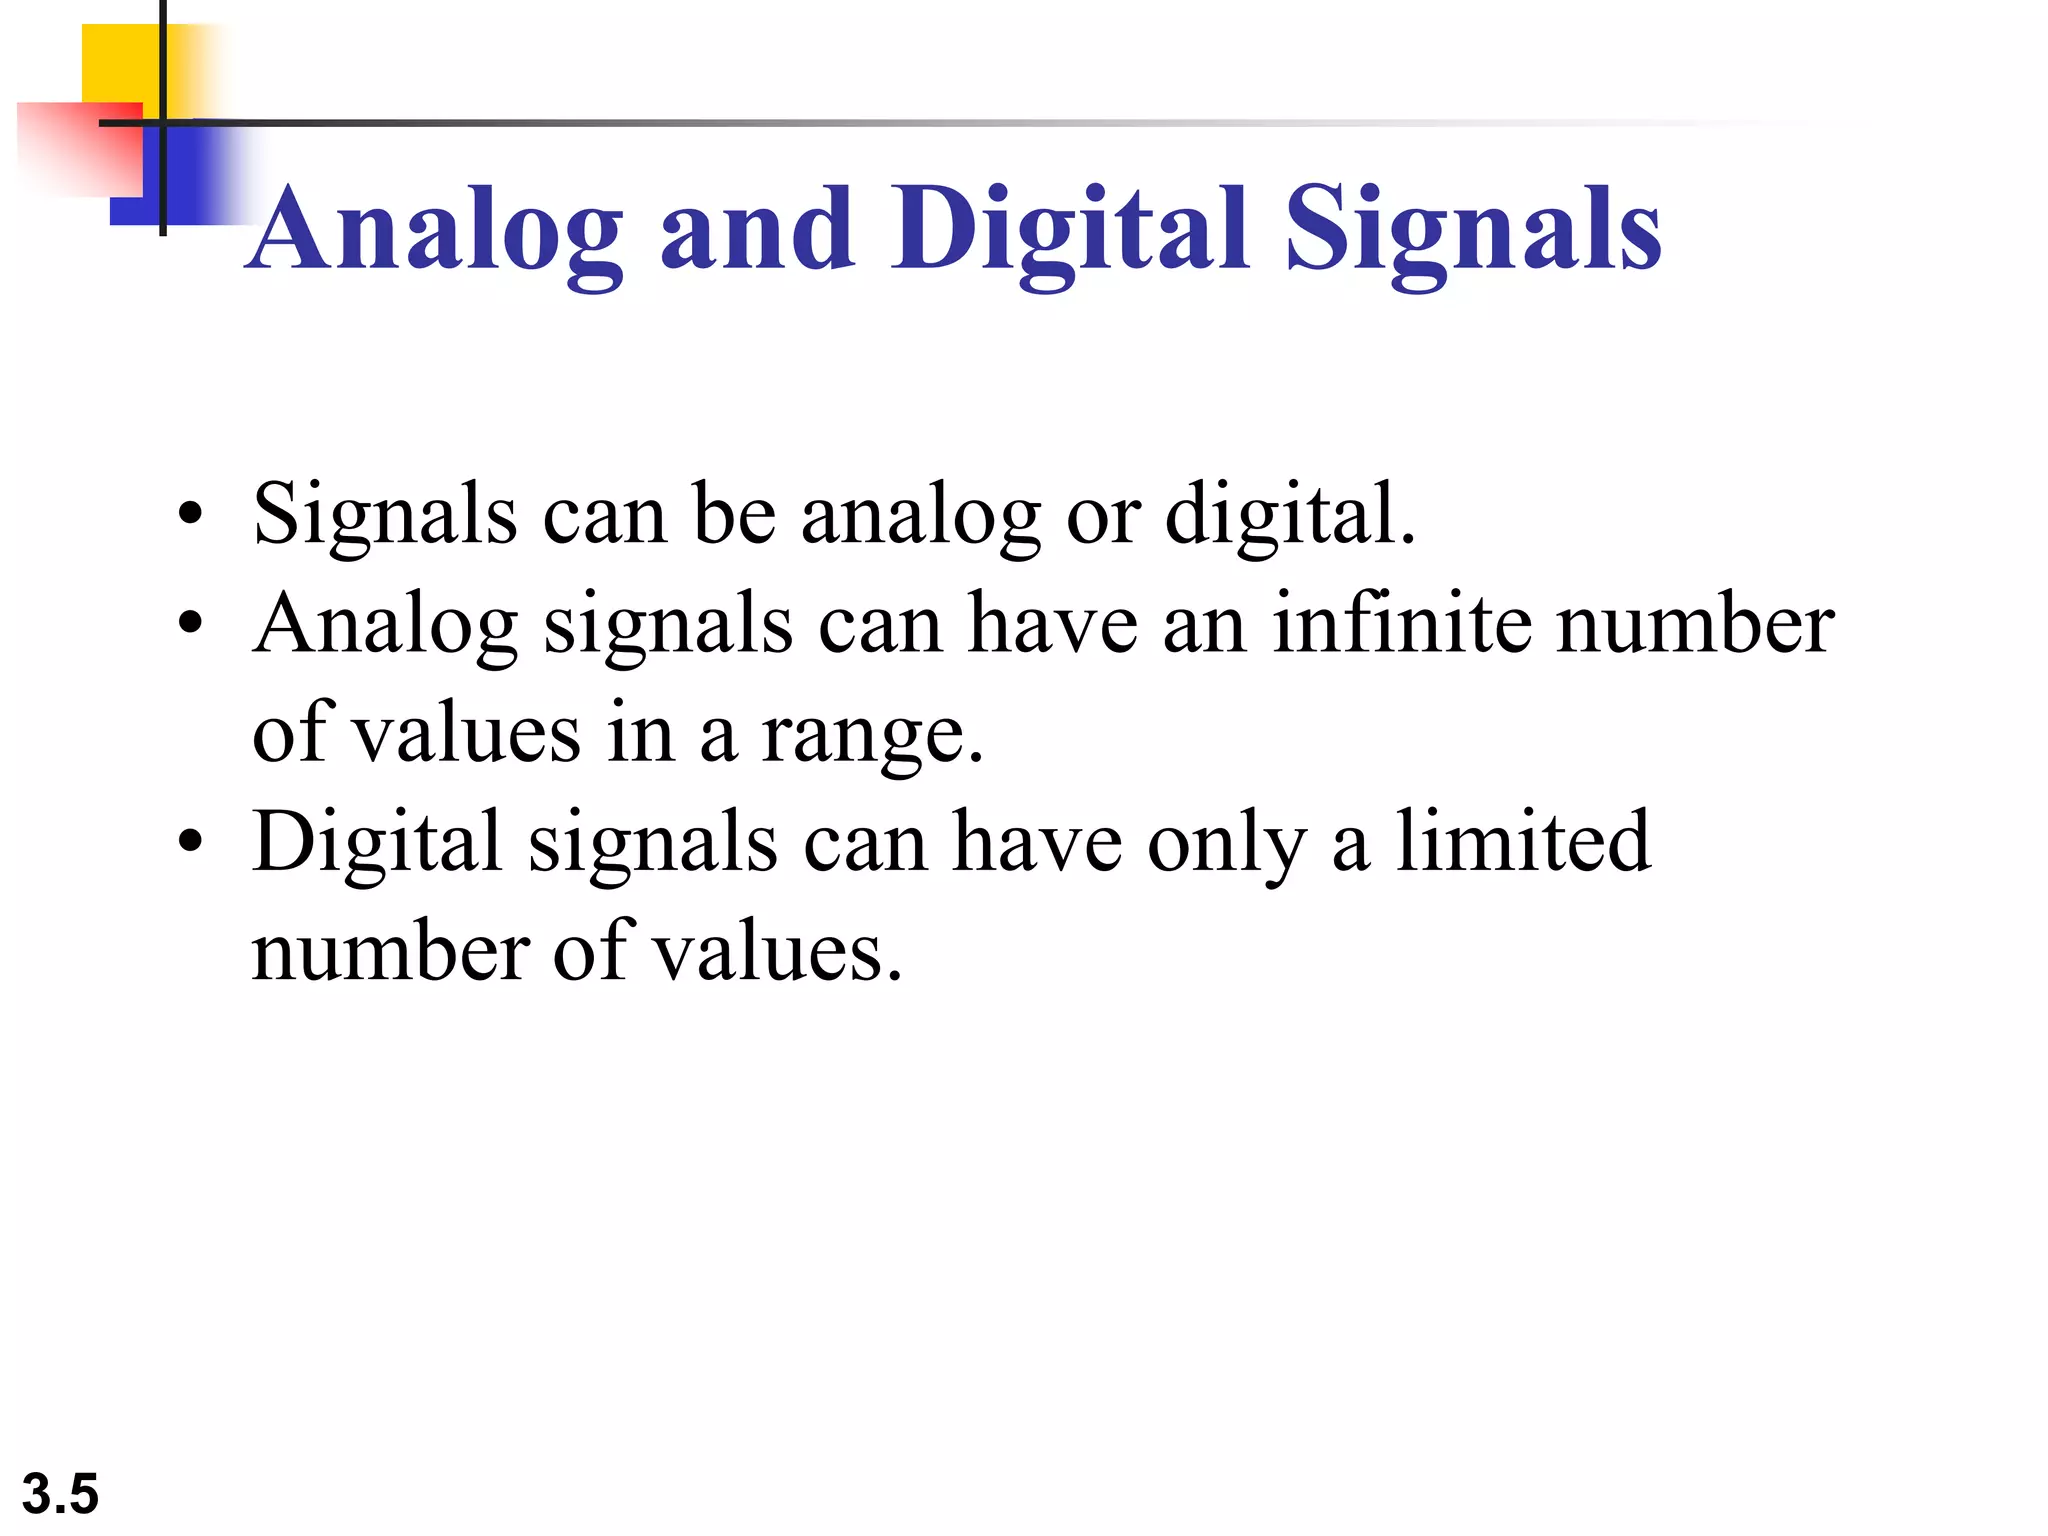
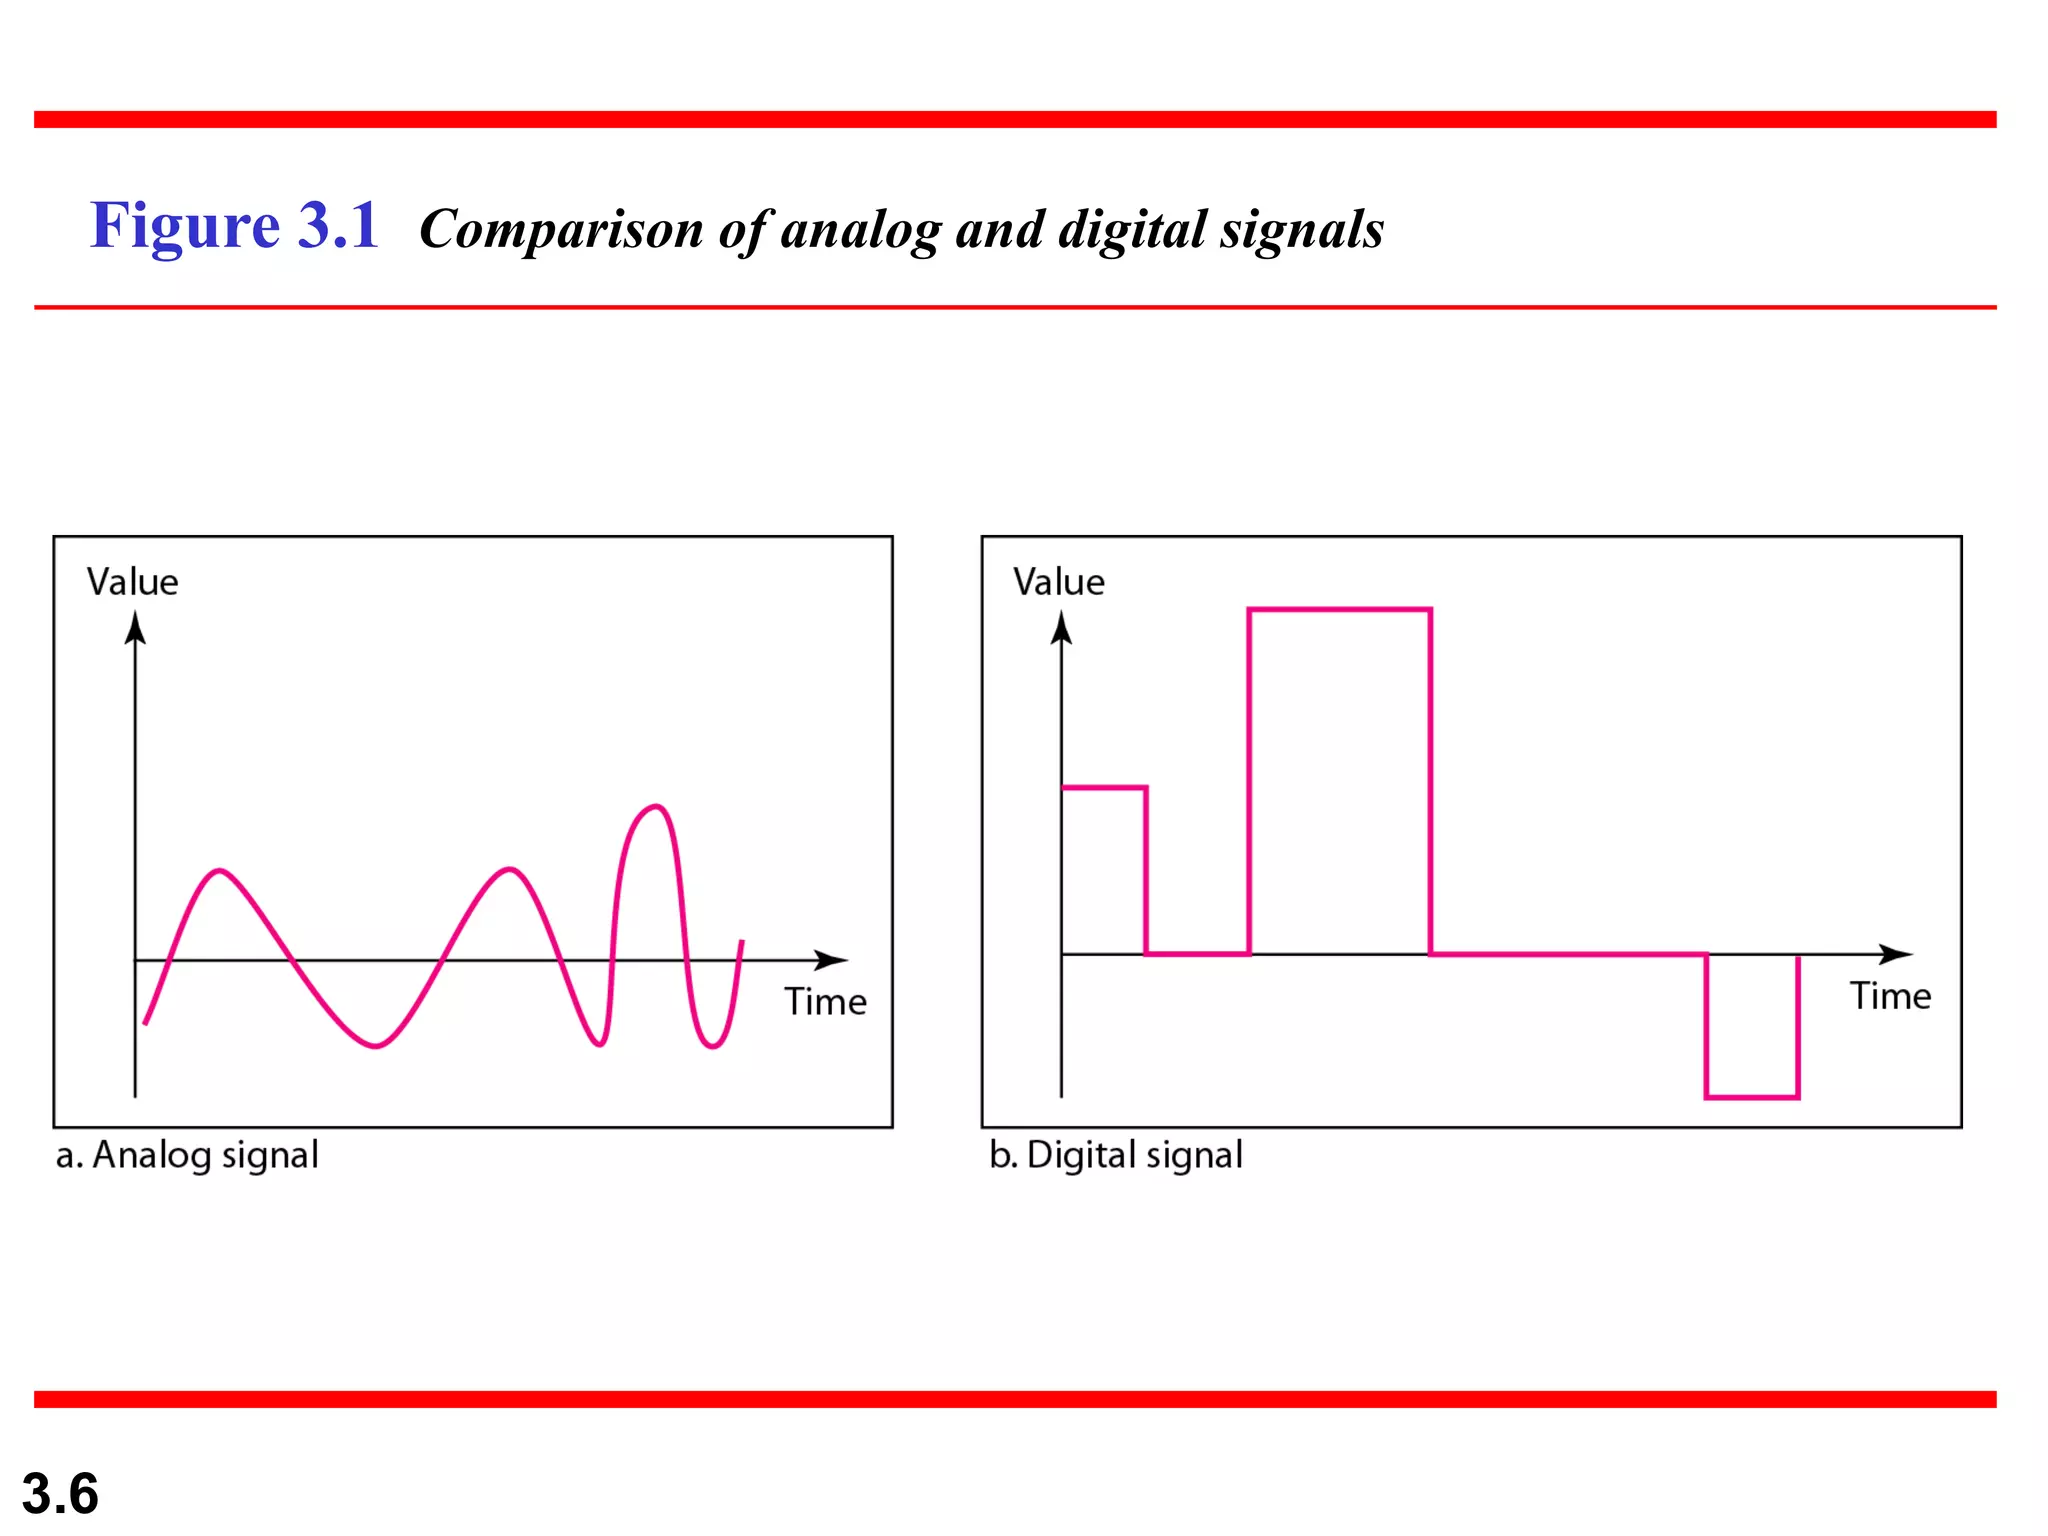
1) Data can be either analog or digital, where analog data is continuous and digital data has discrete states. Signals that transmit data can also be analog or digital.
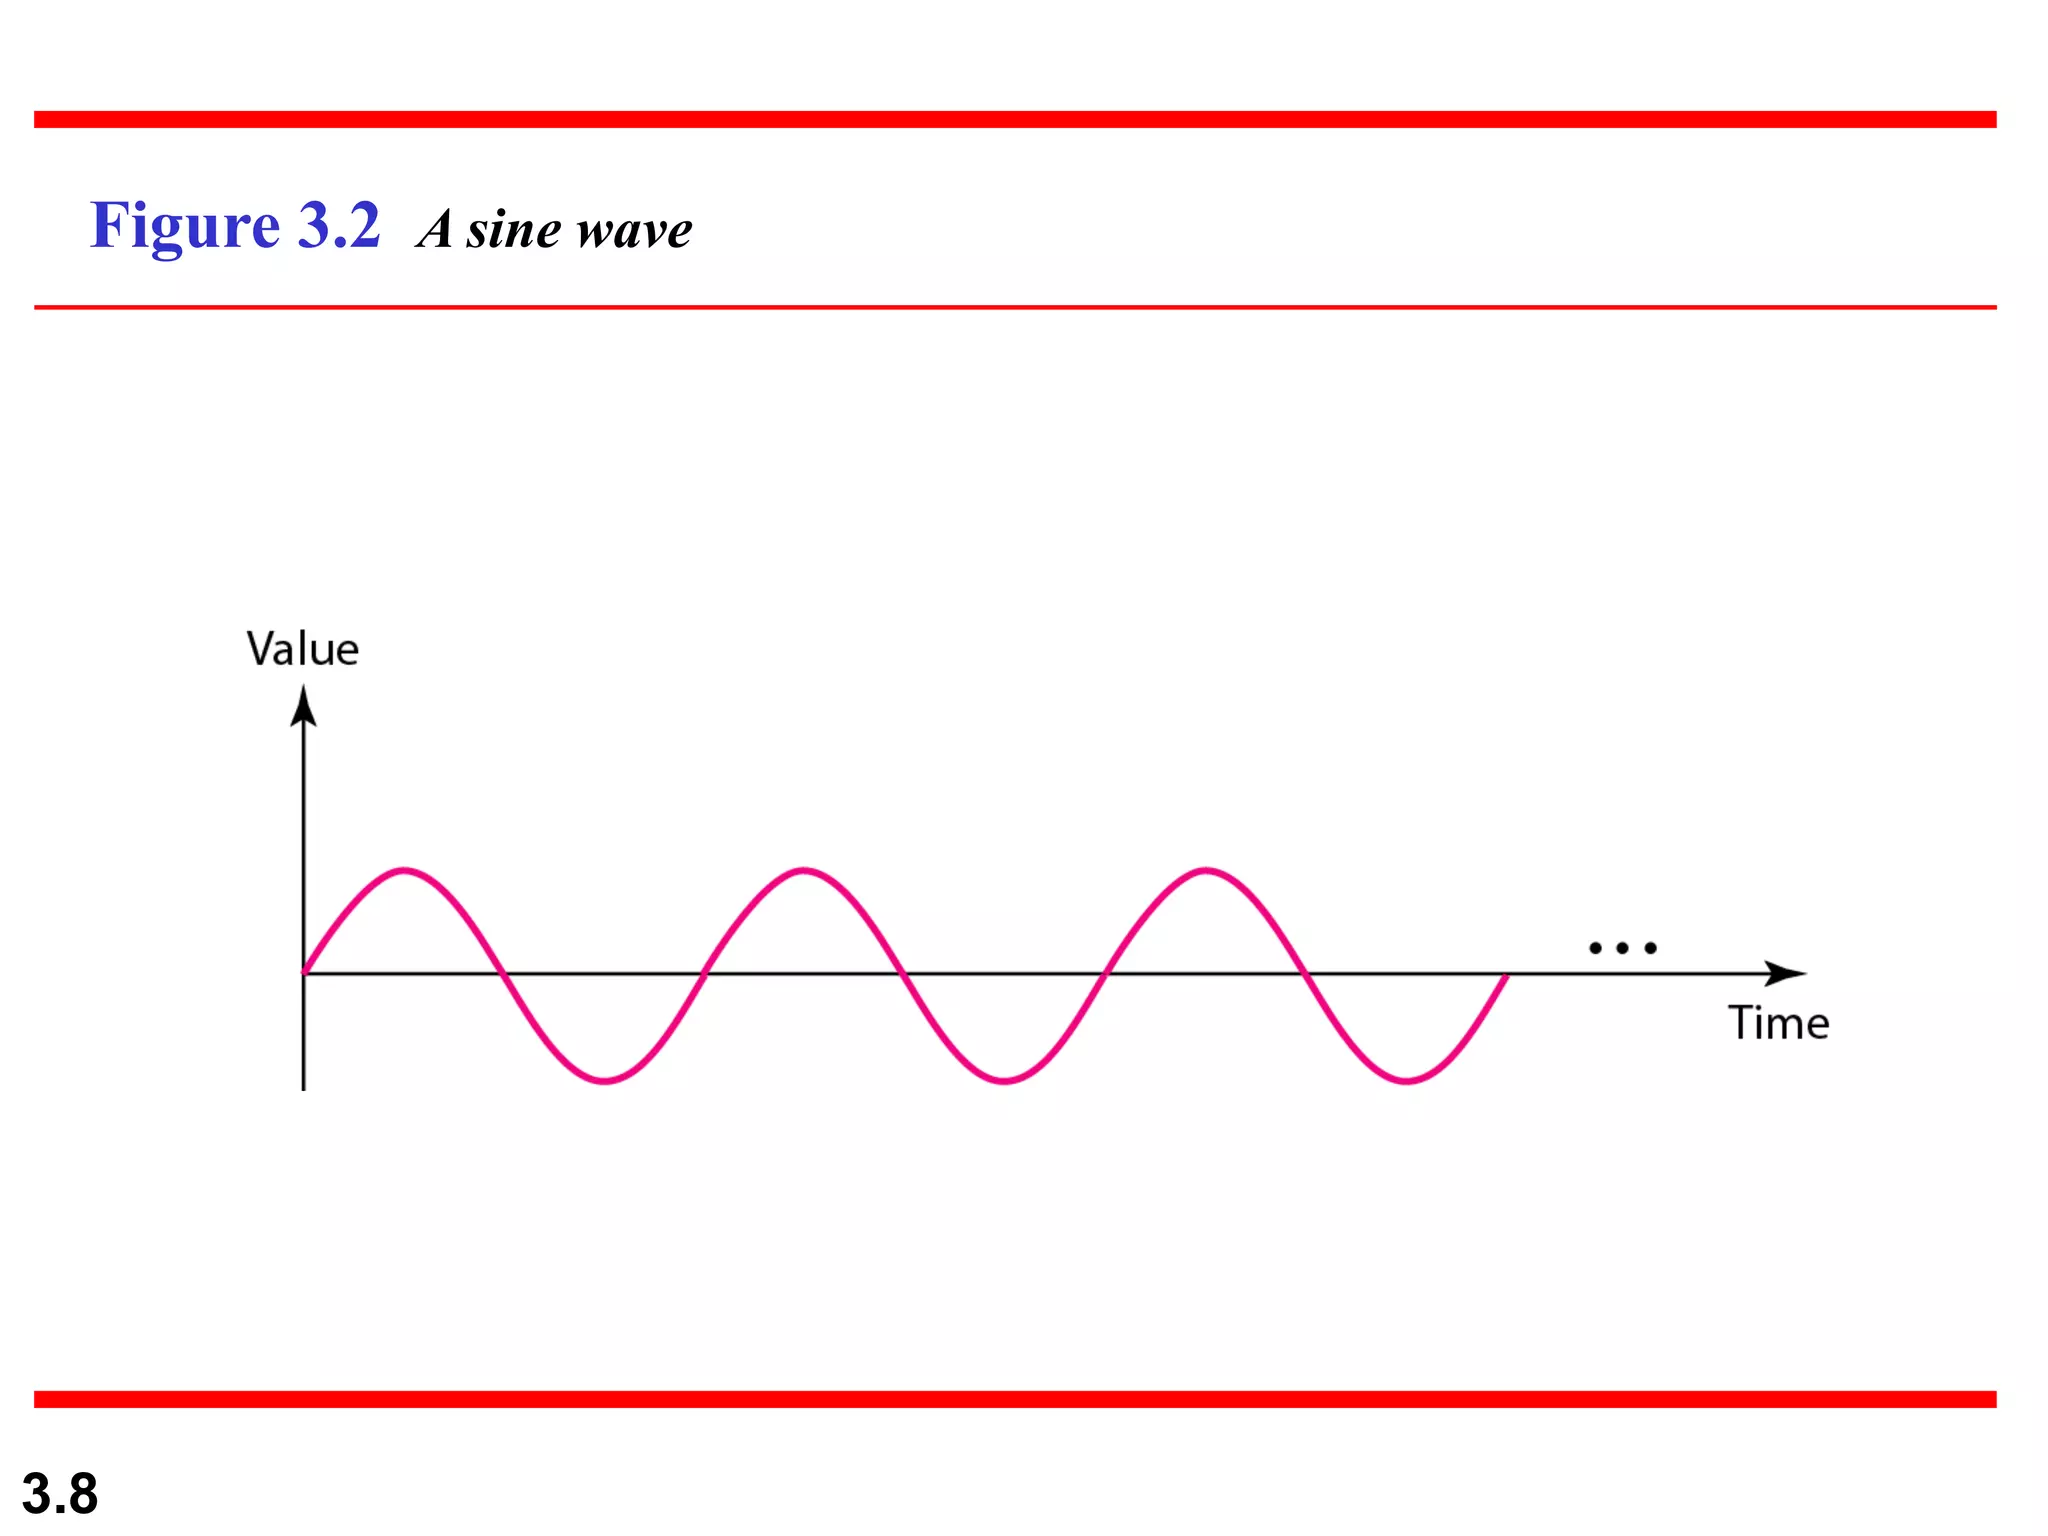
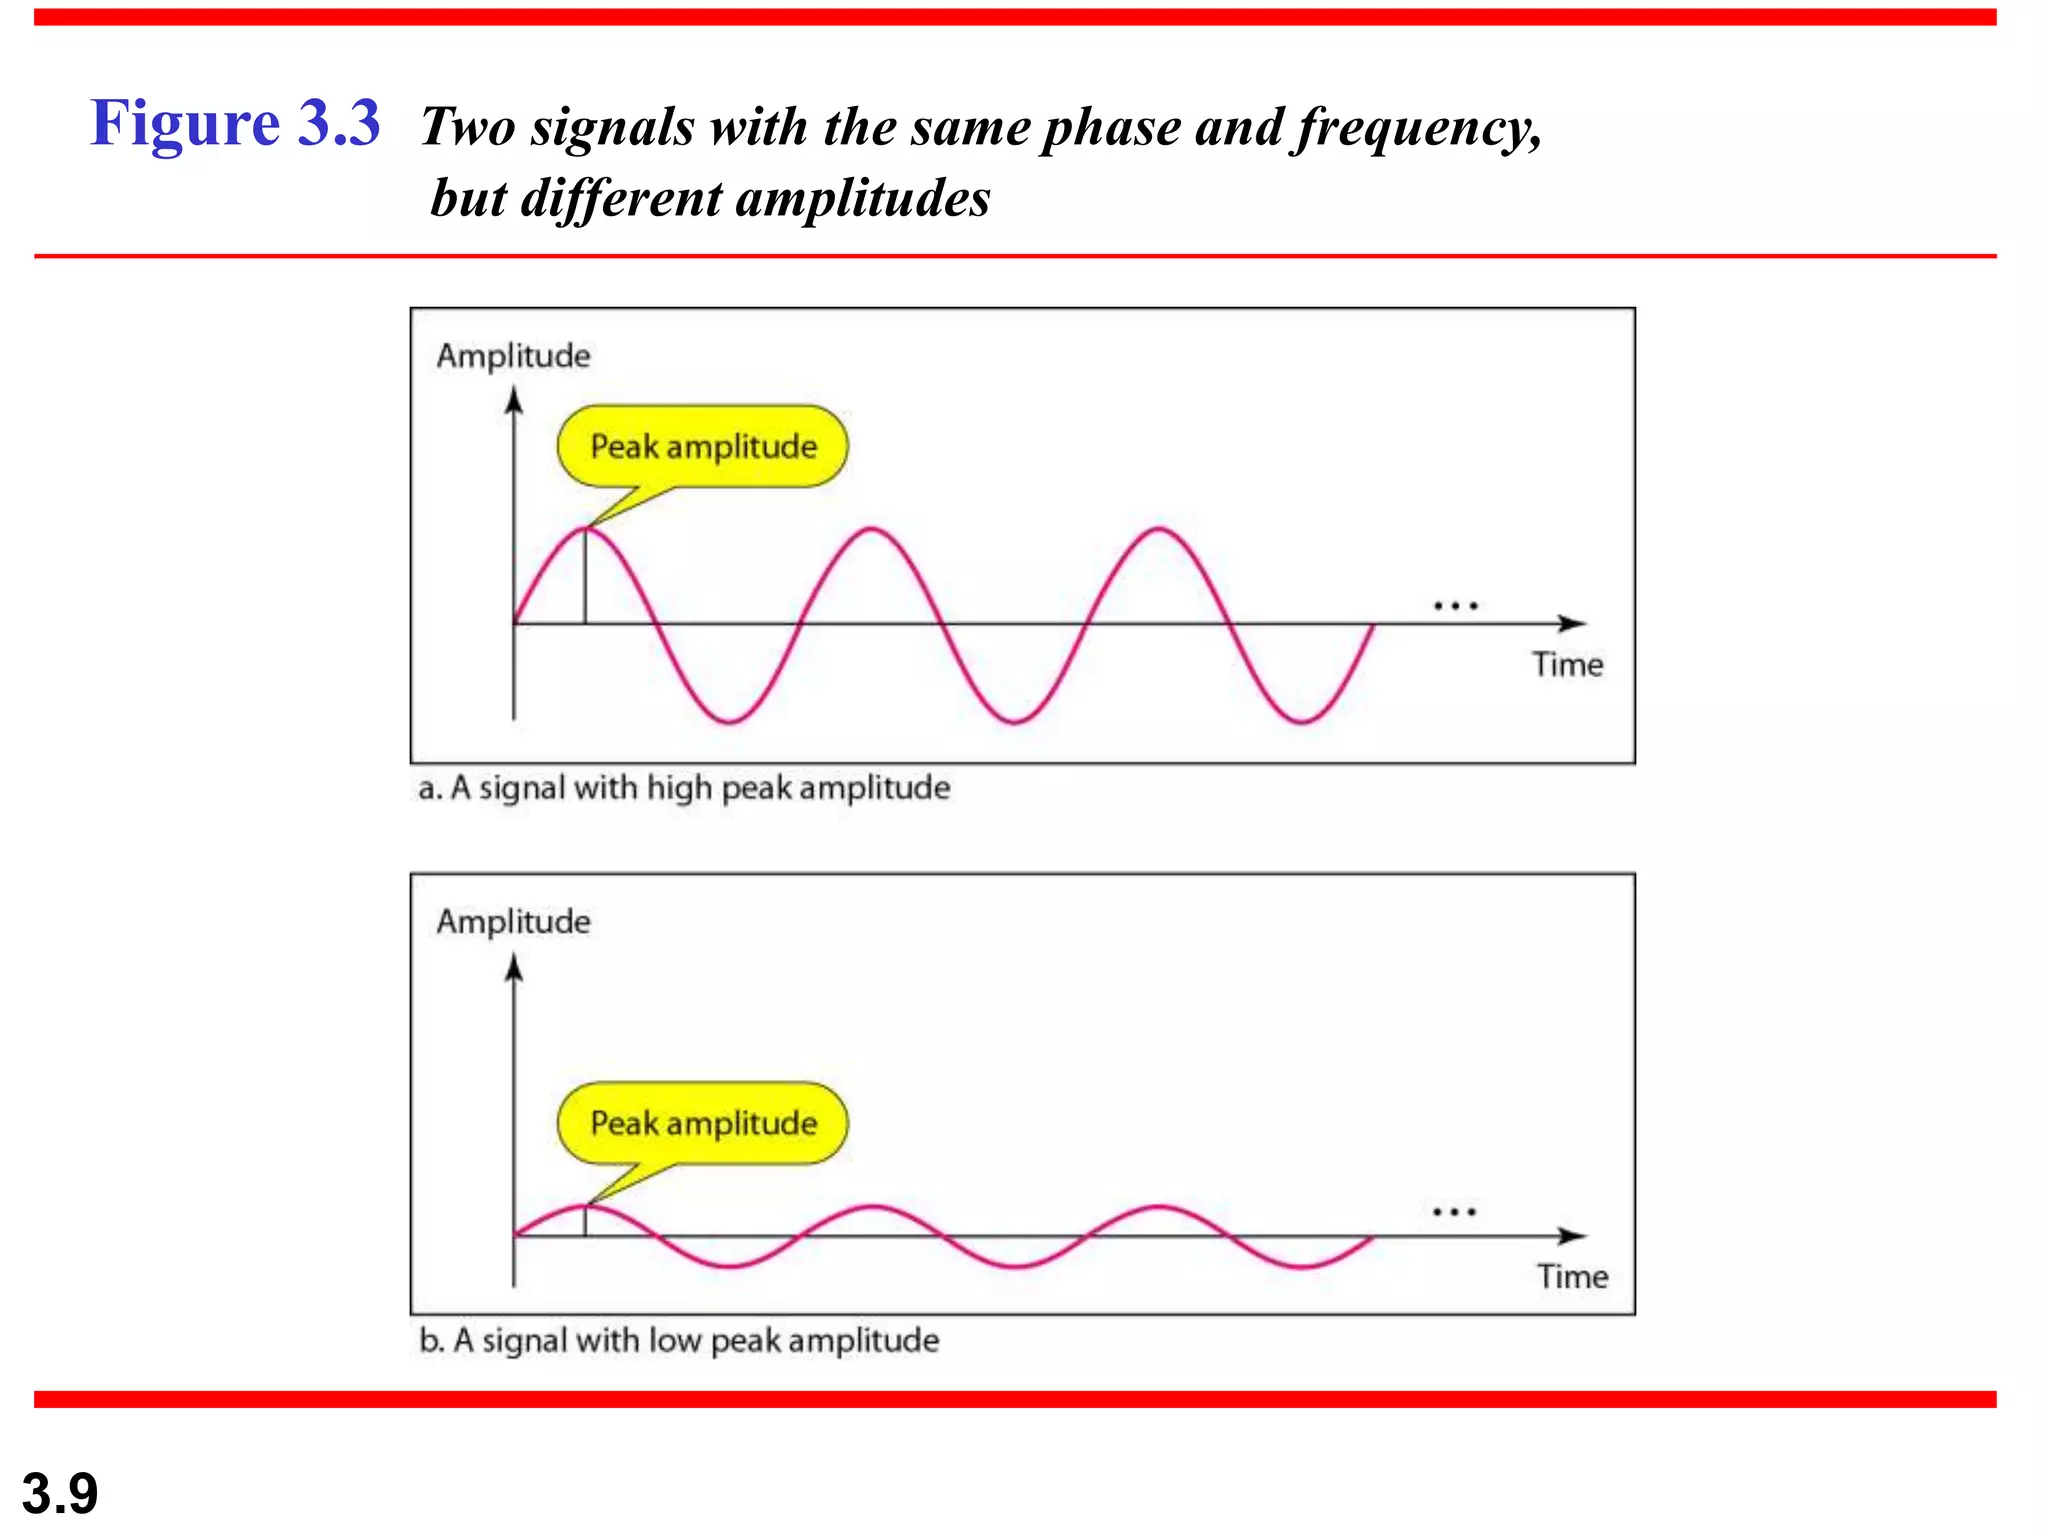
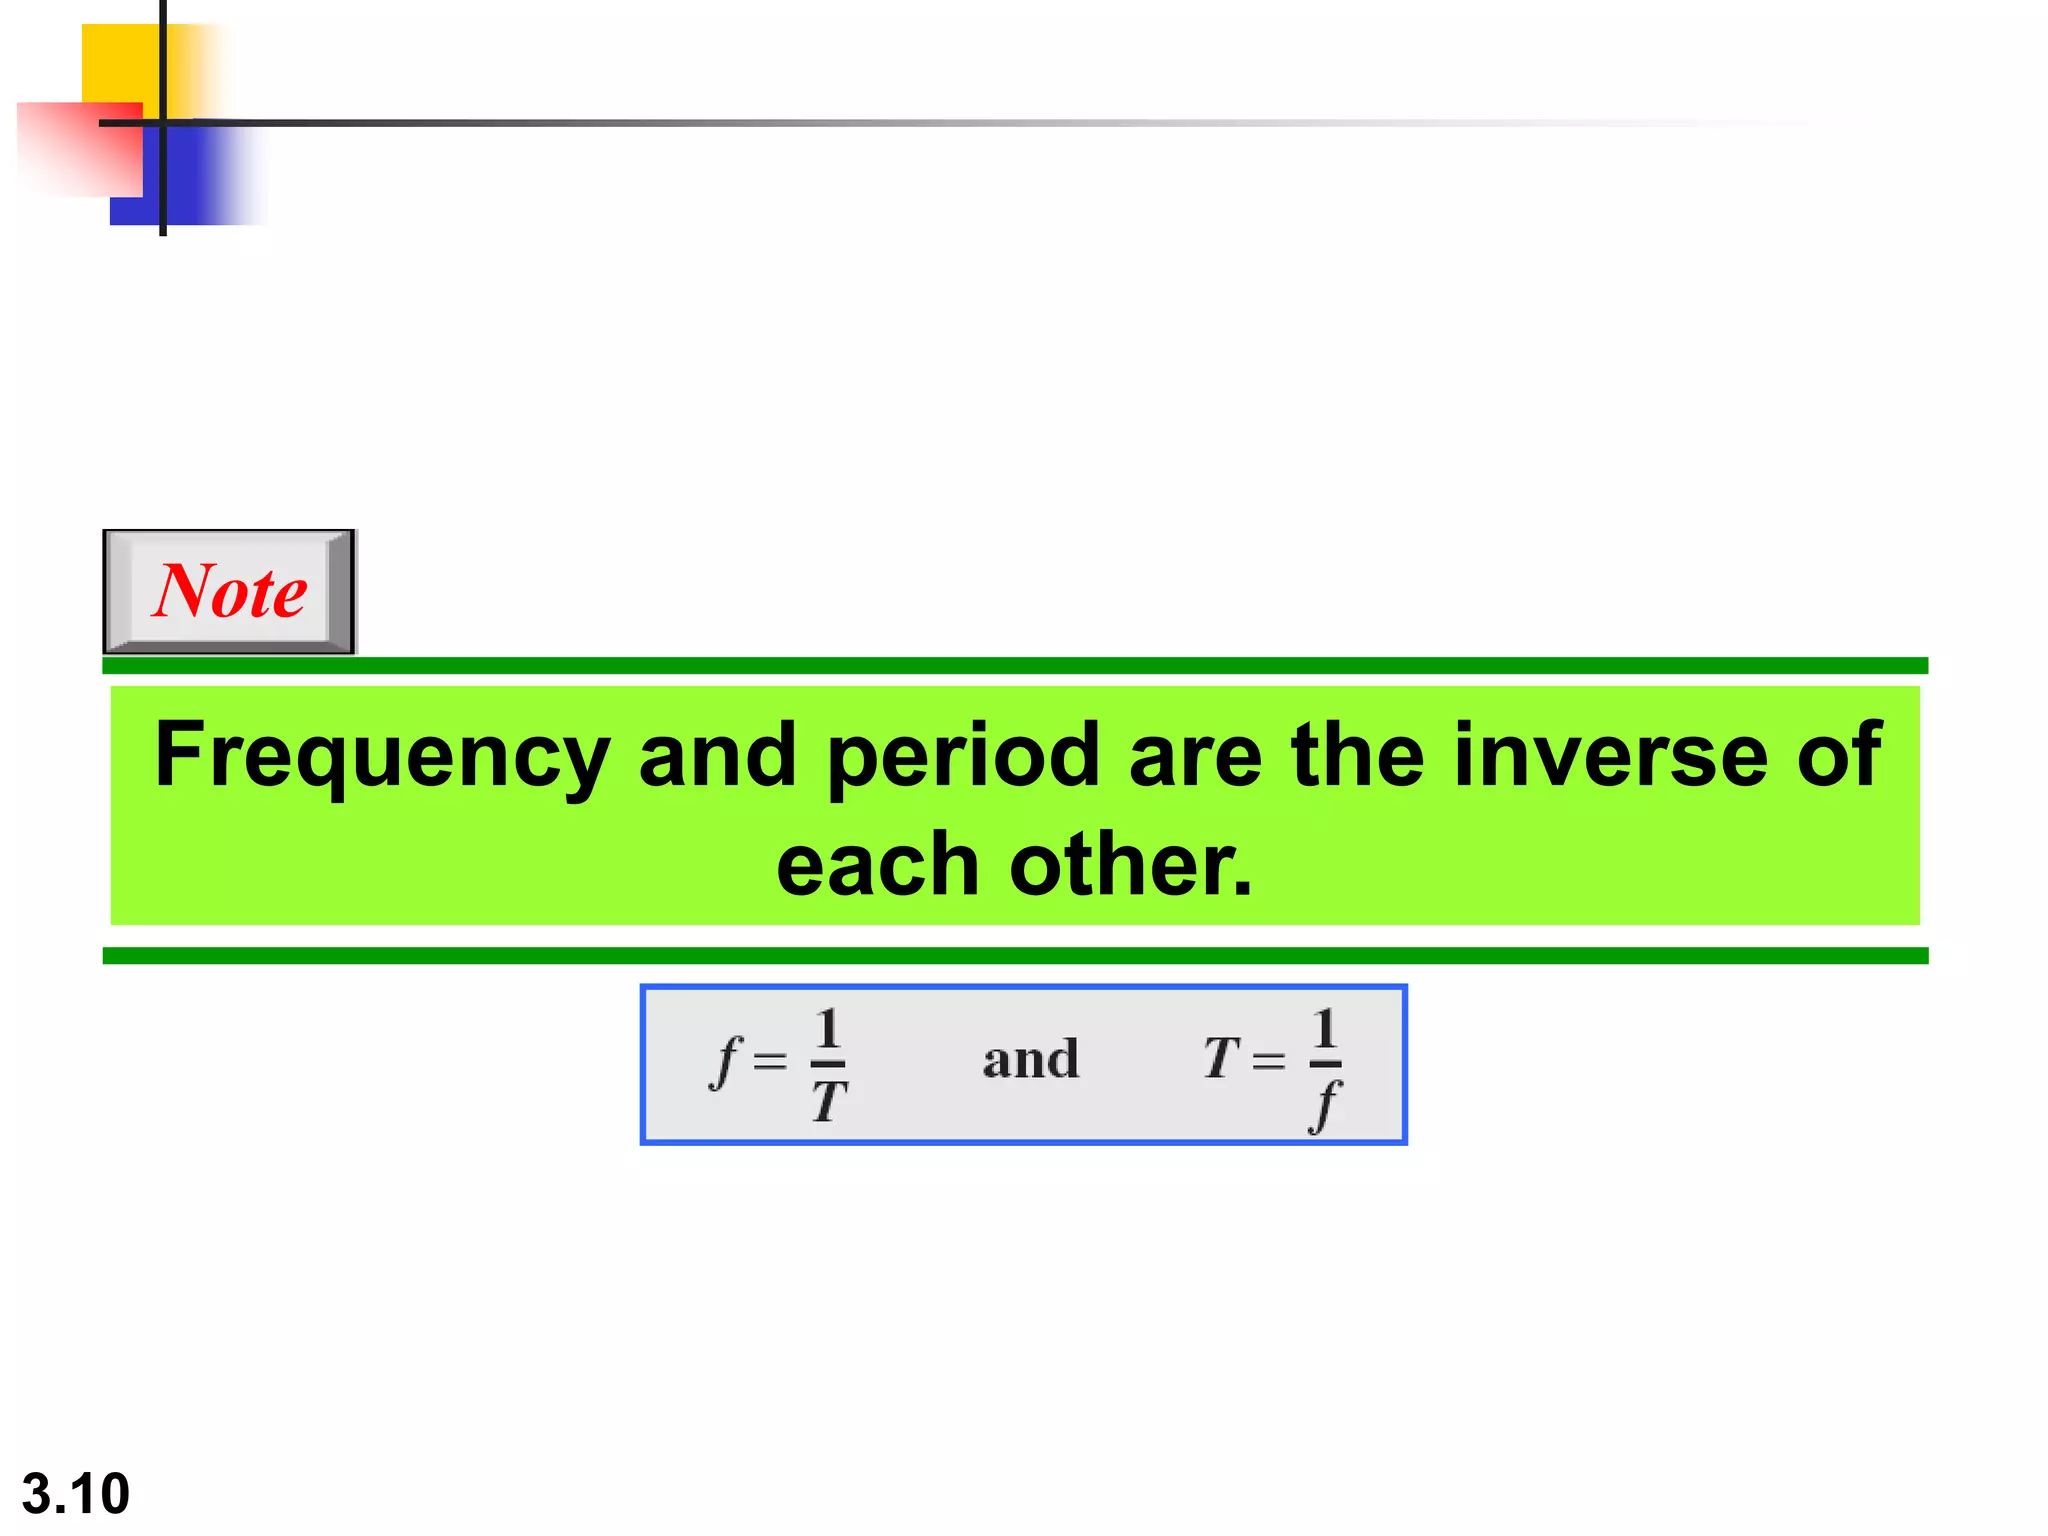
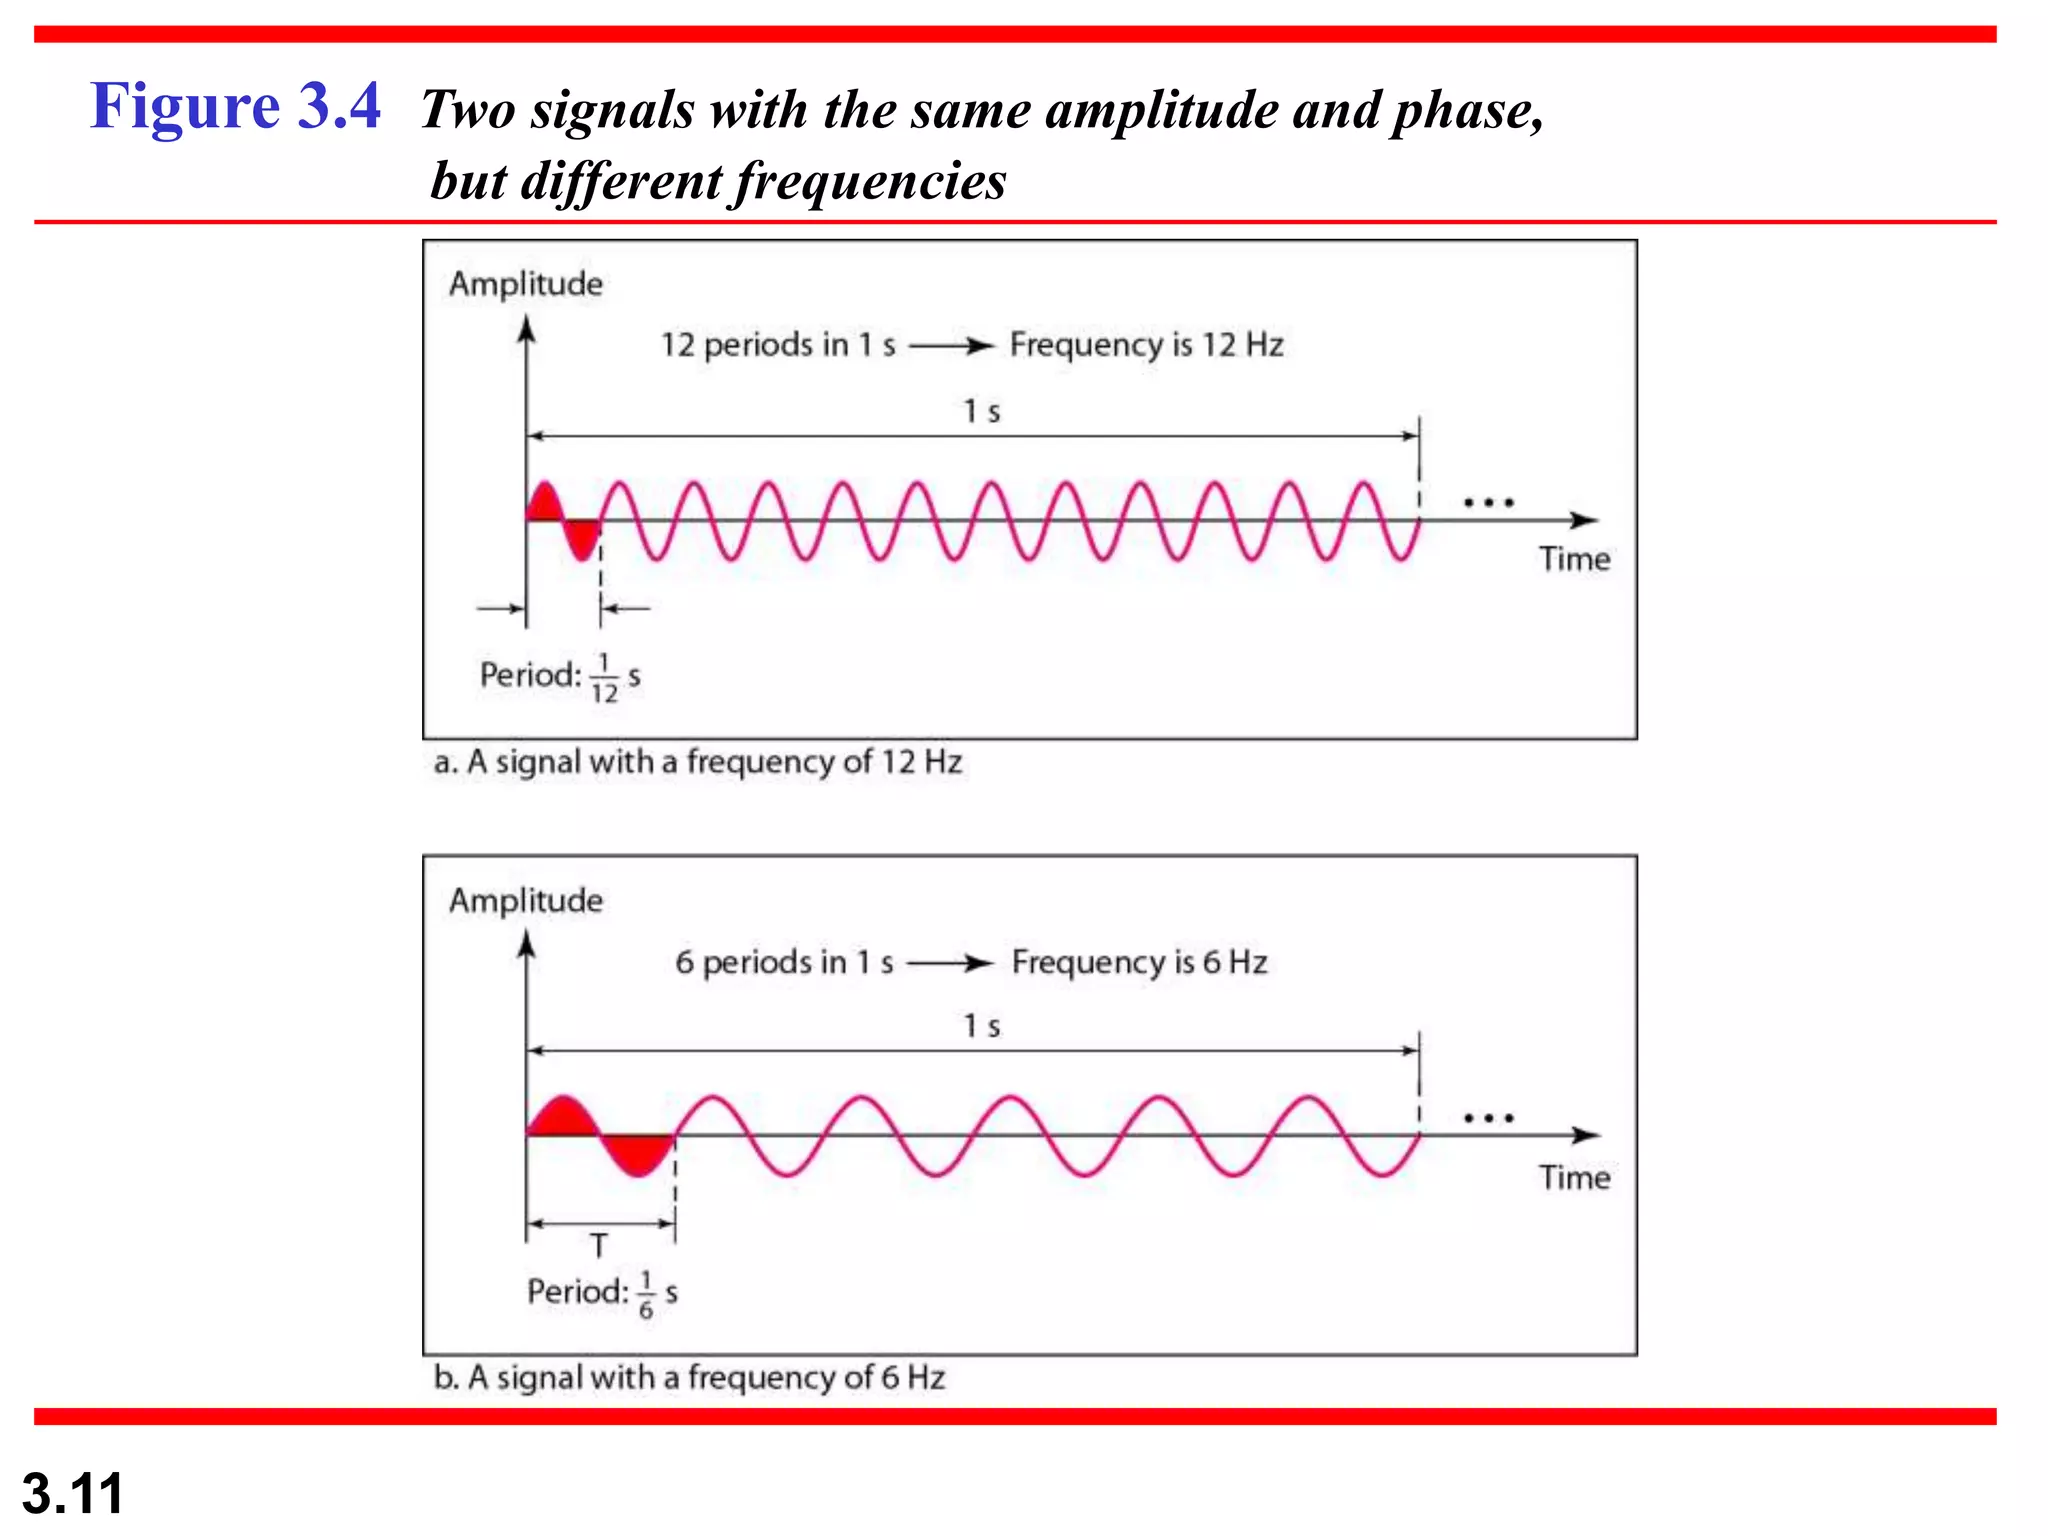
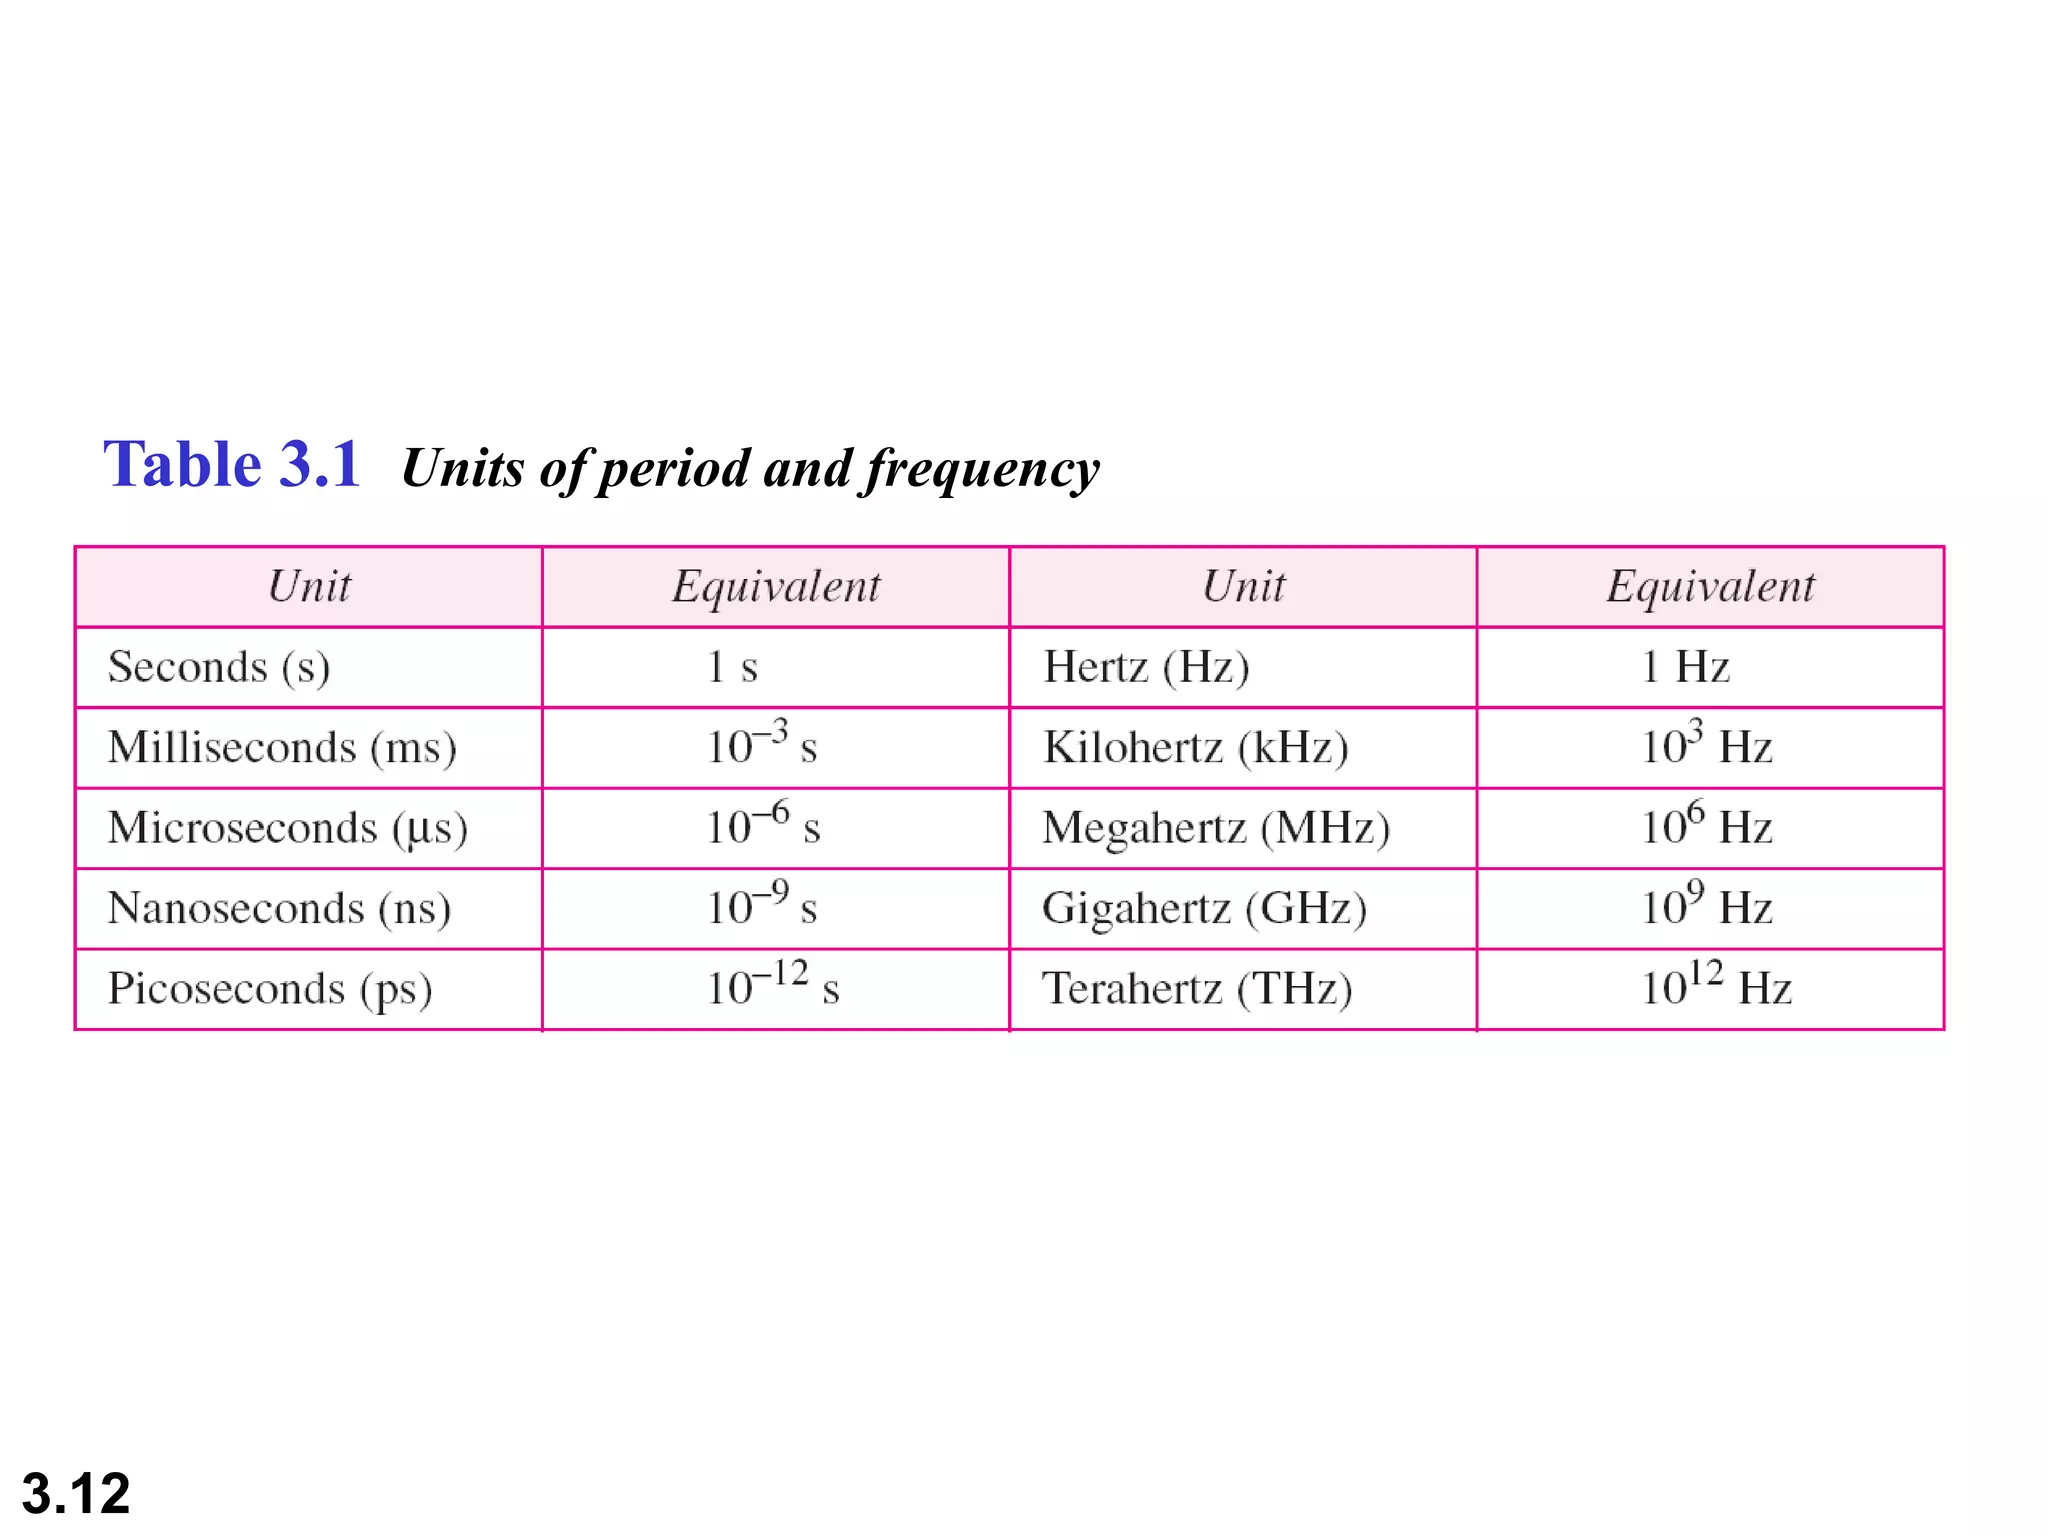
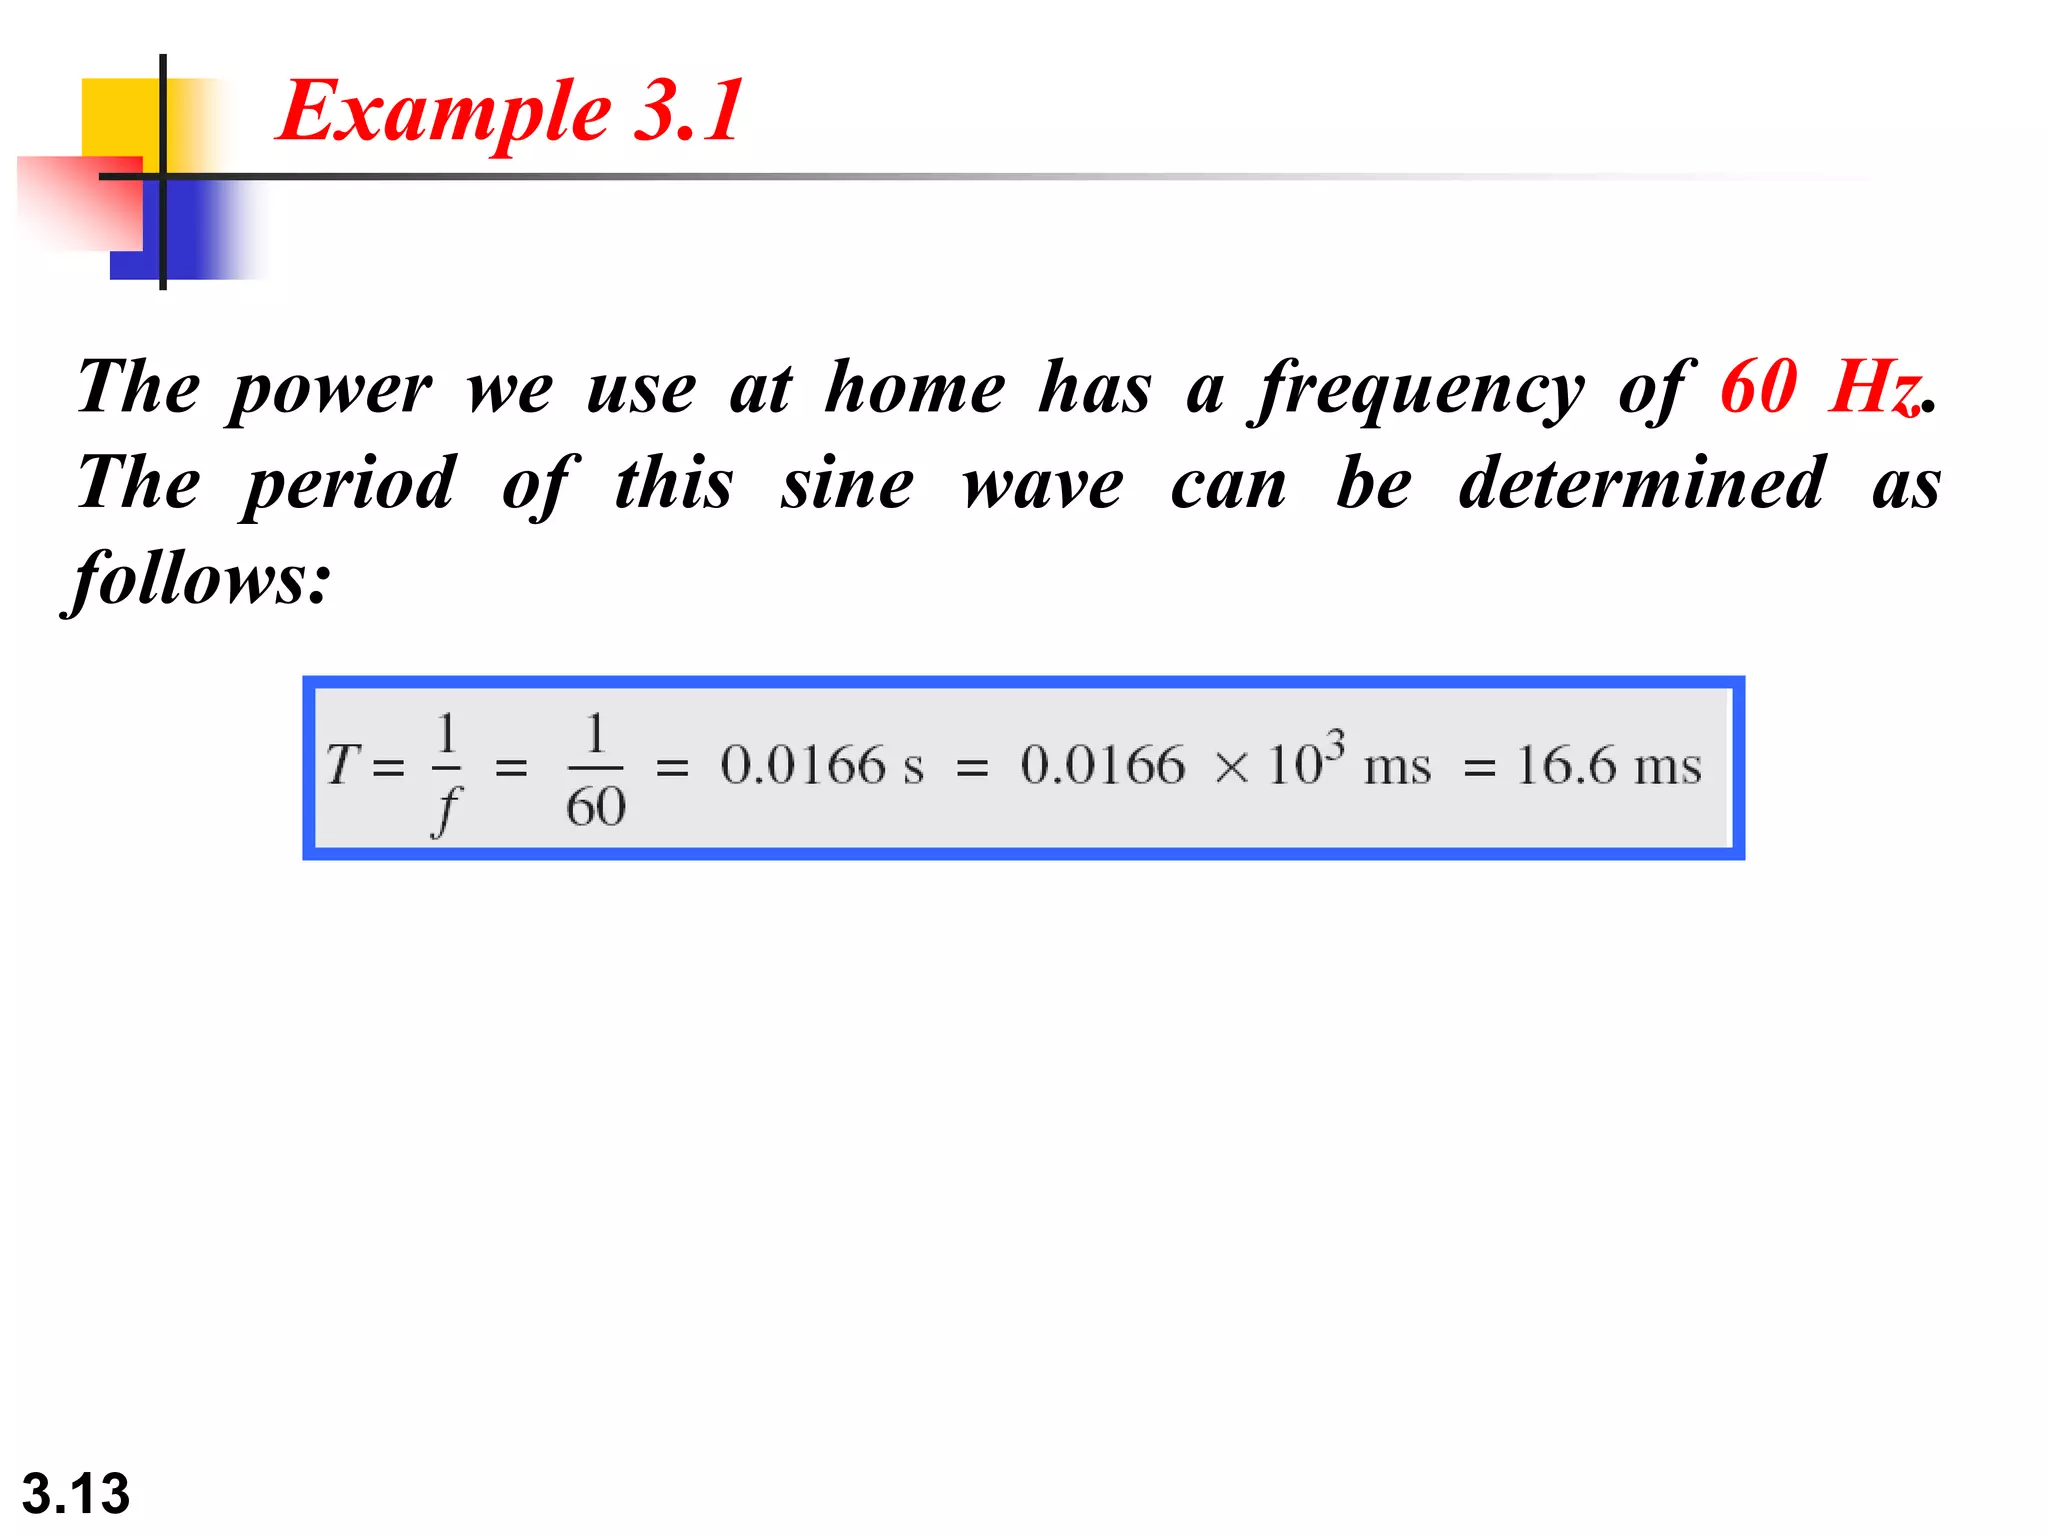
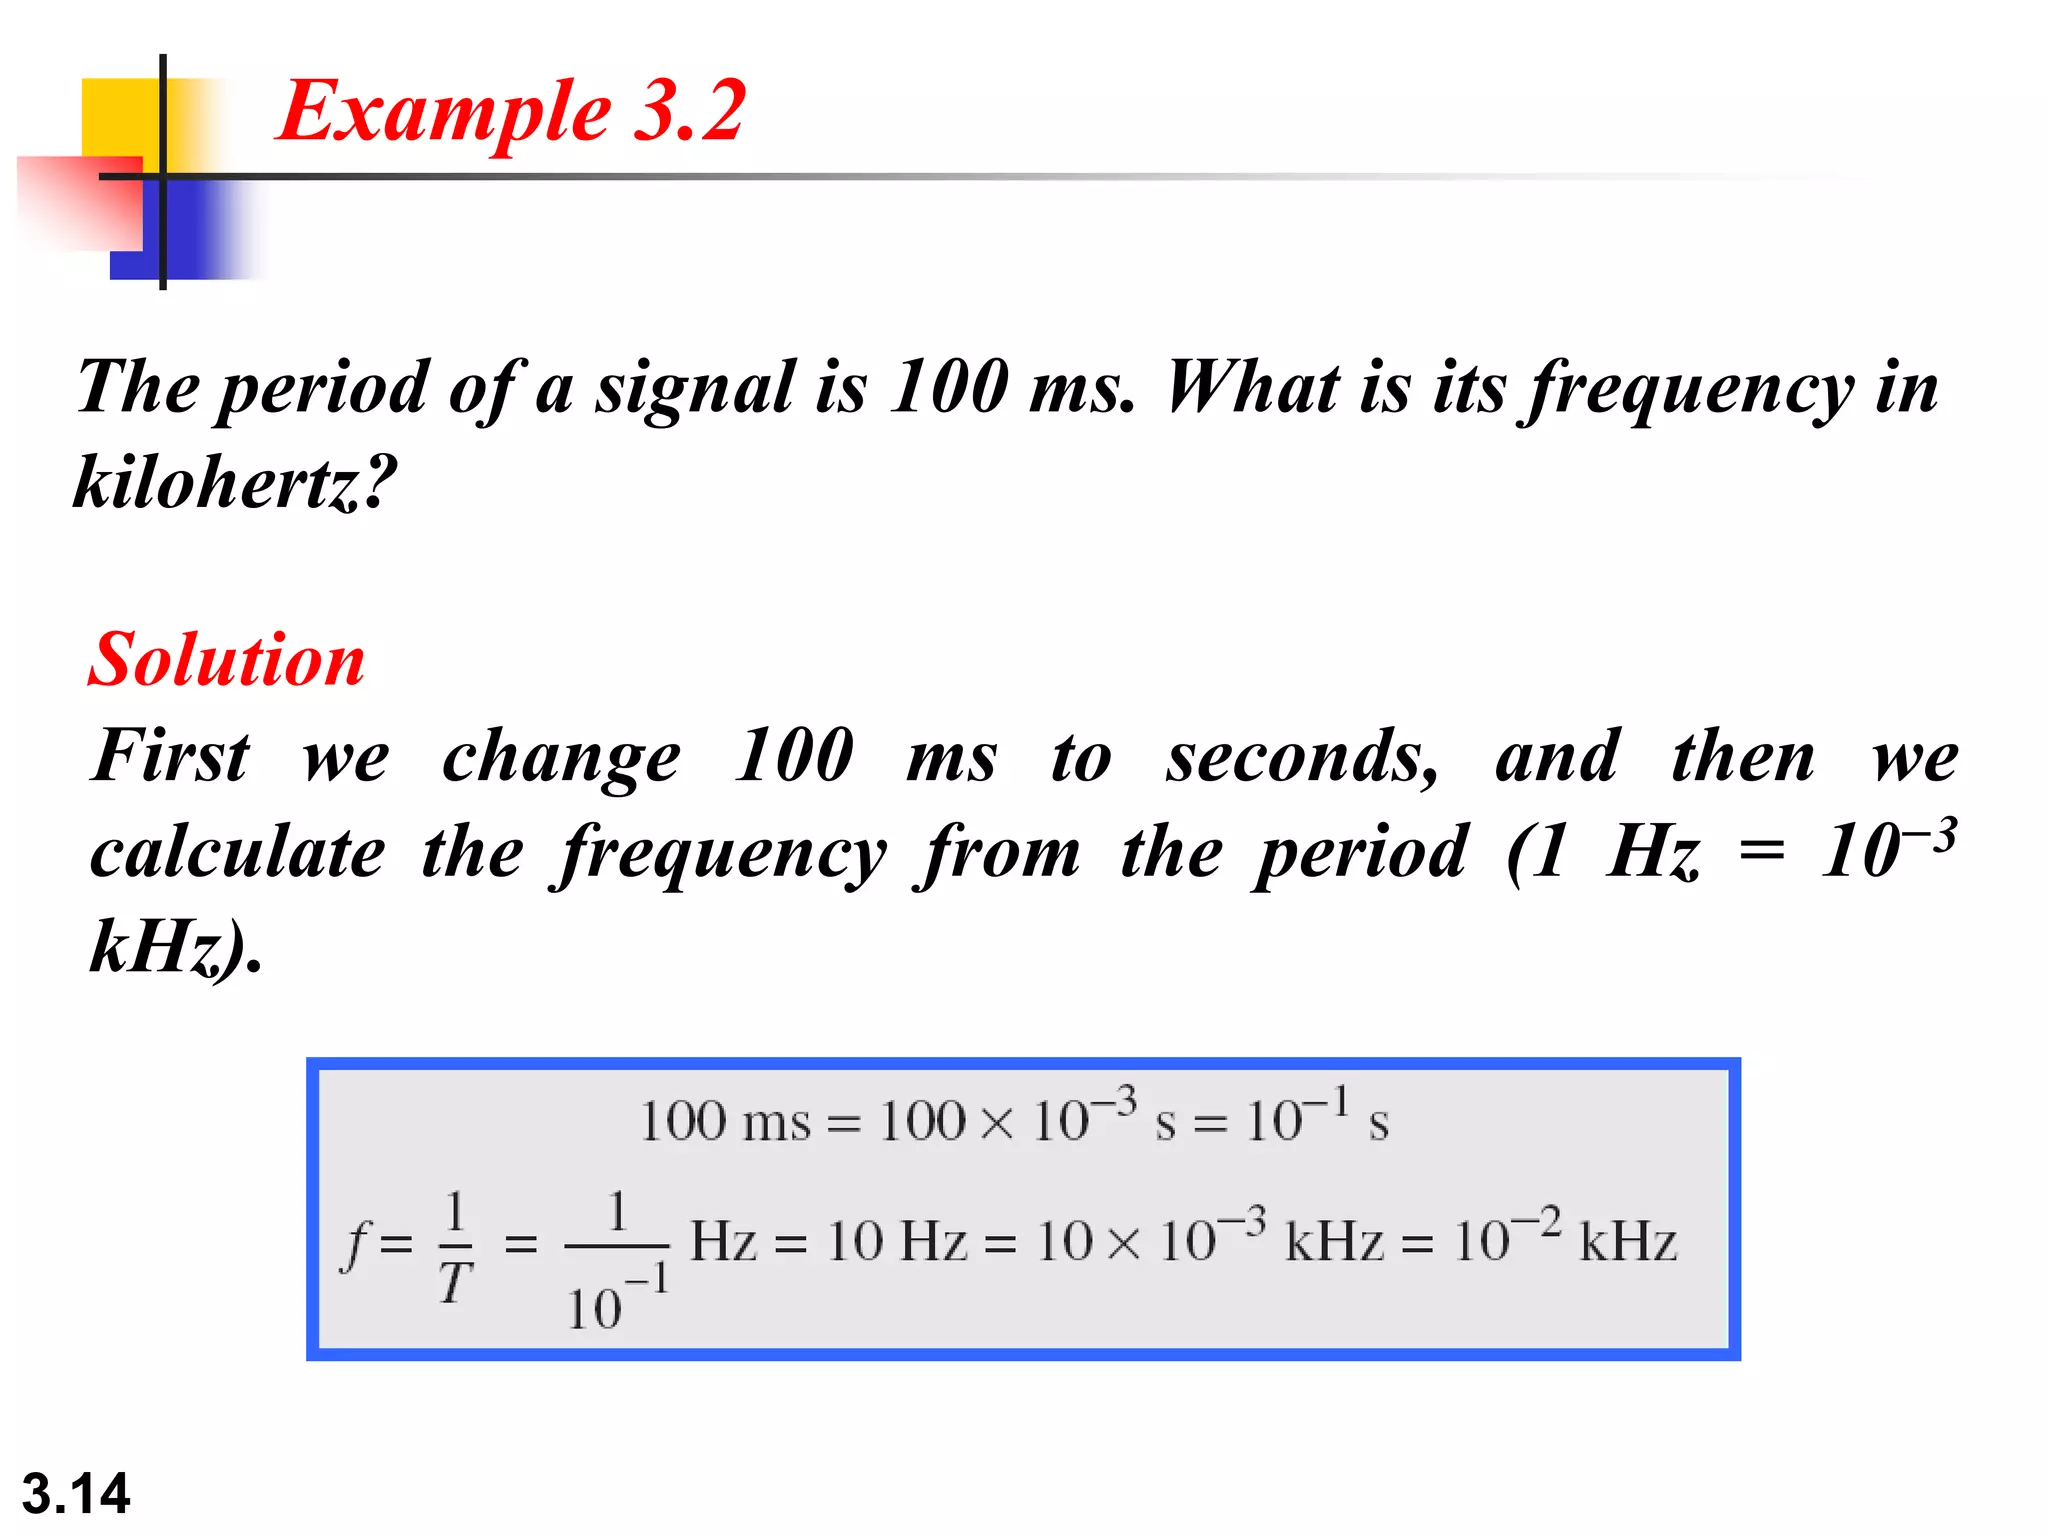
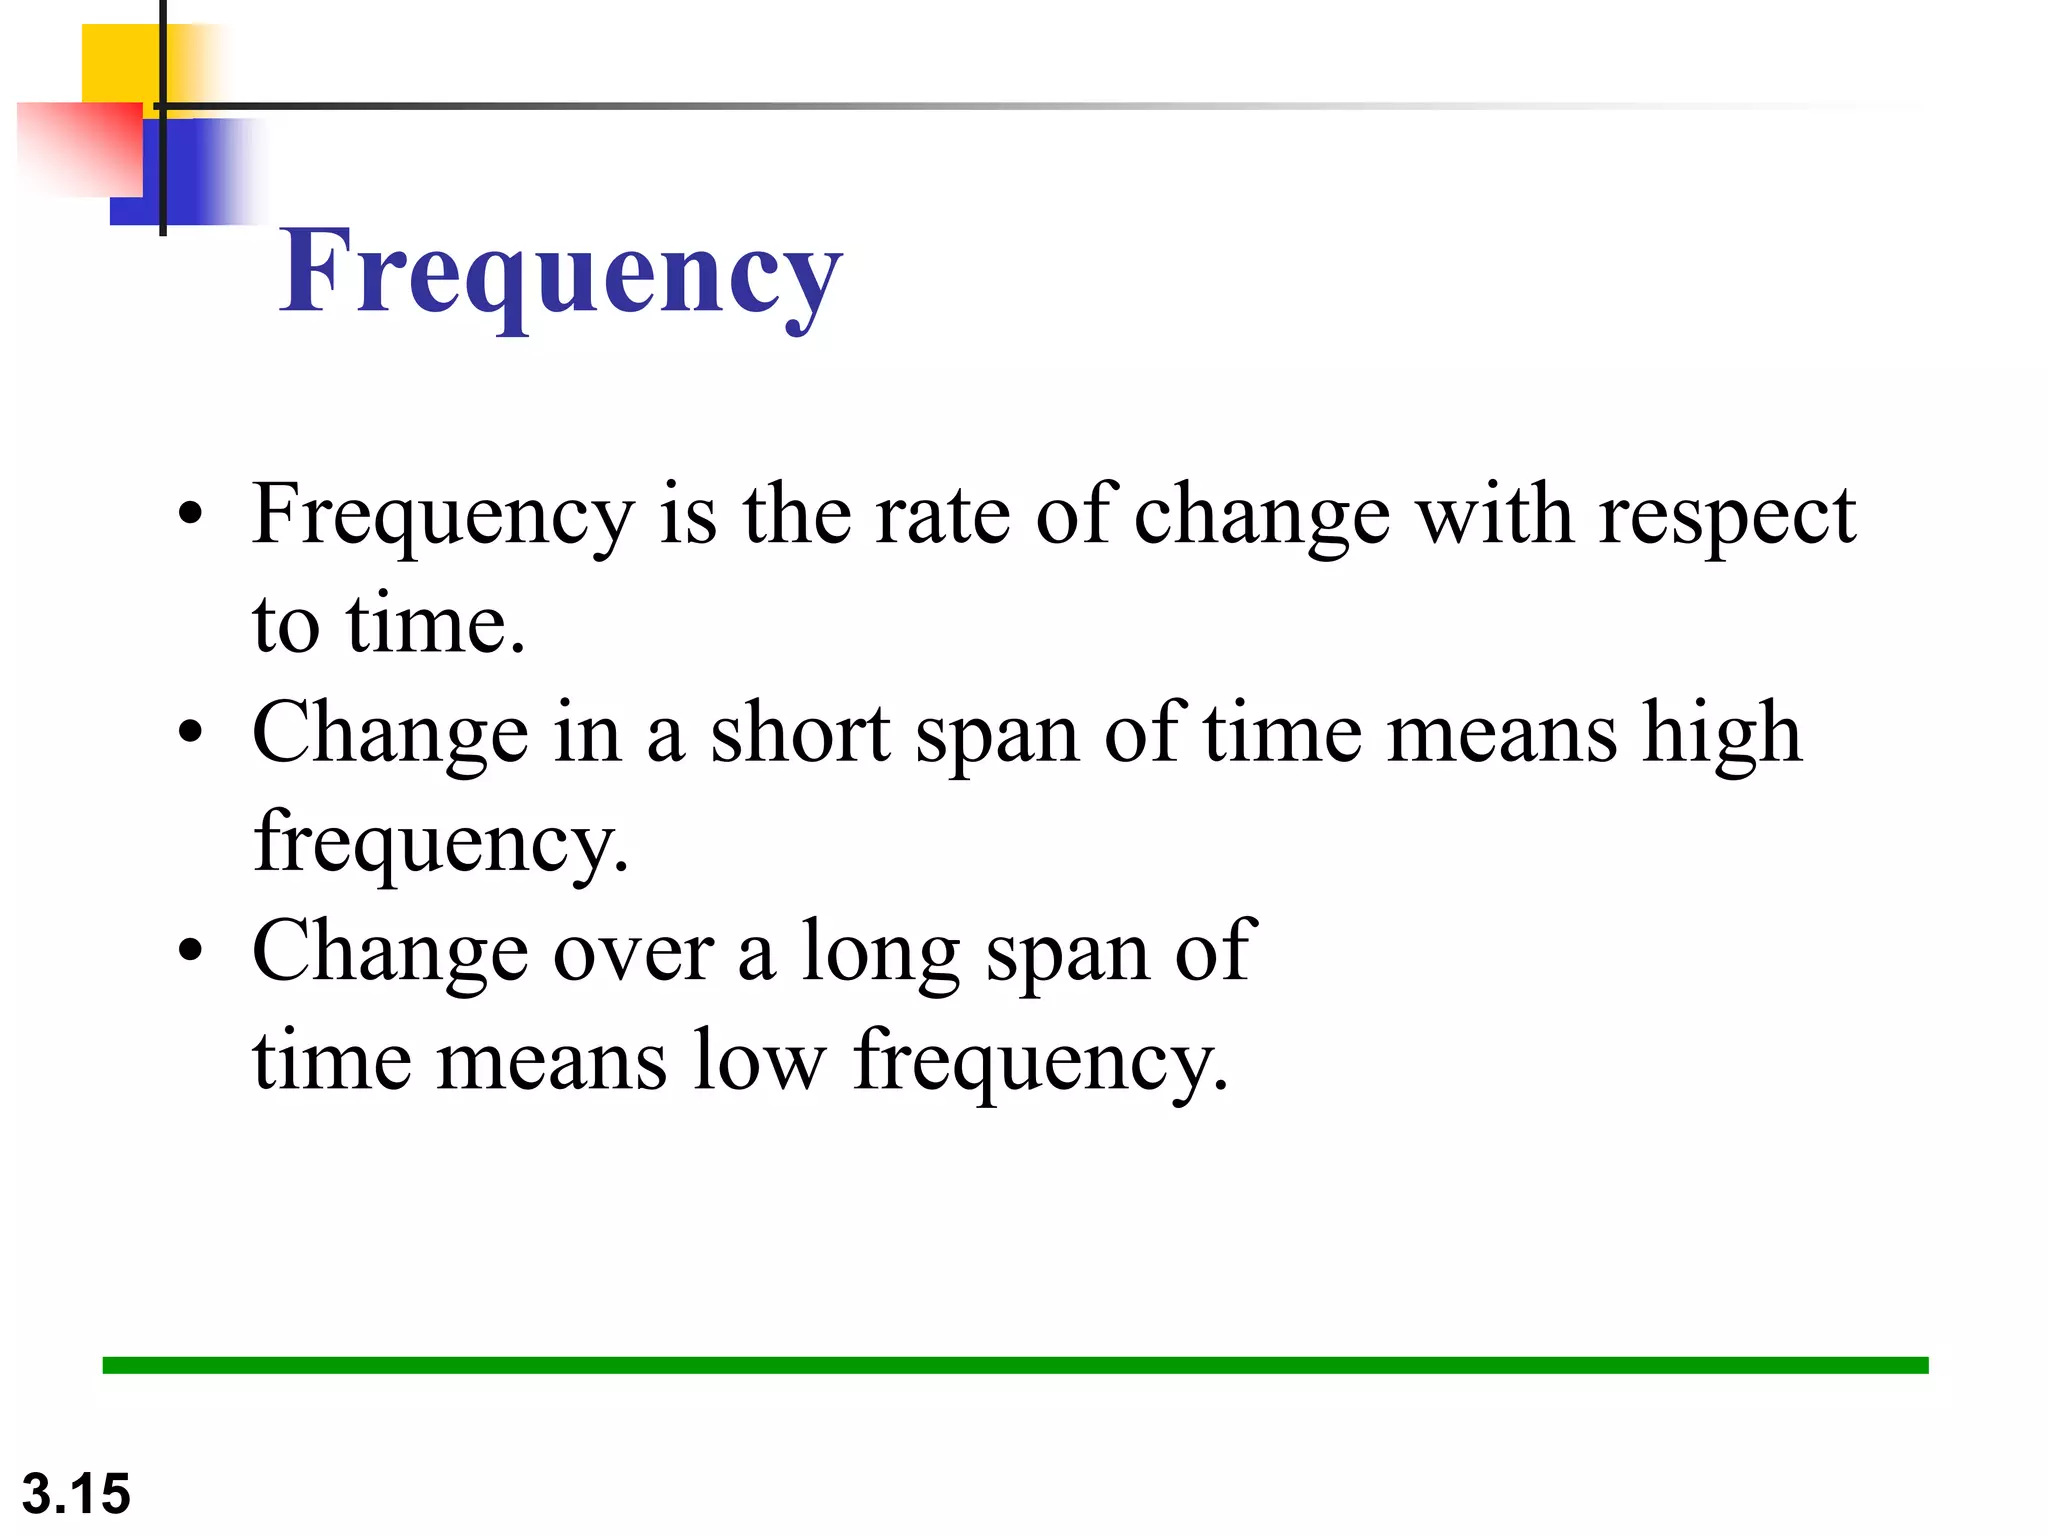
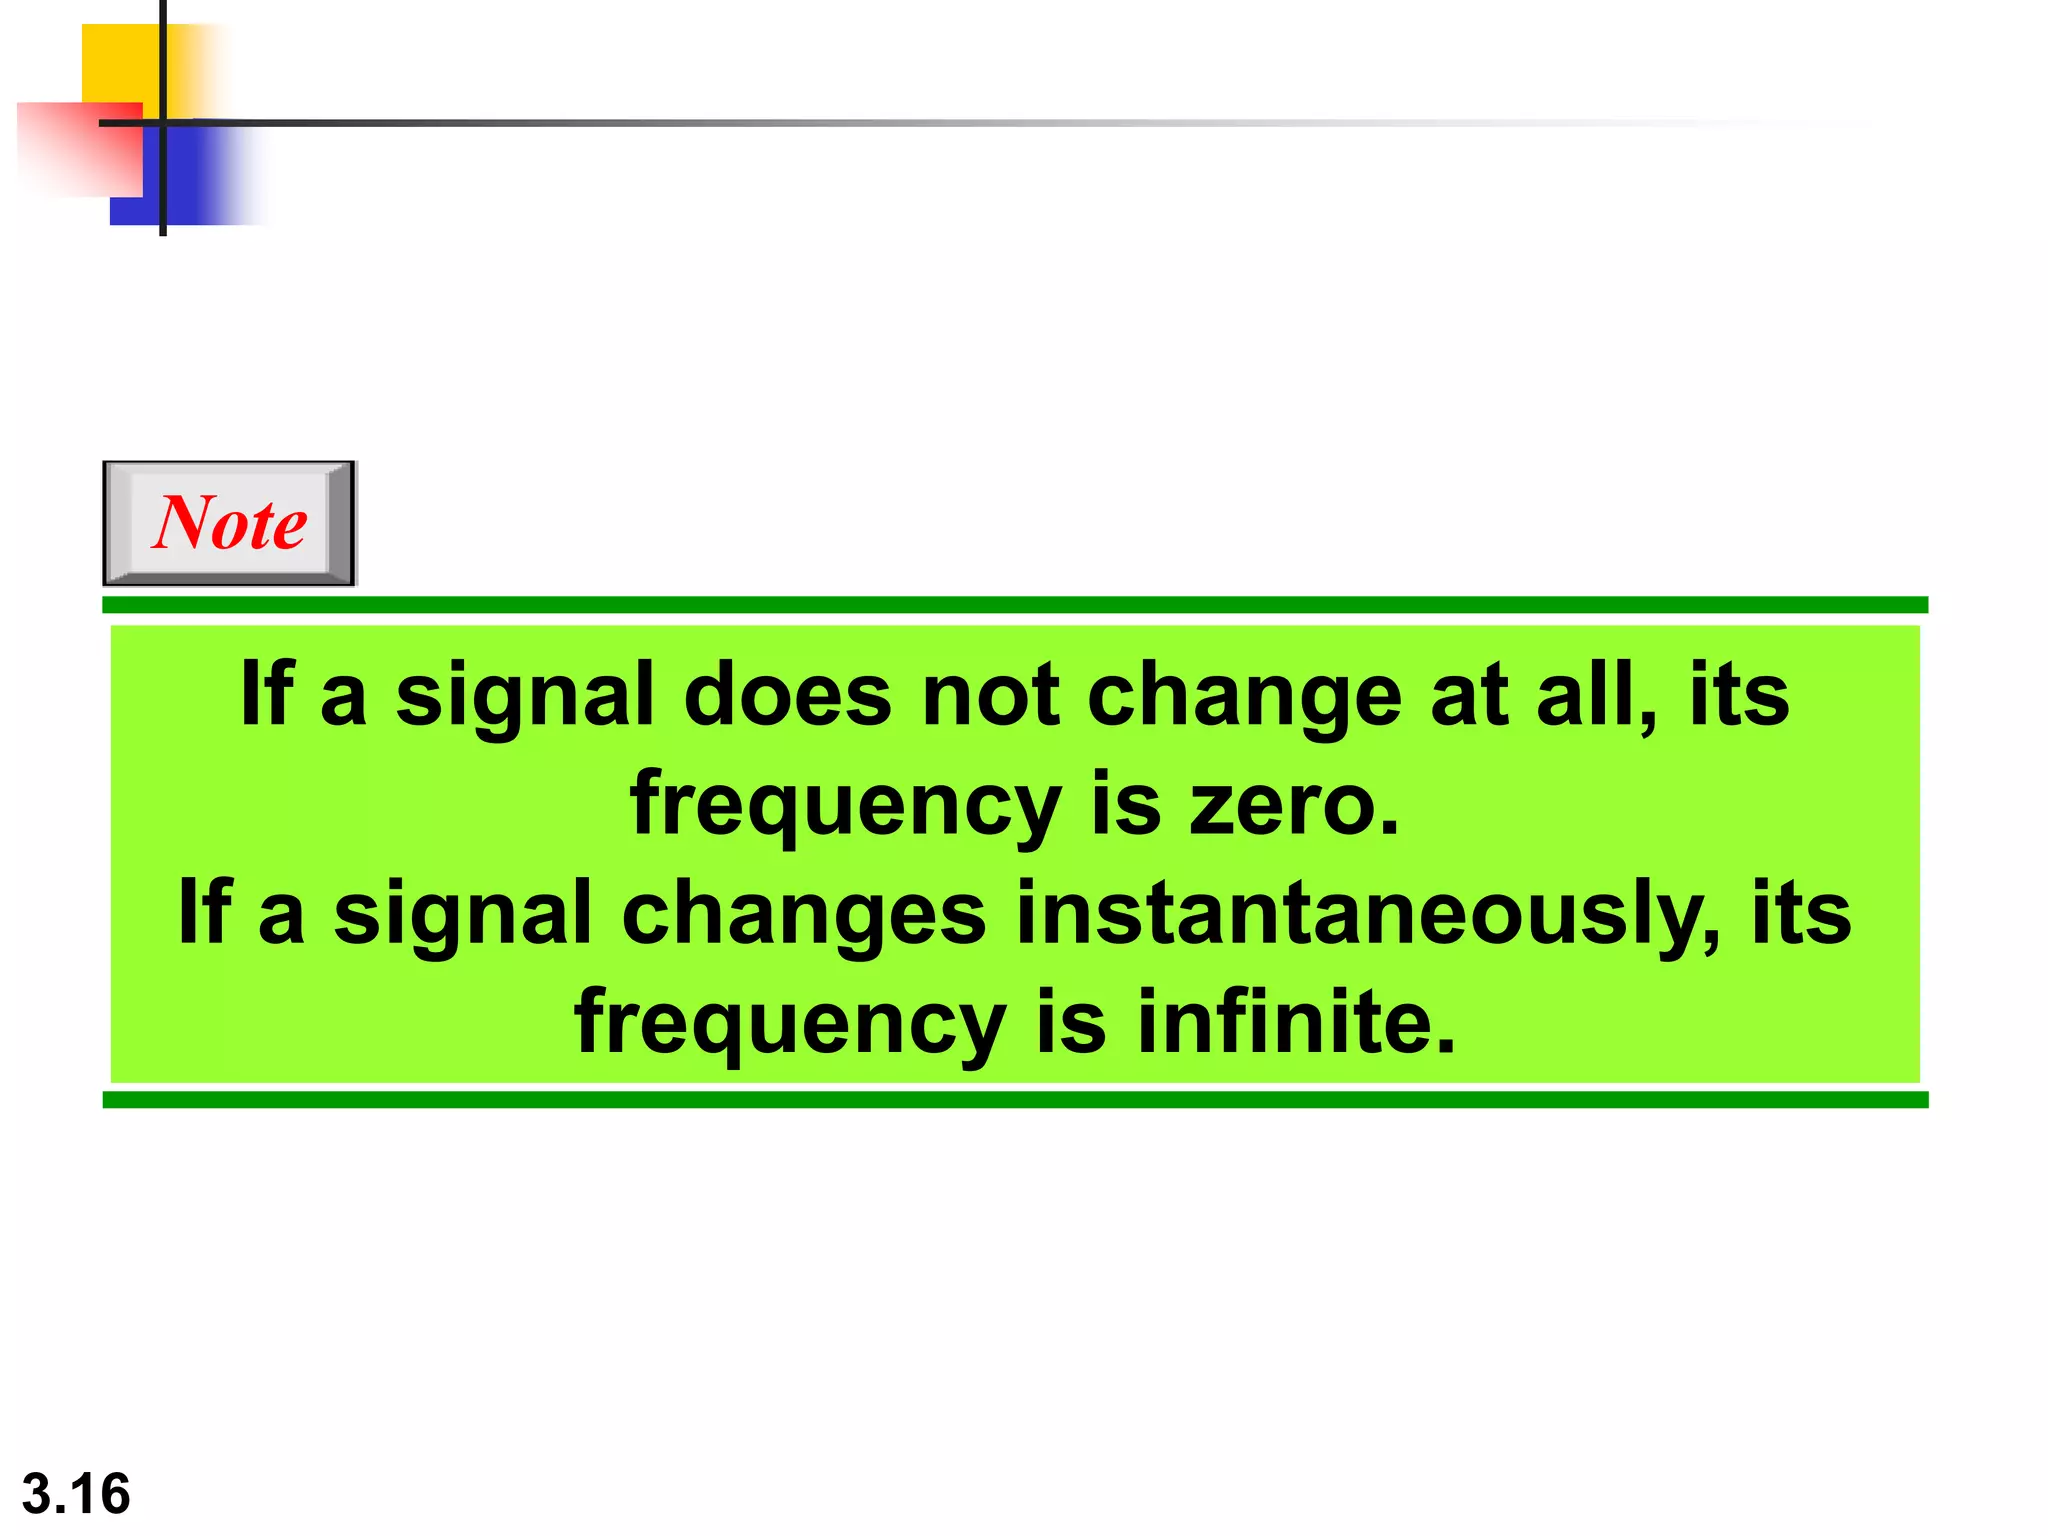
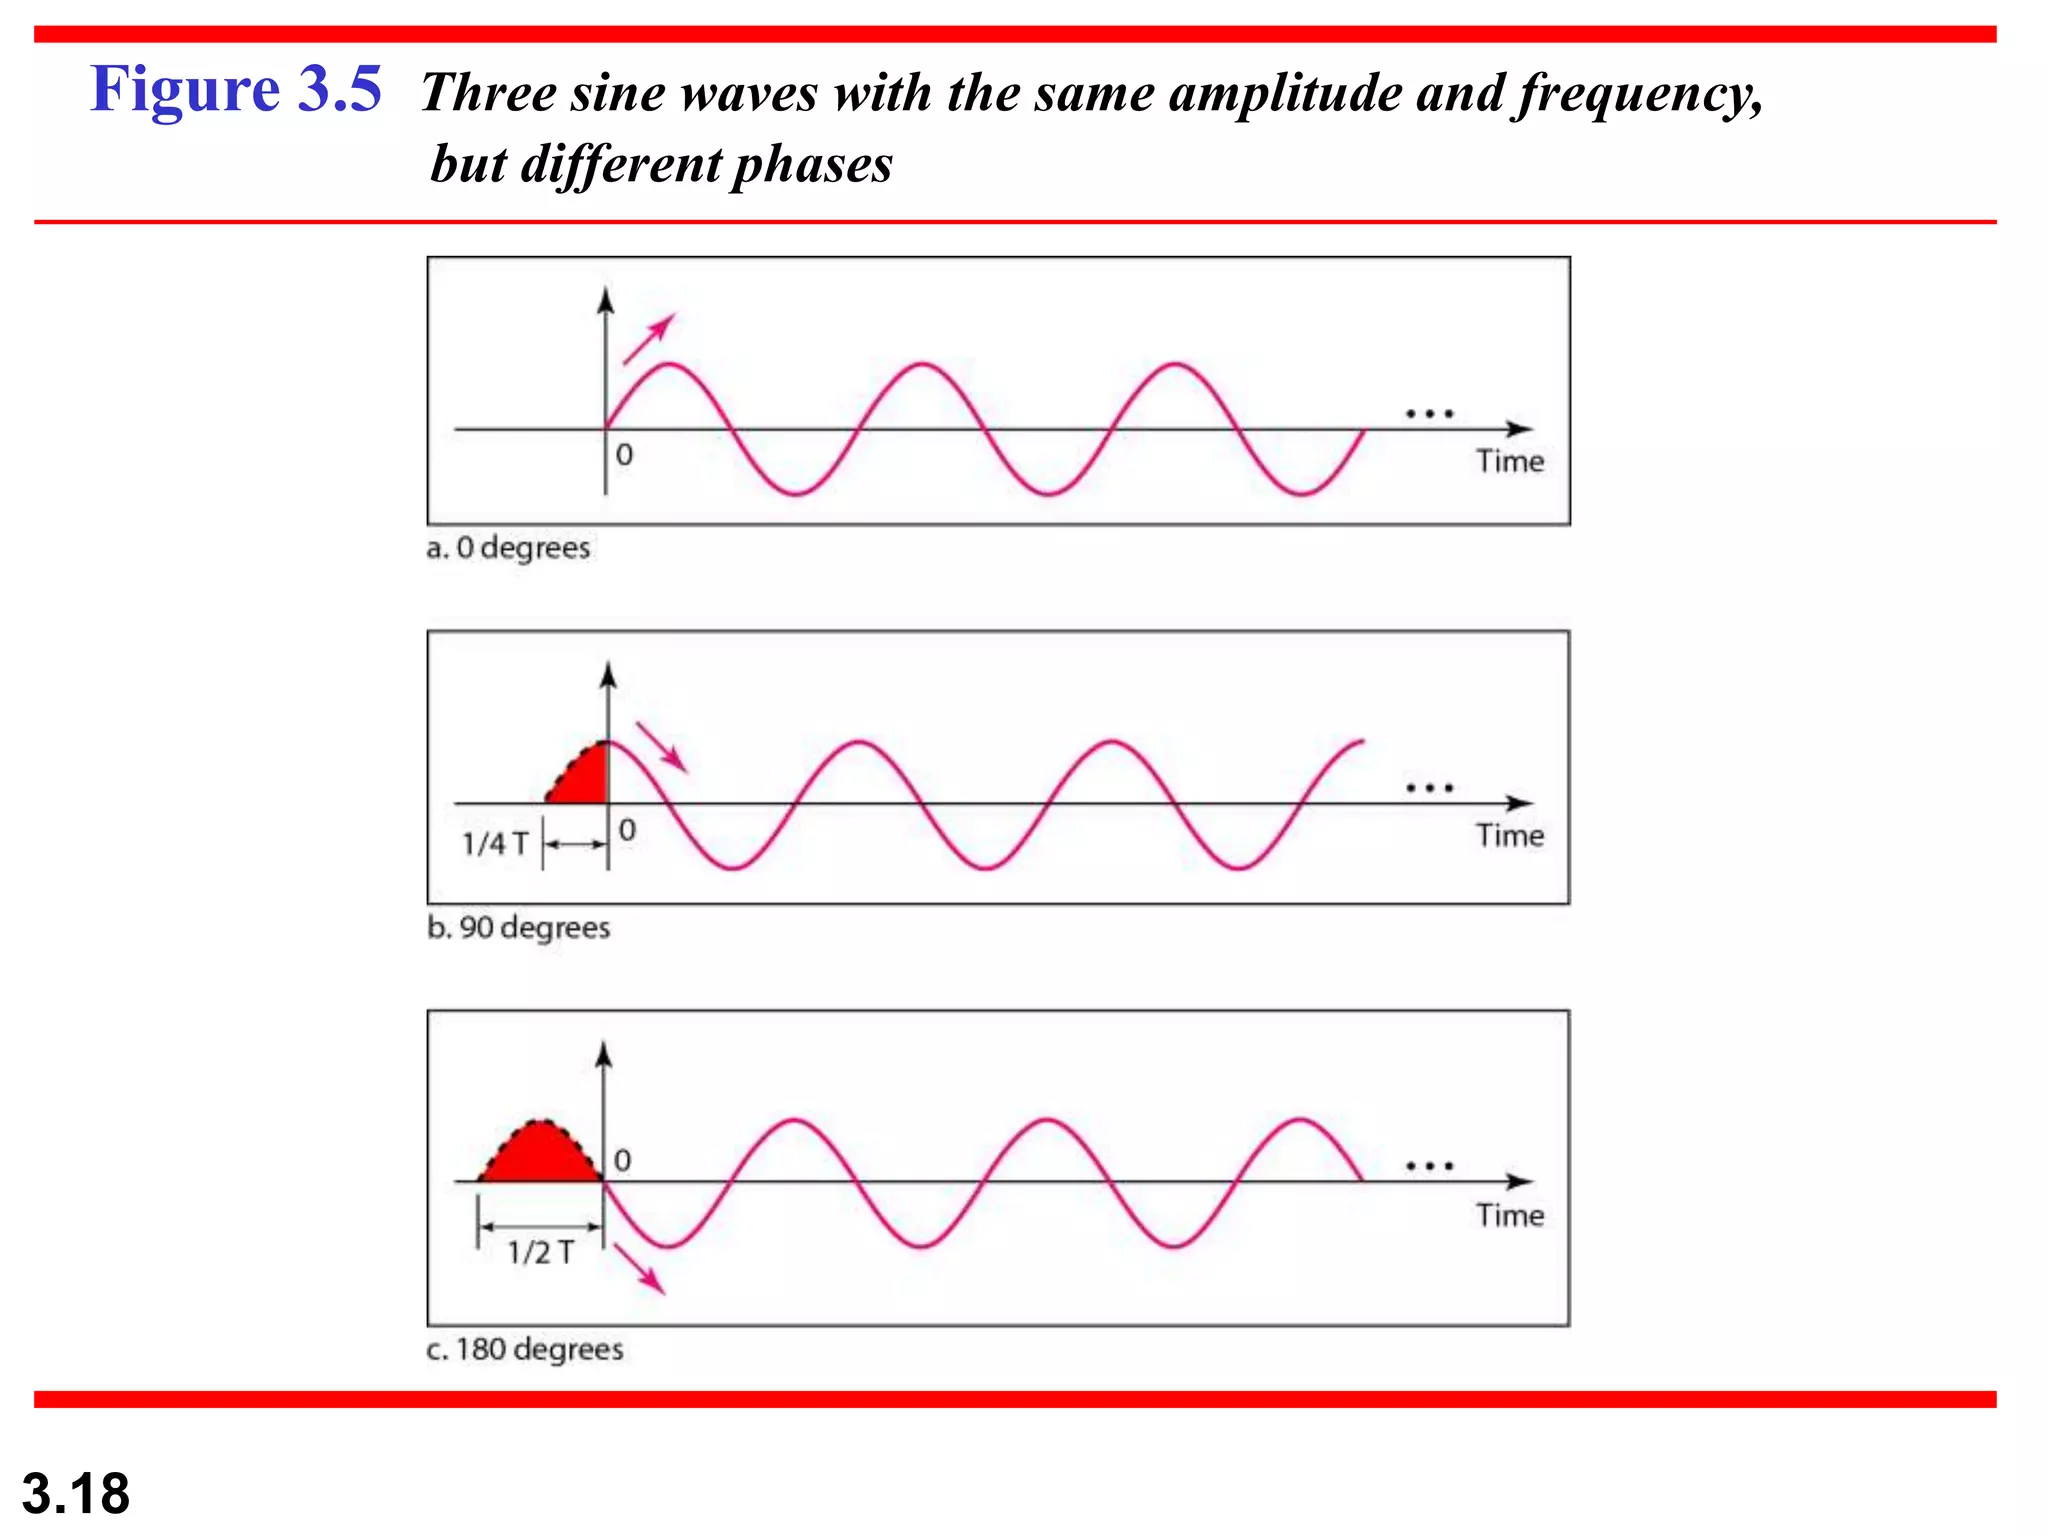
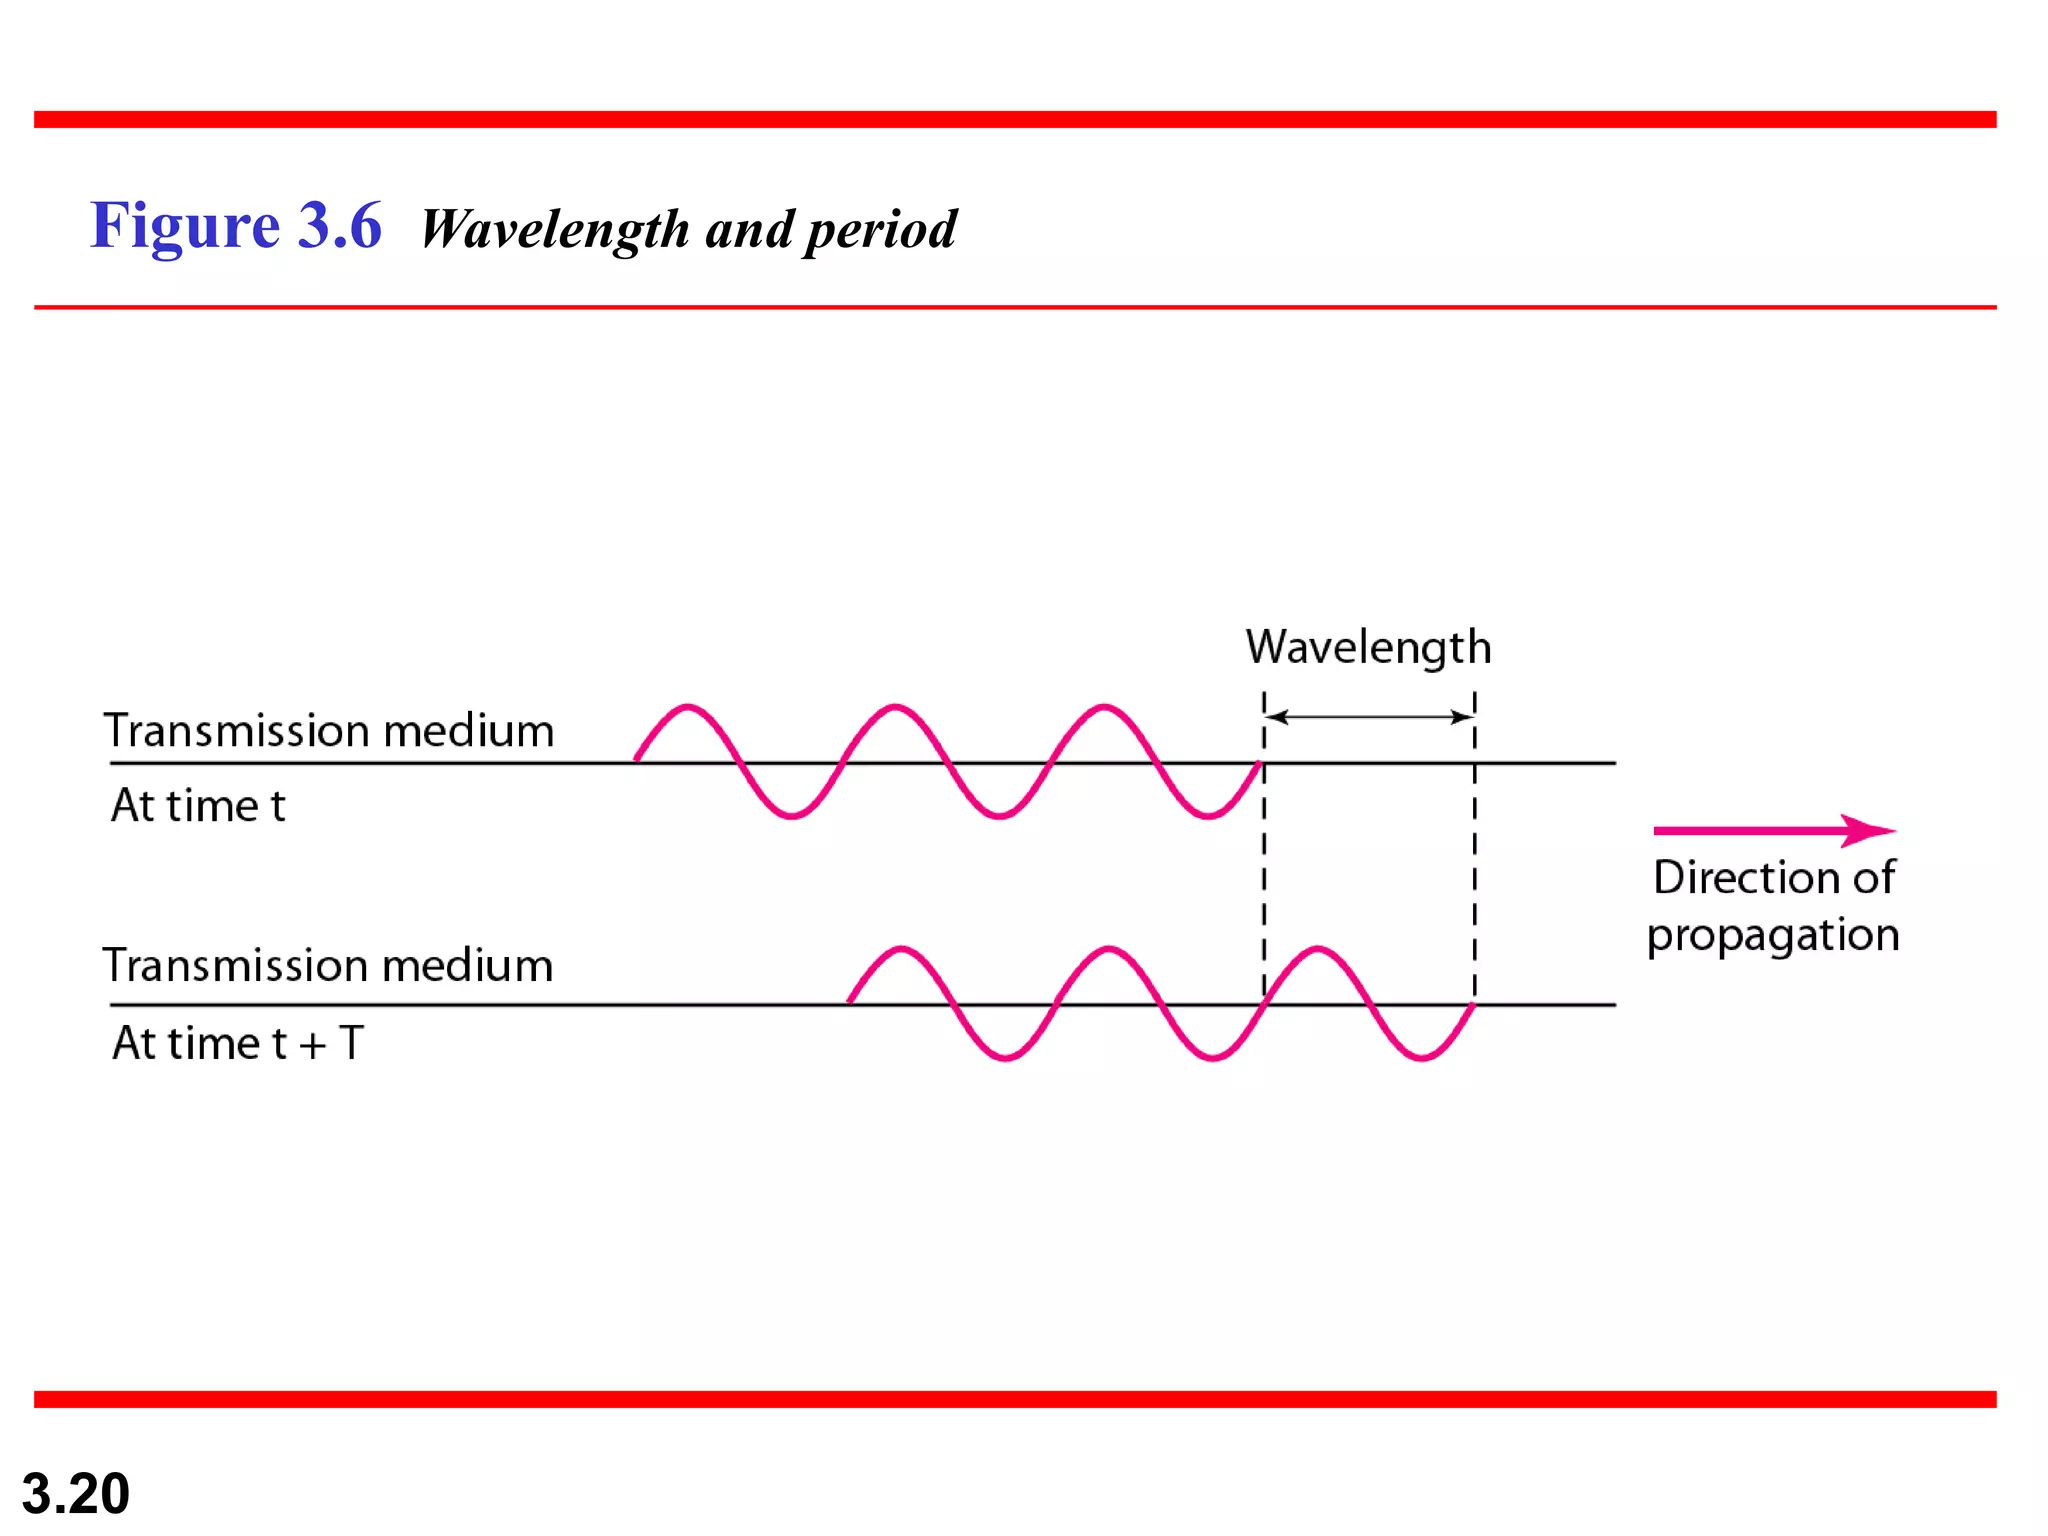
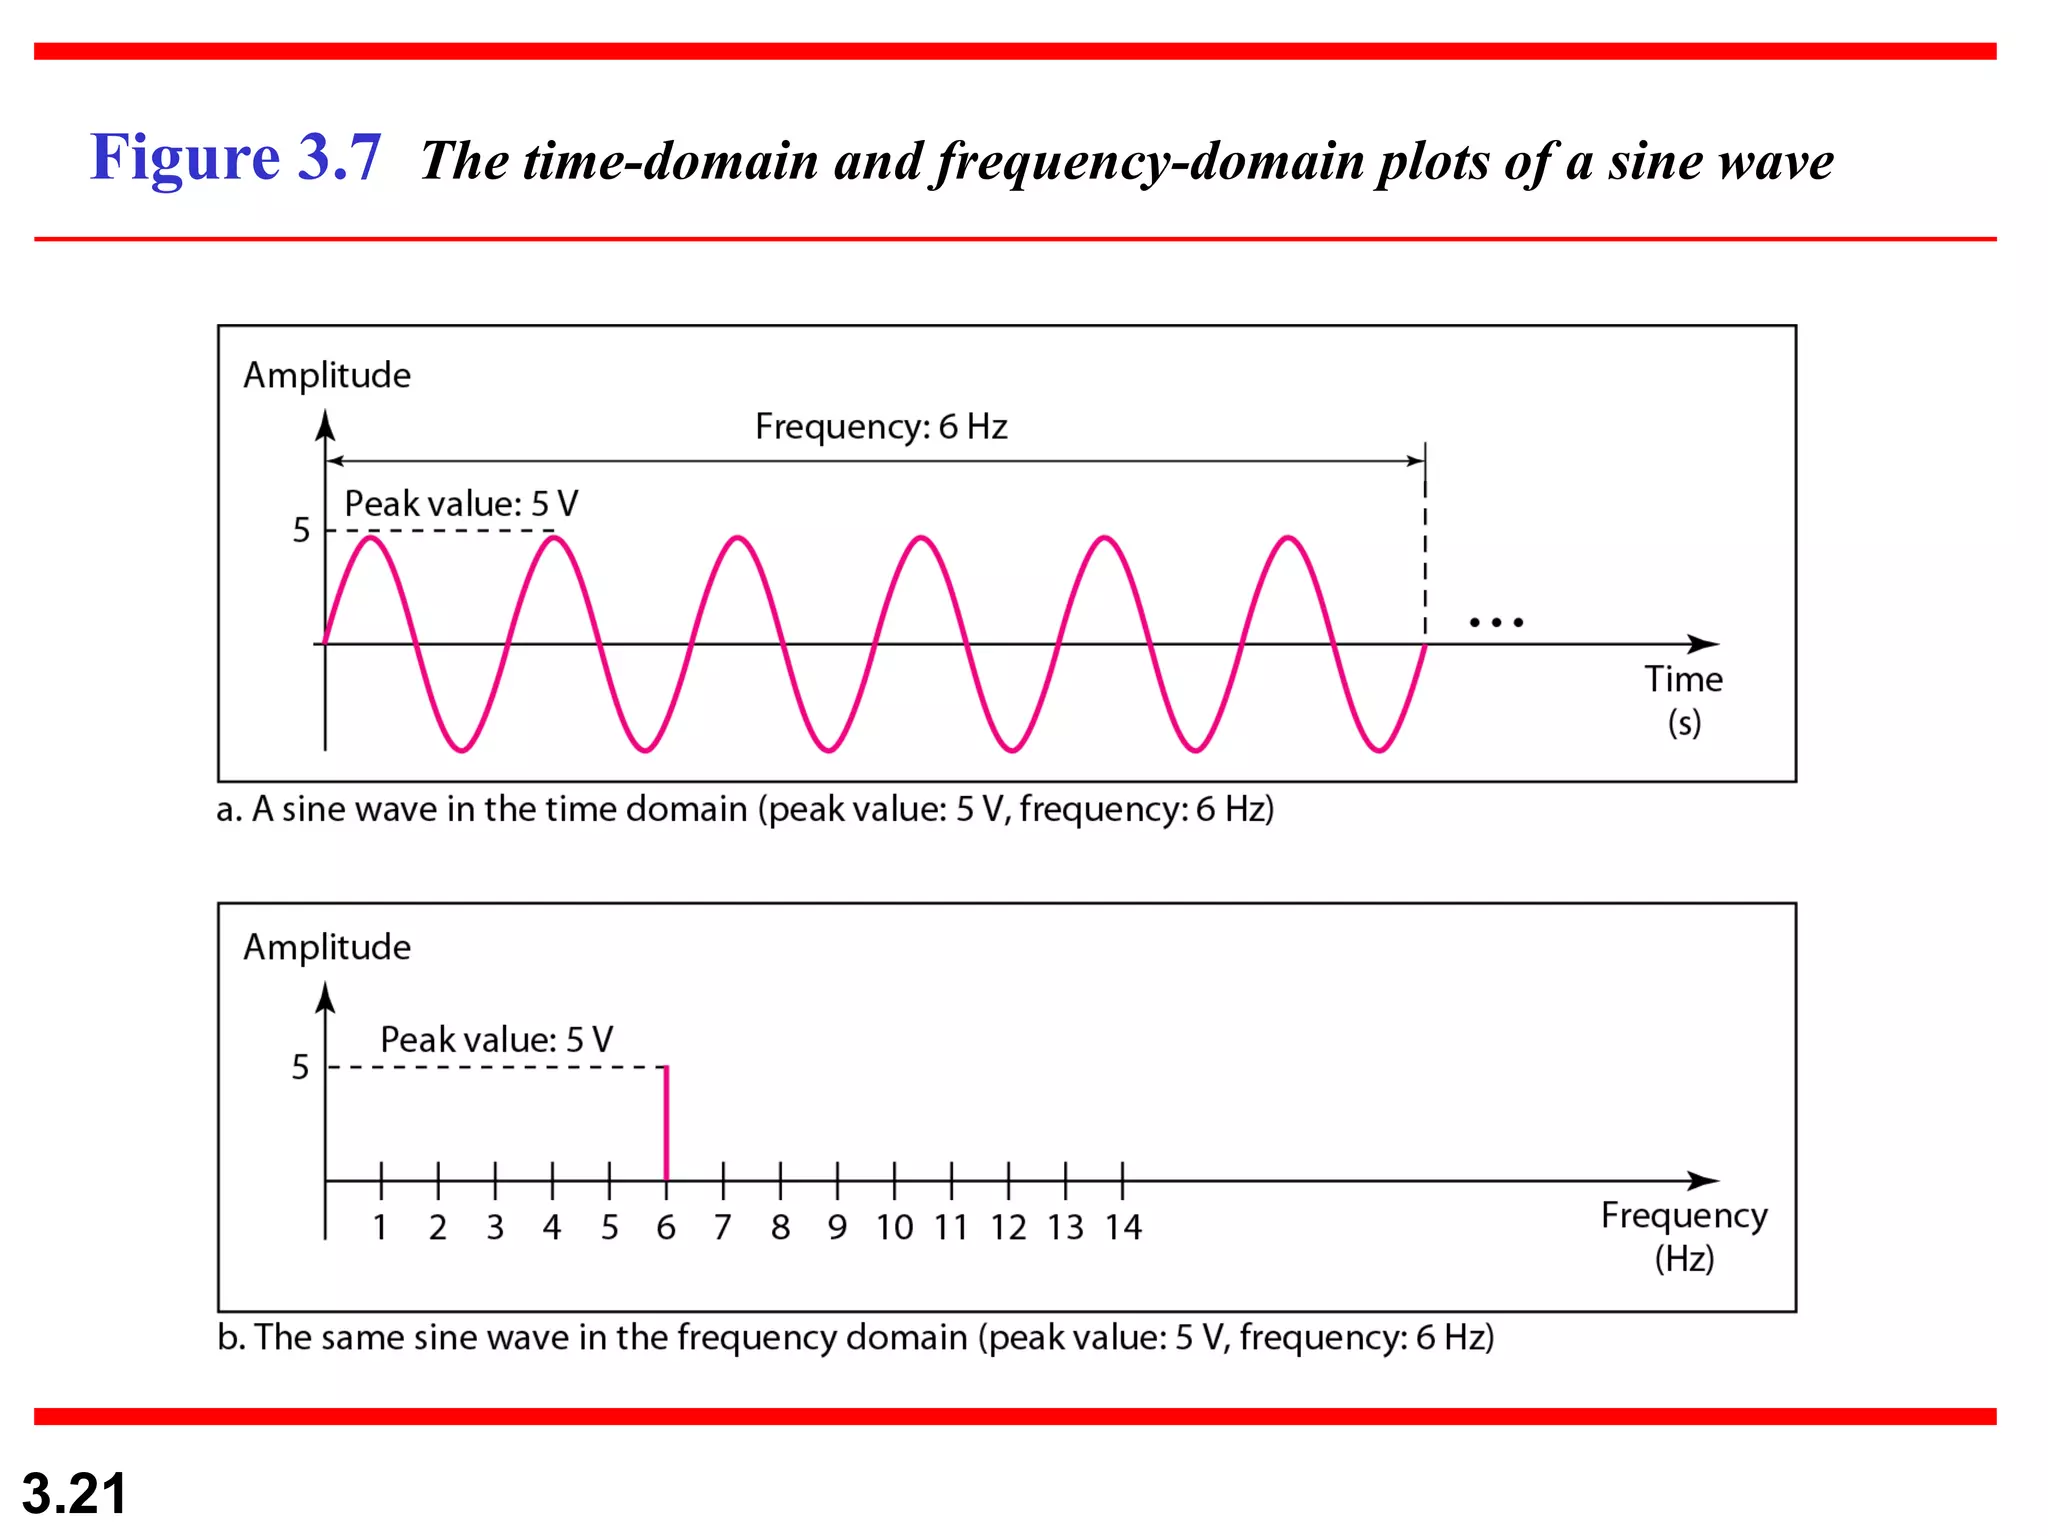
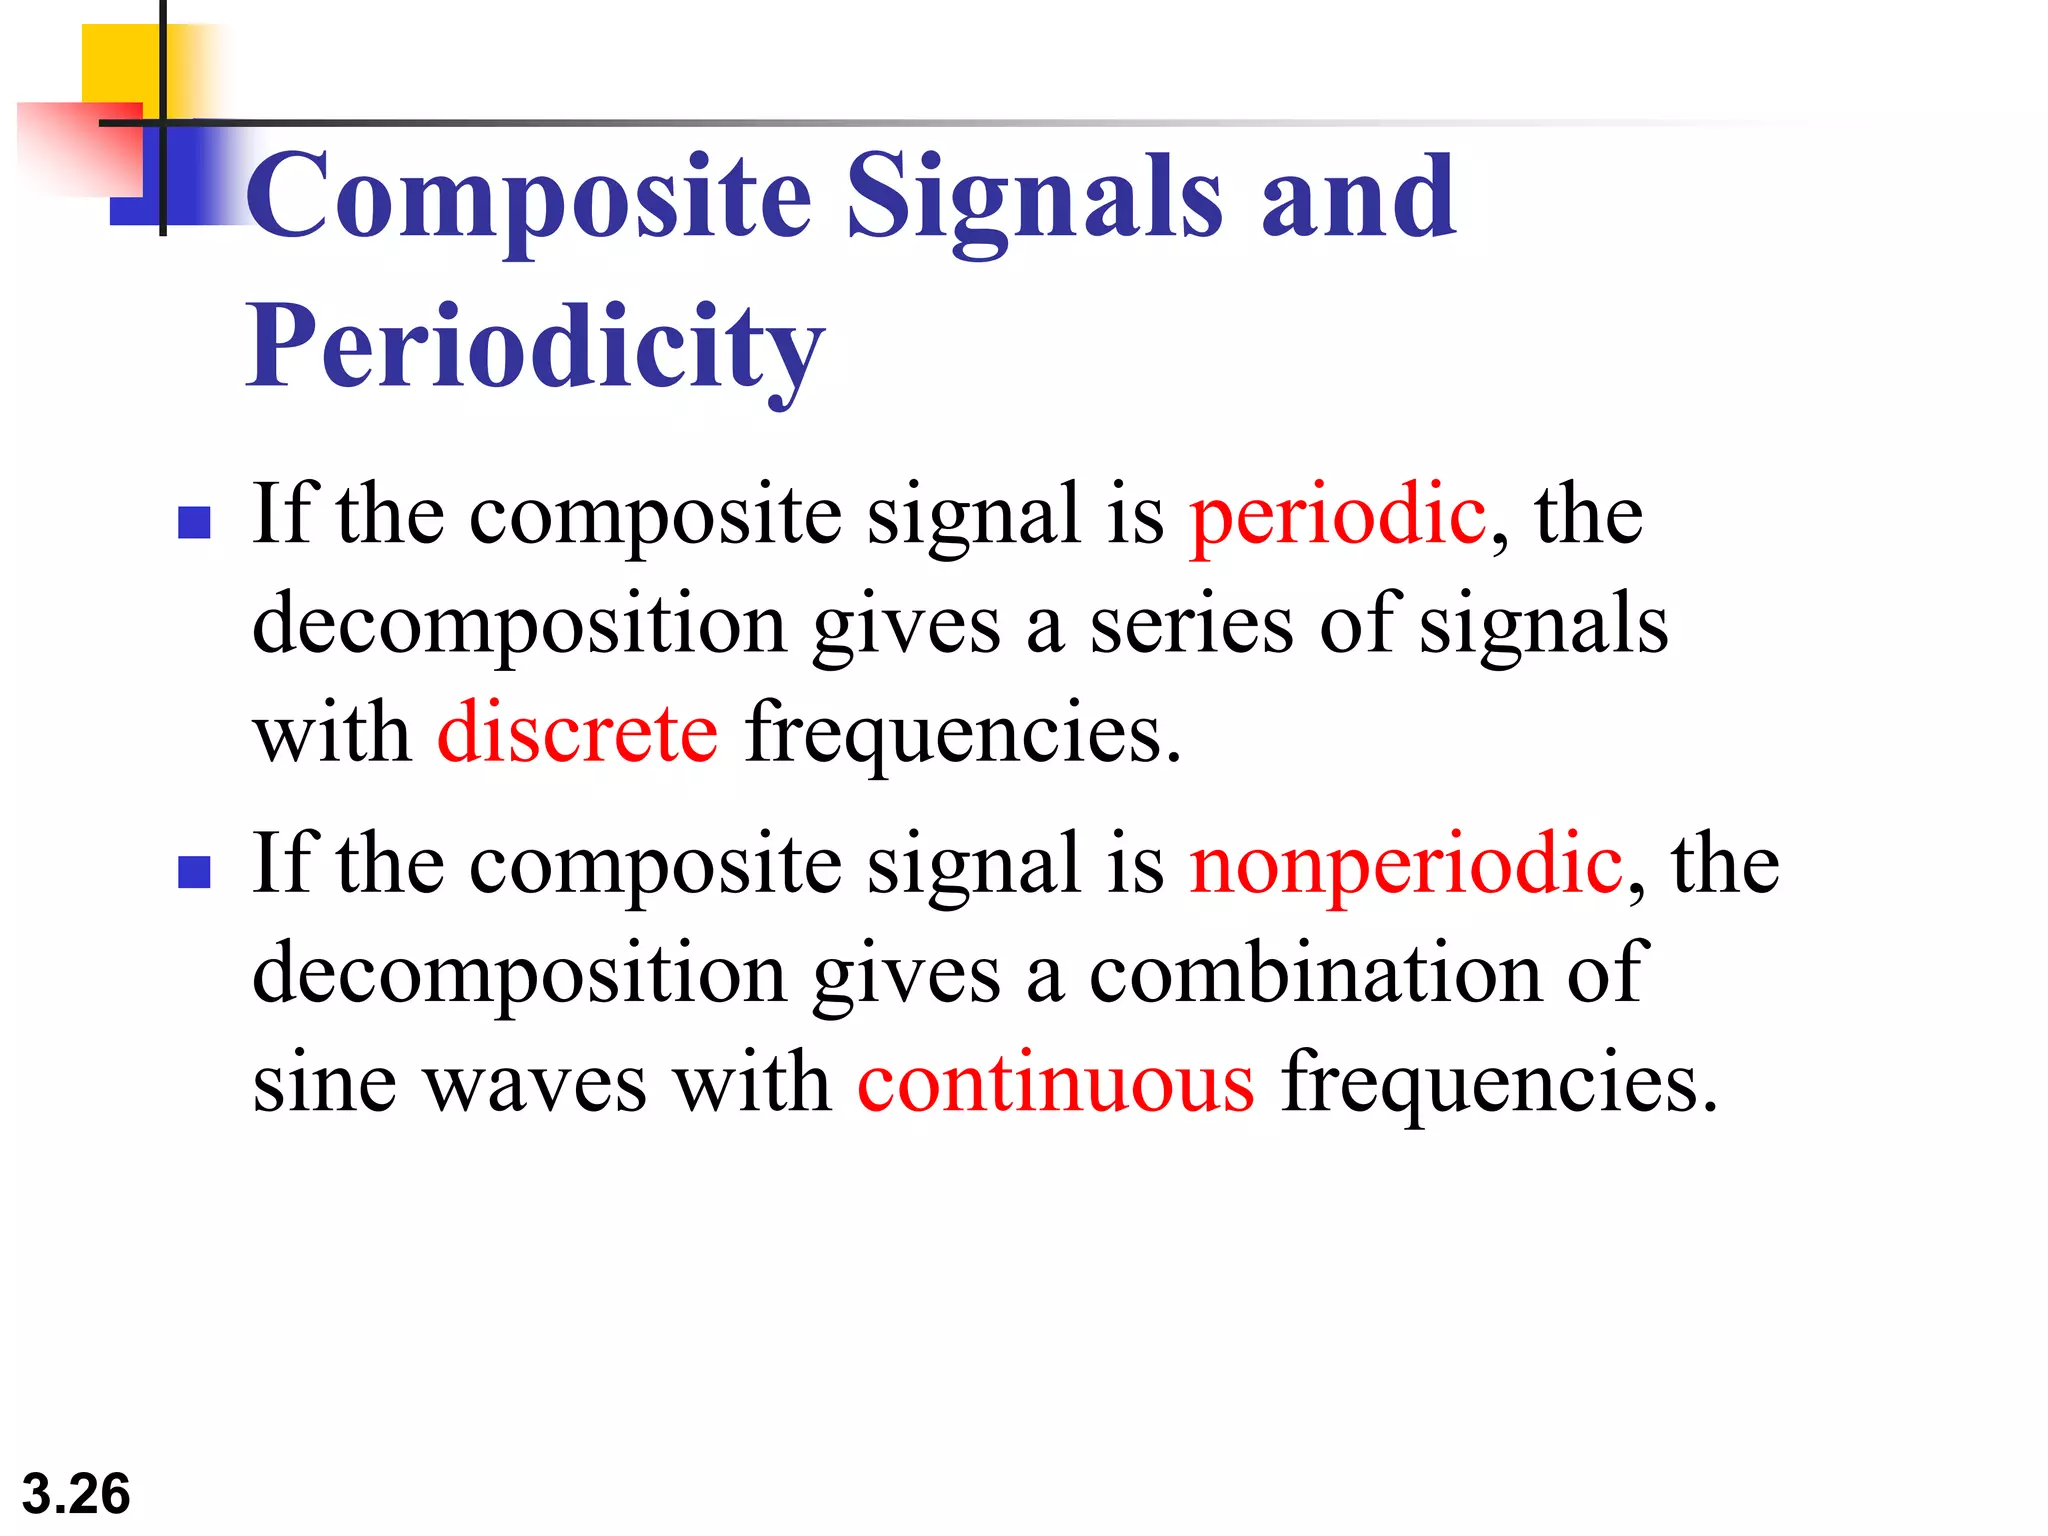
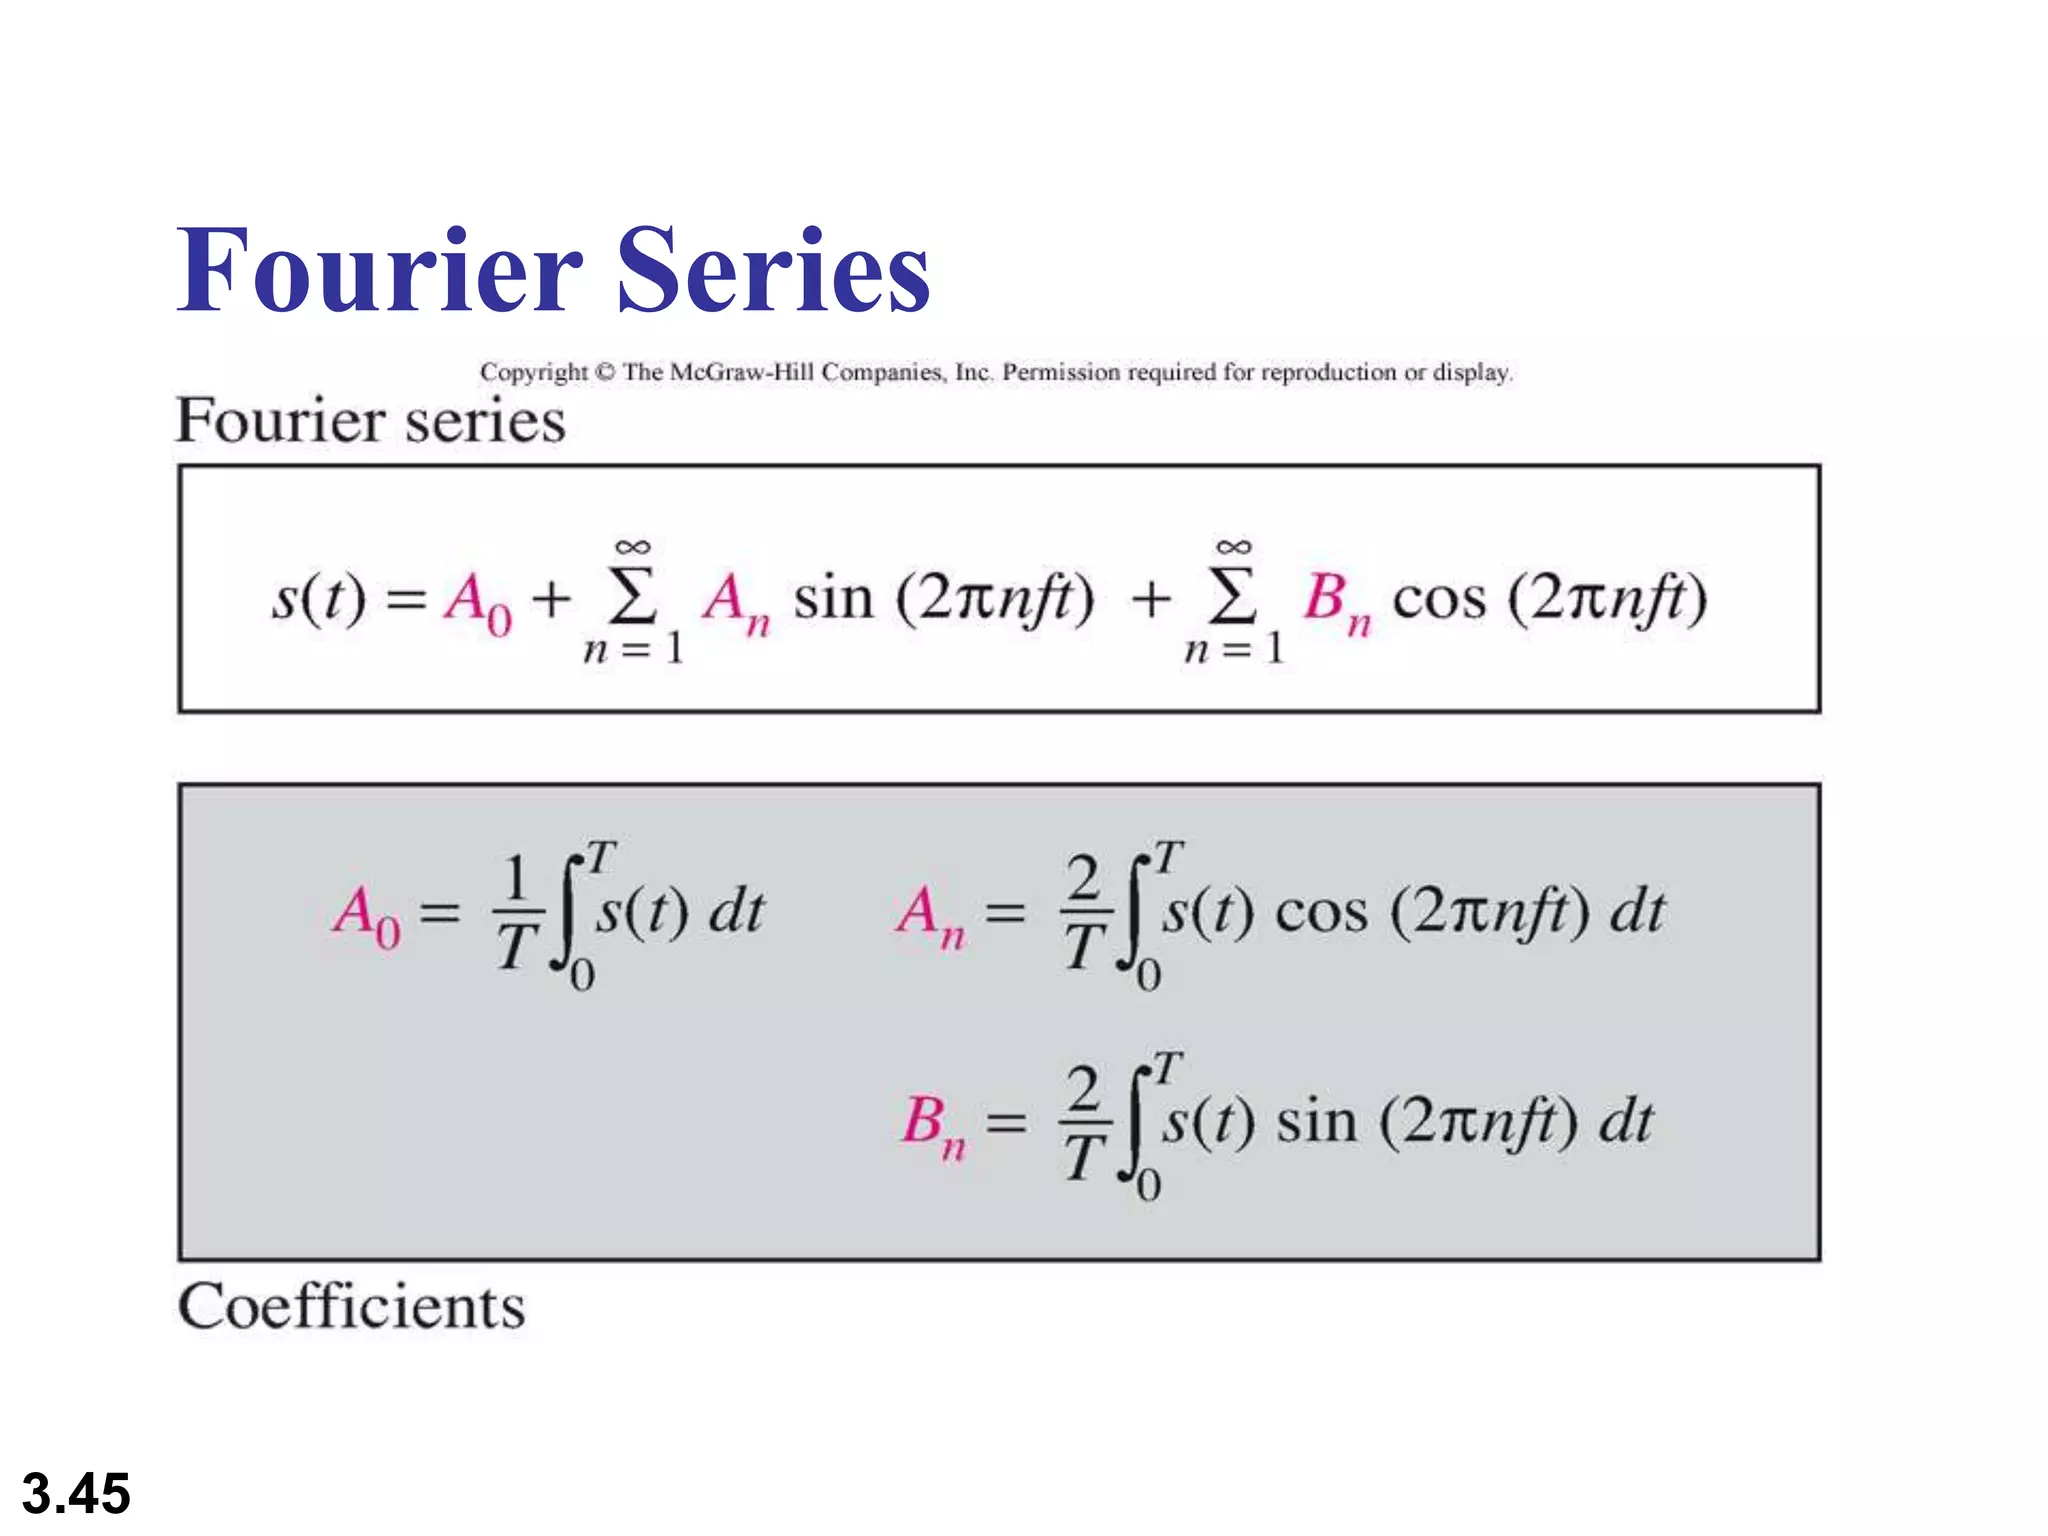
2) Periodic analog signals include sine waves and composite signals made of multiple sine waves. A sine wave's frequency and period are inversely related.
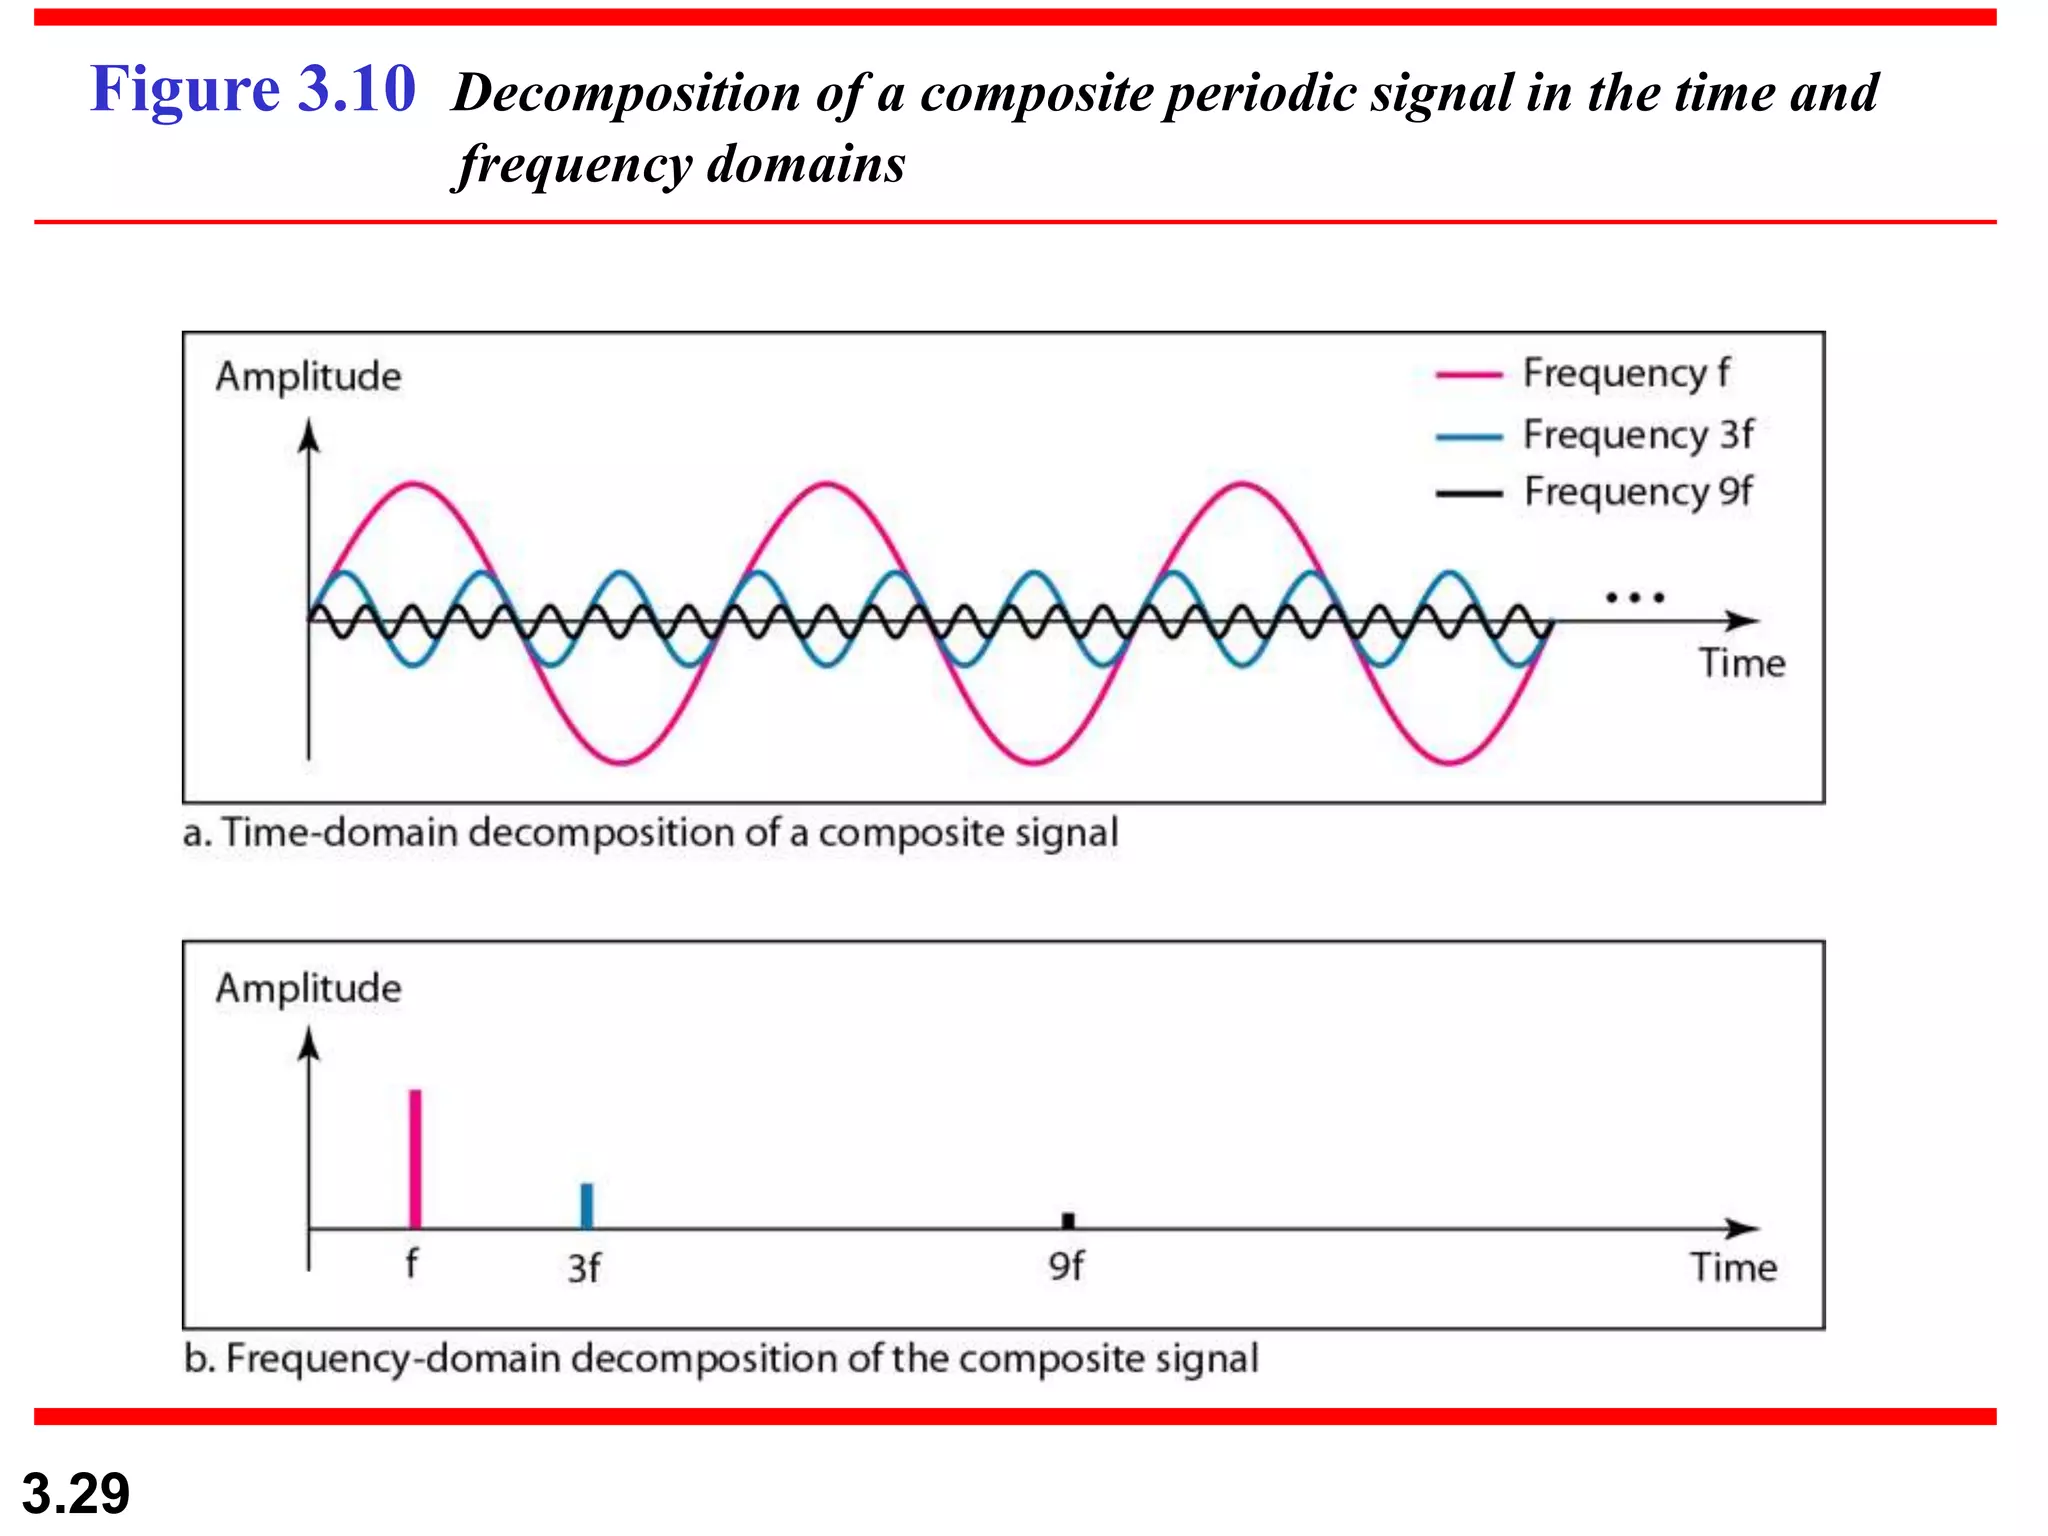
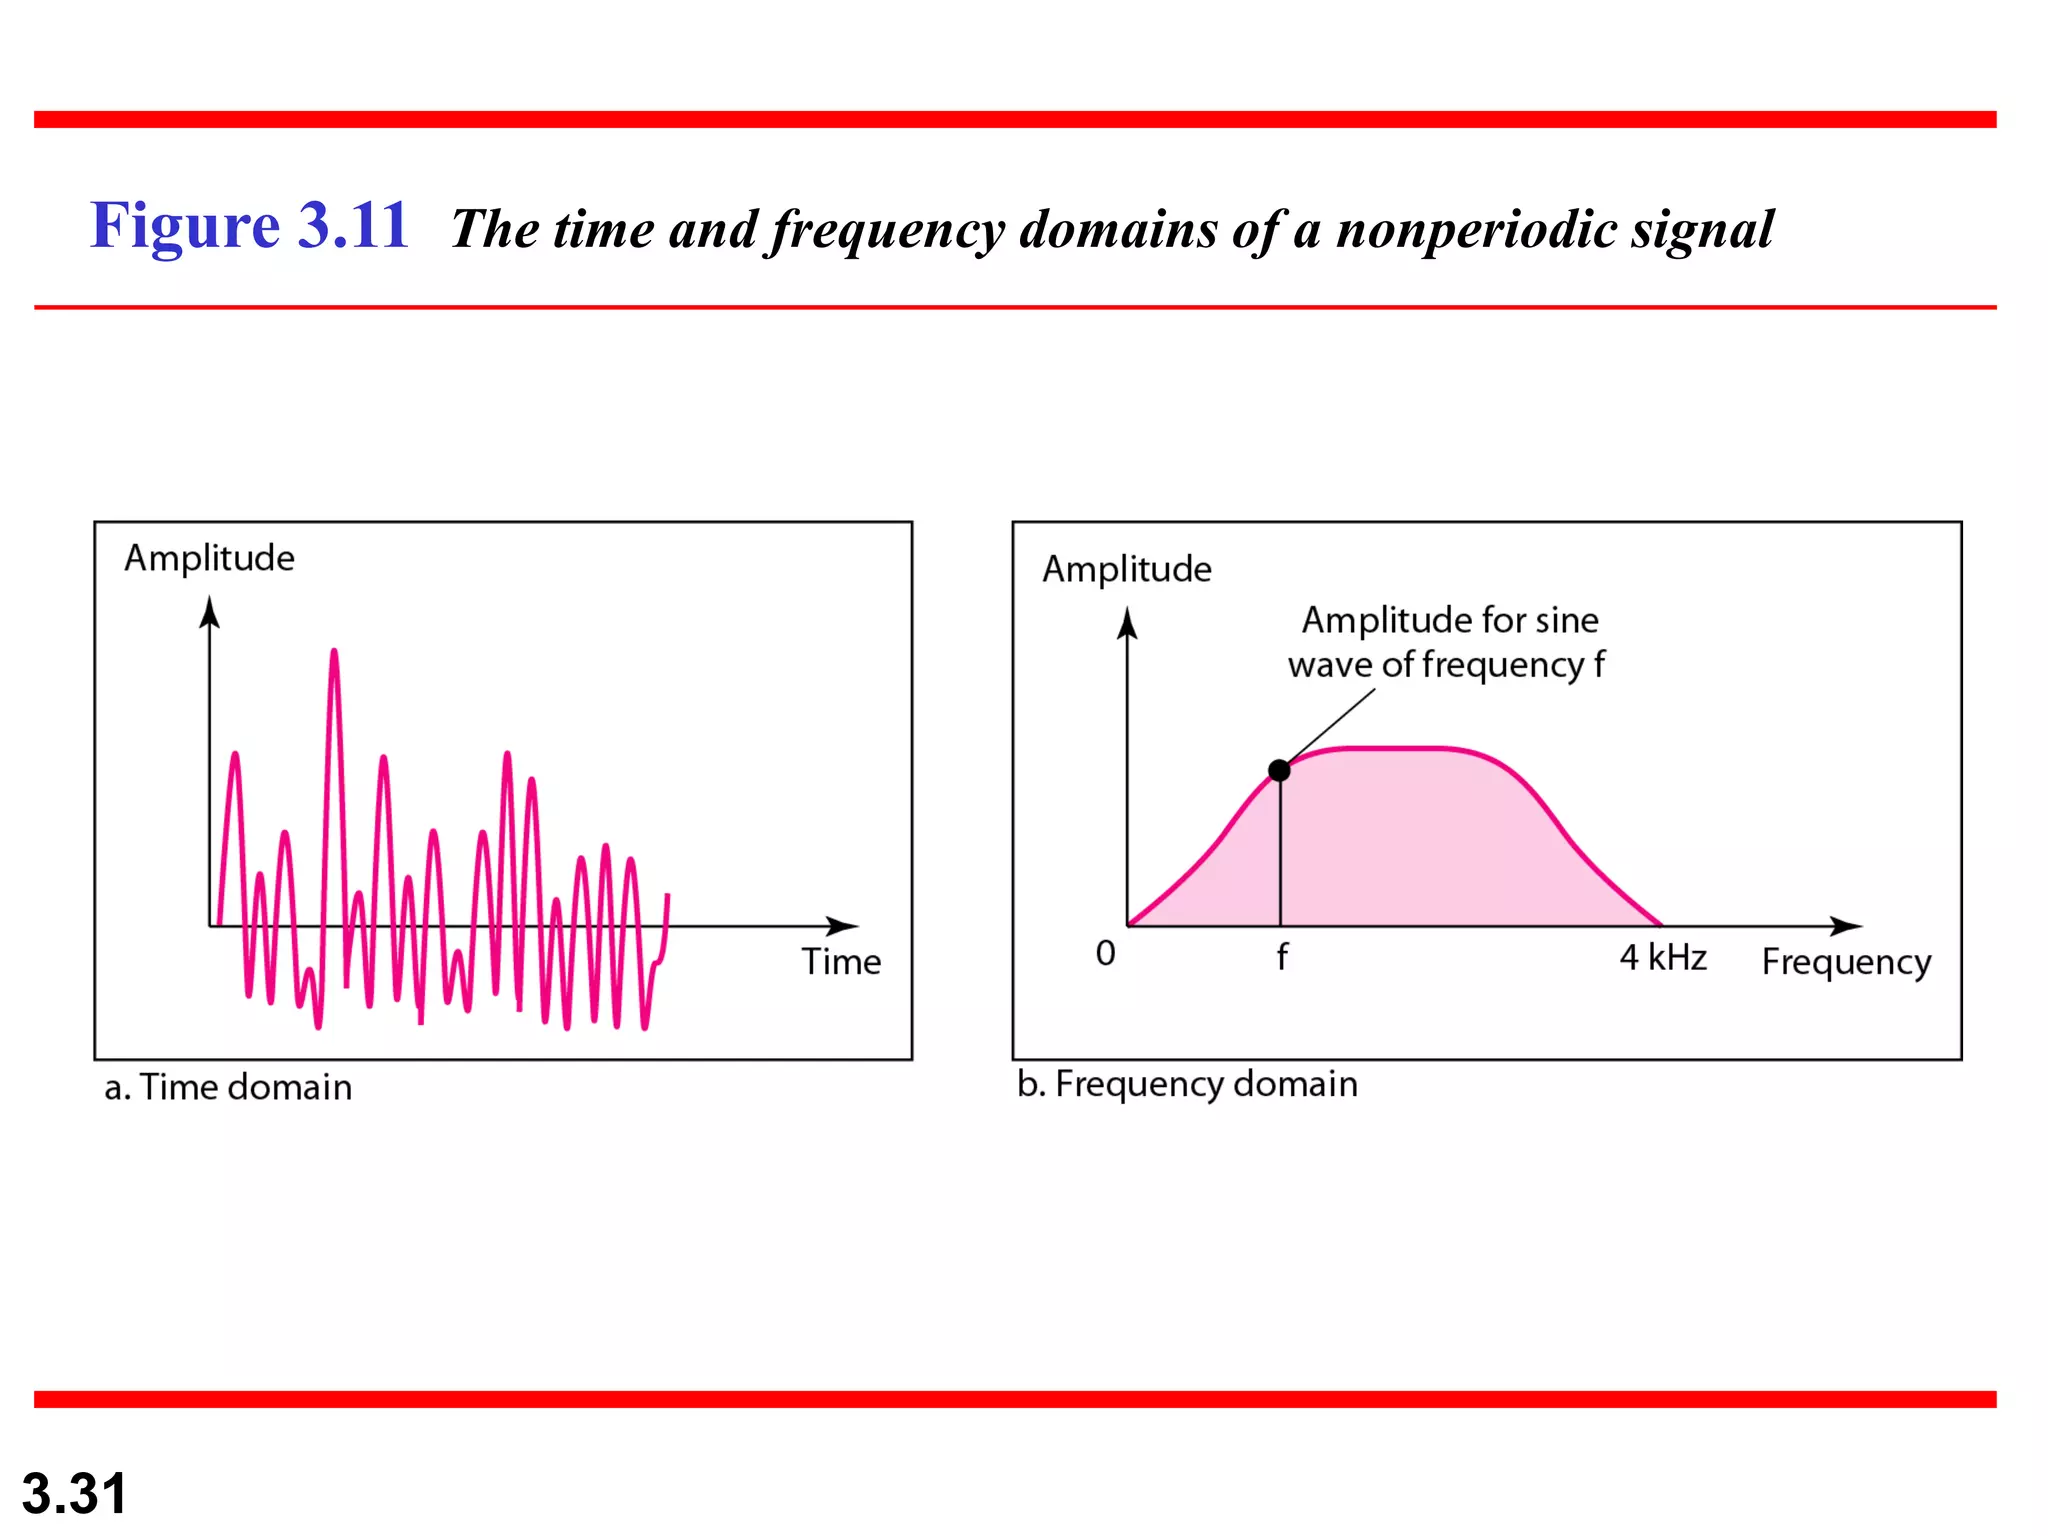
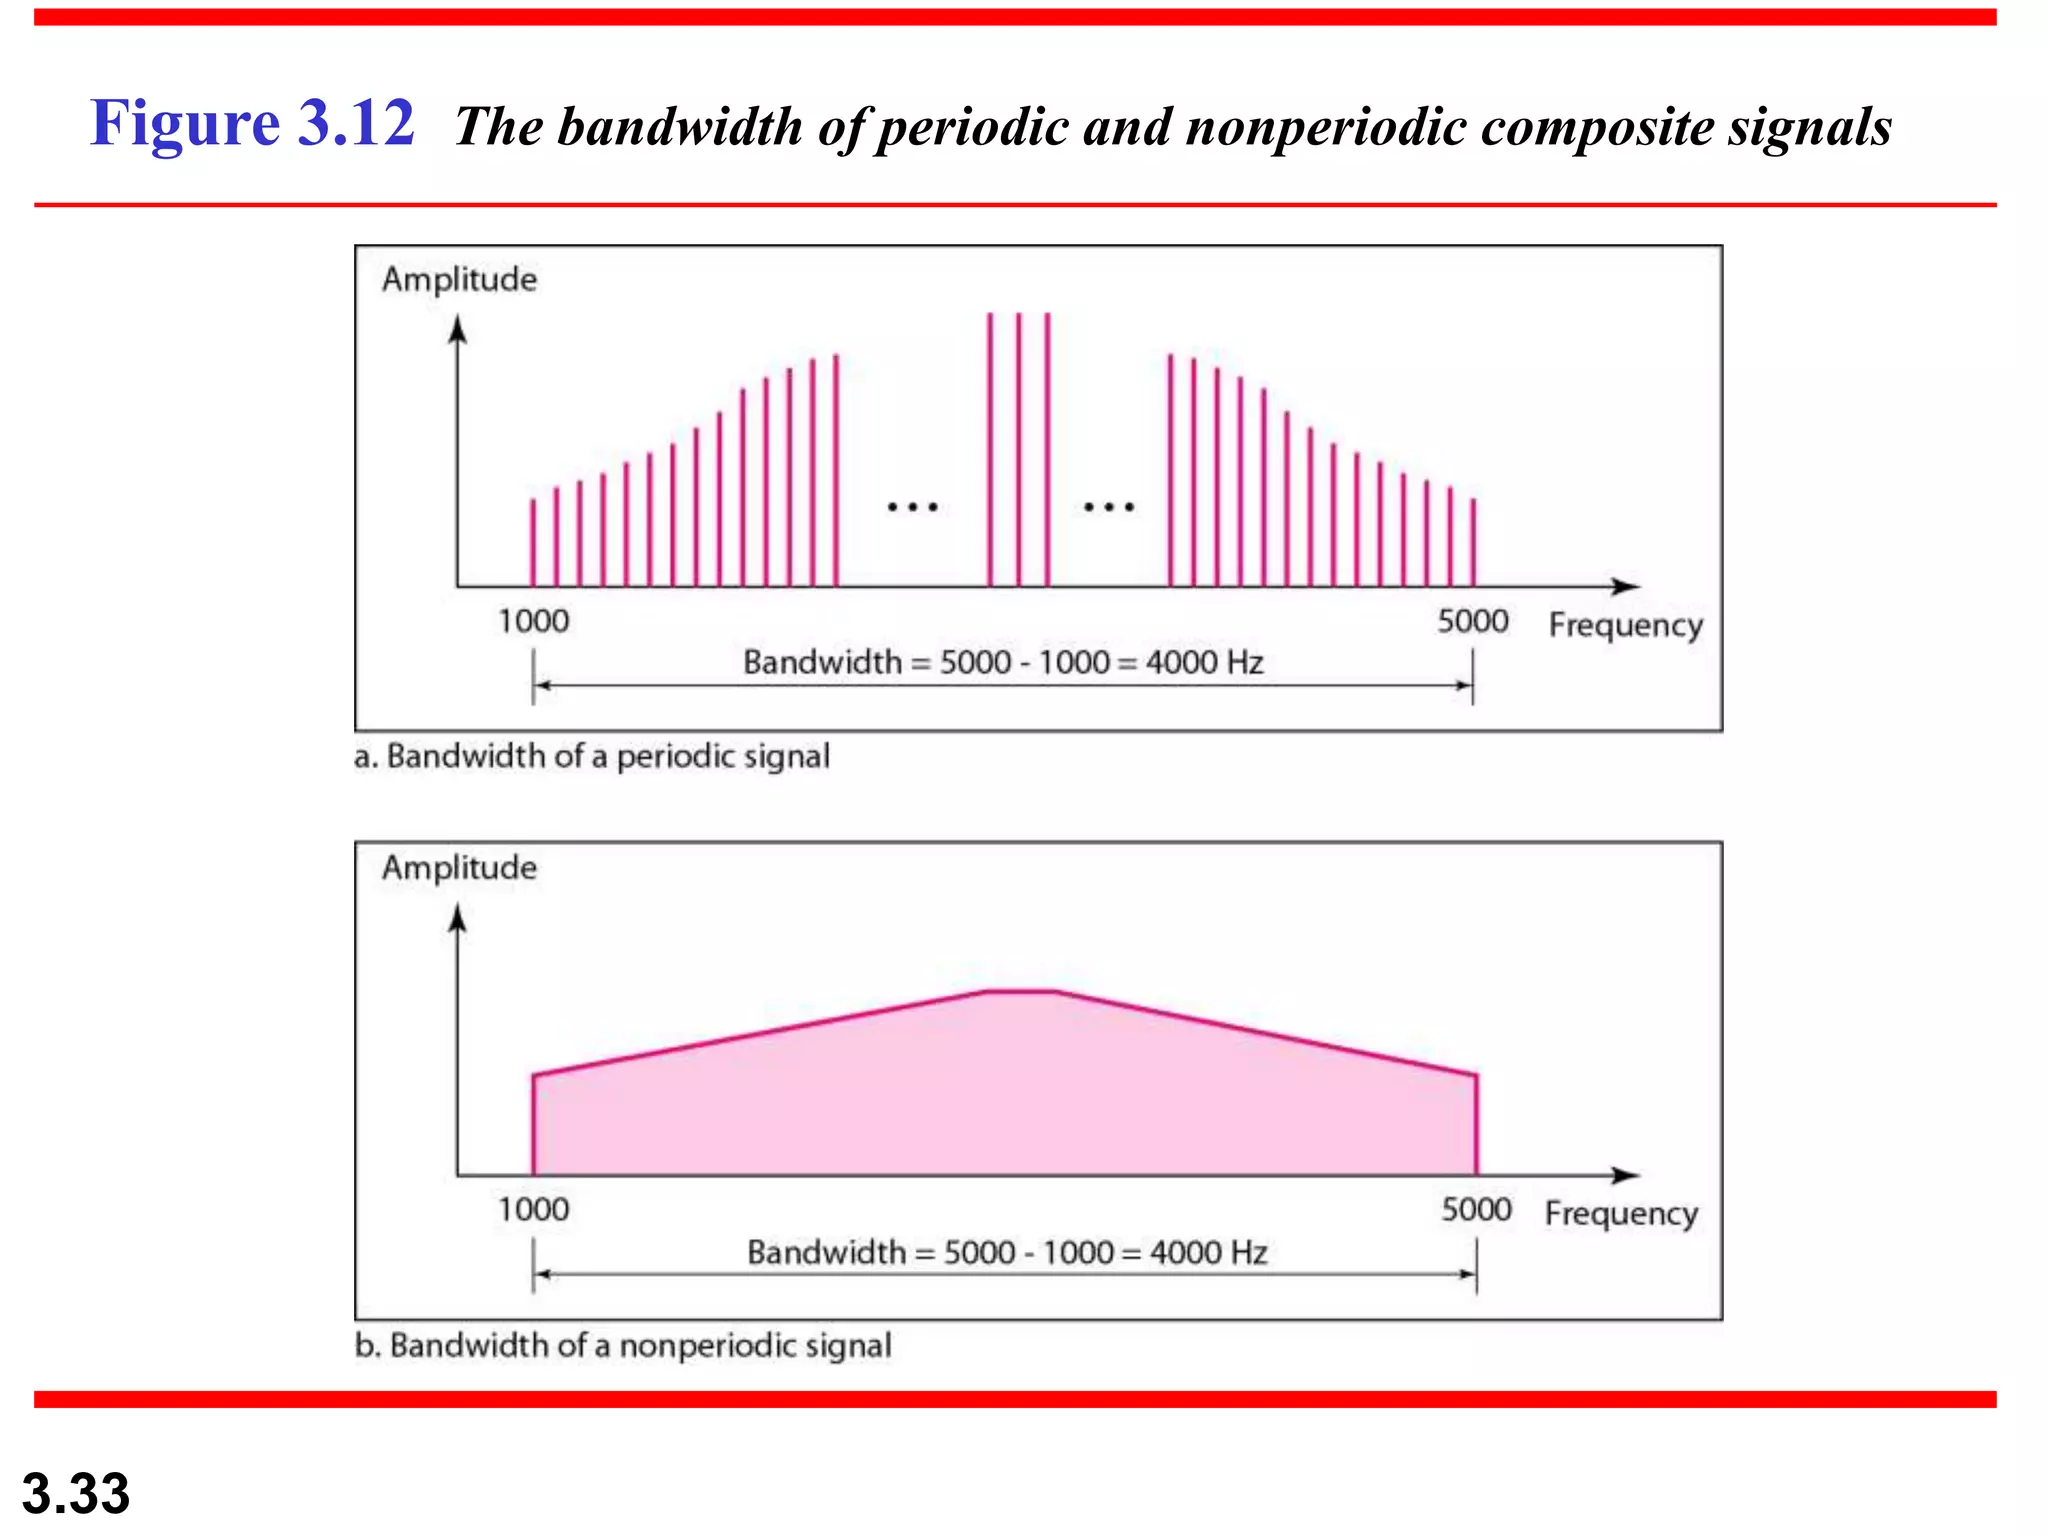
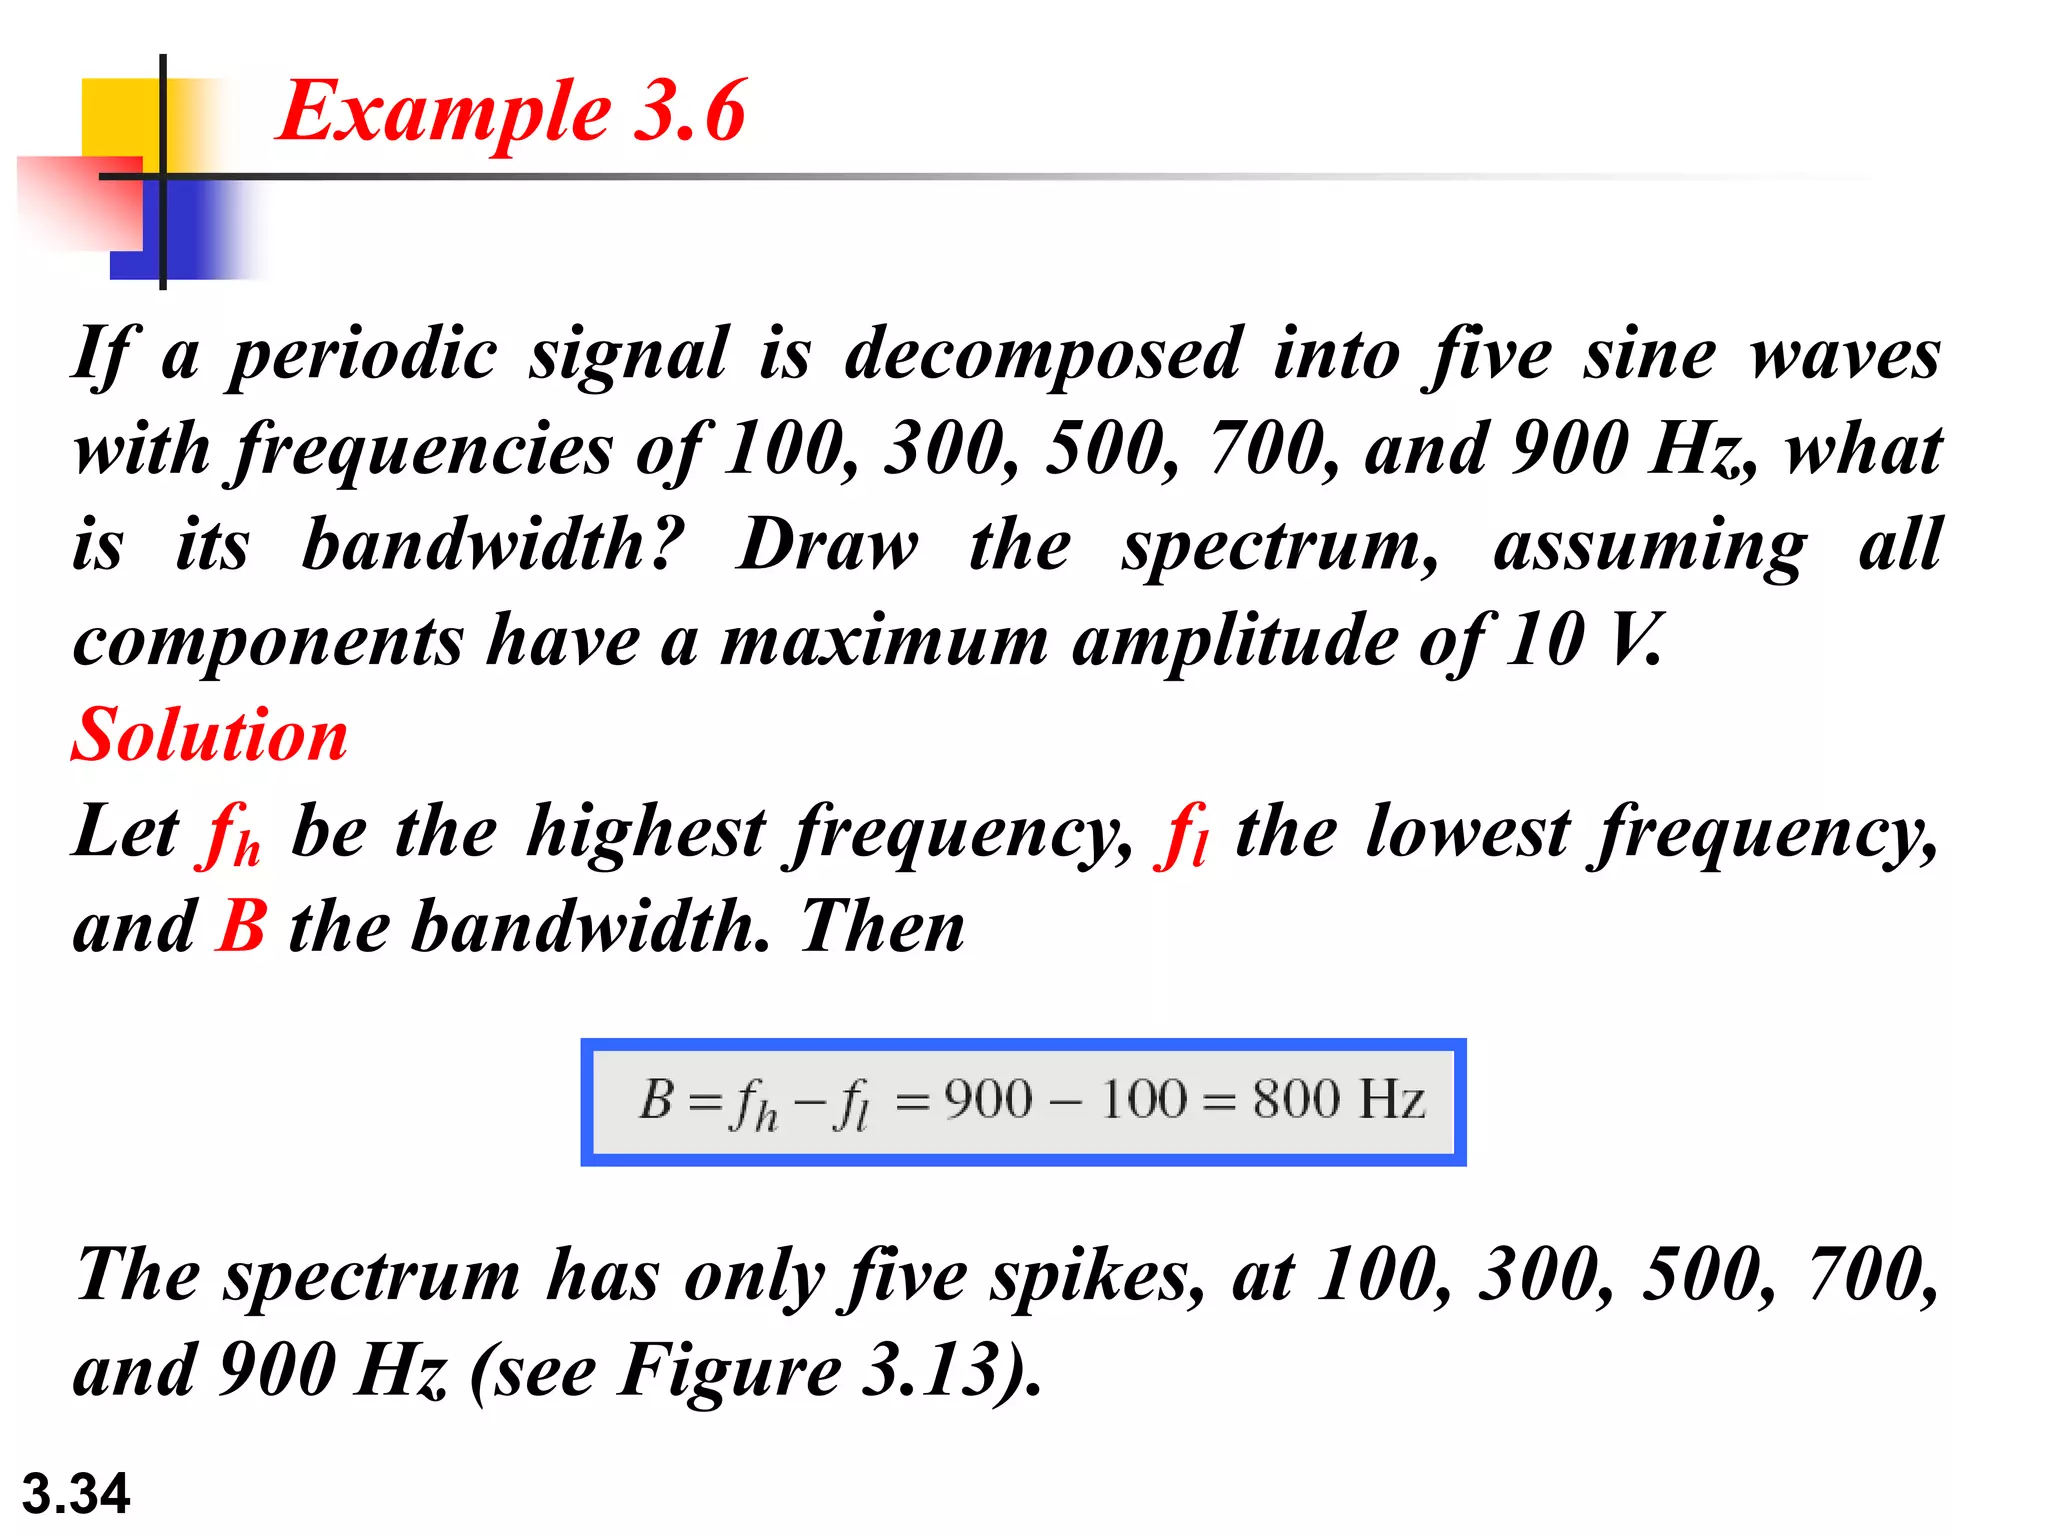
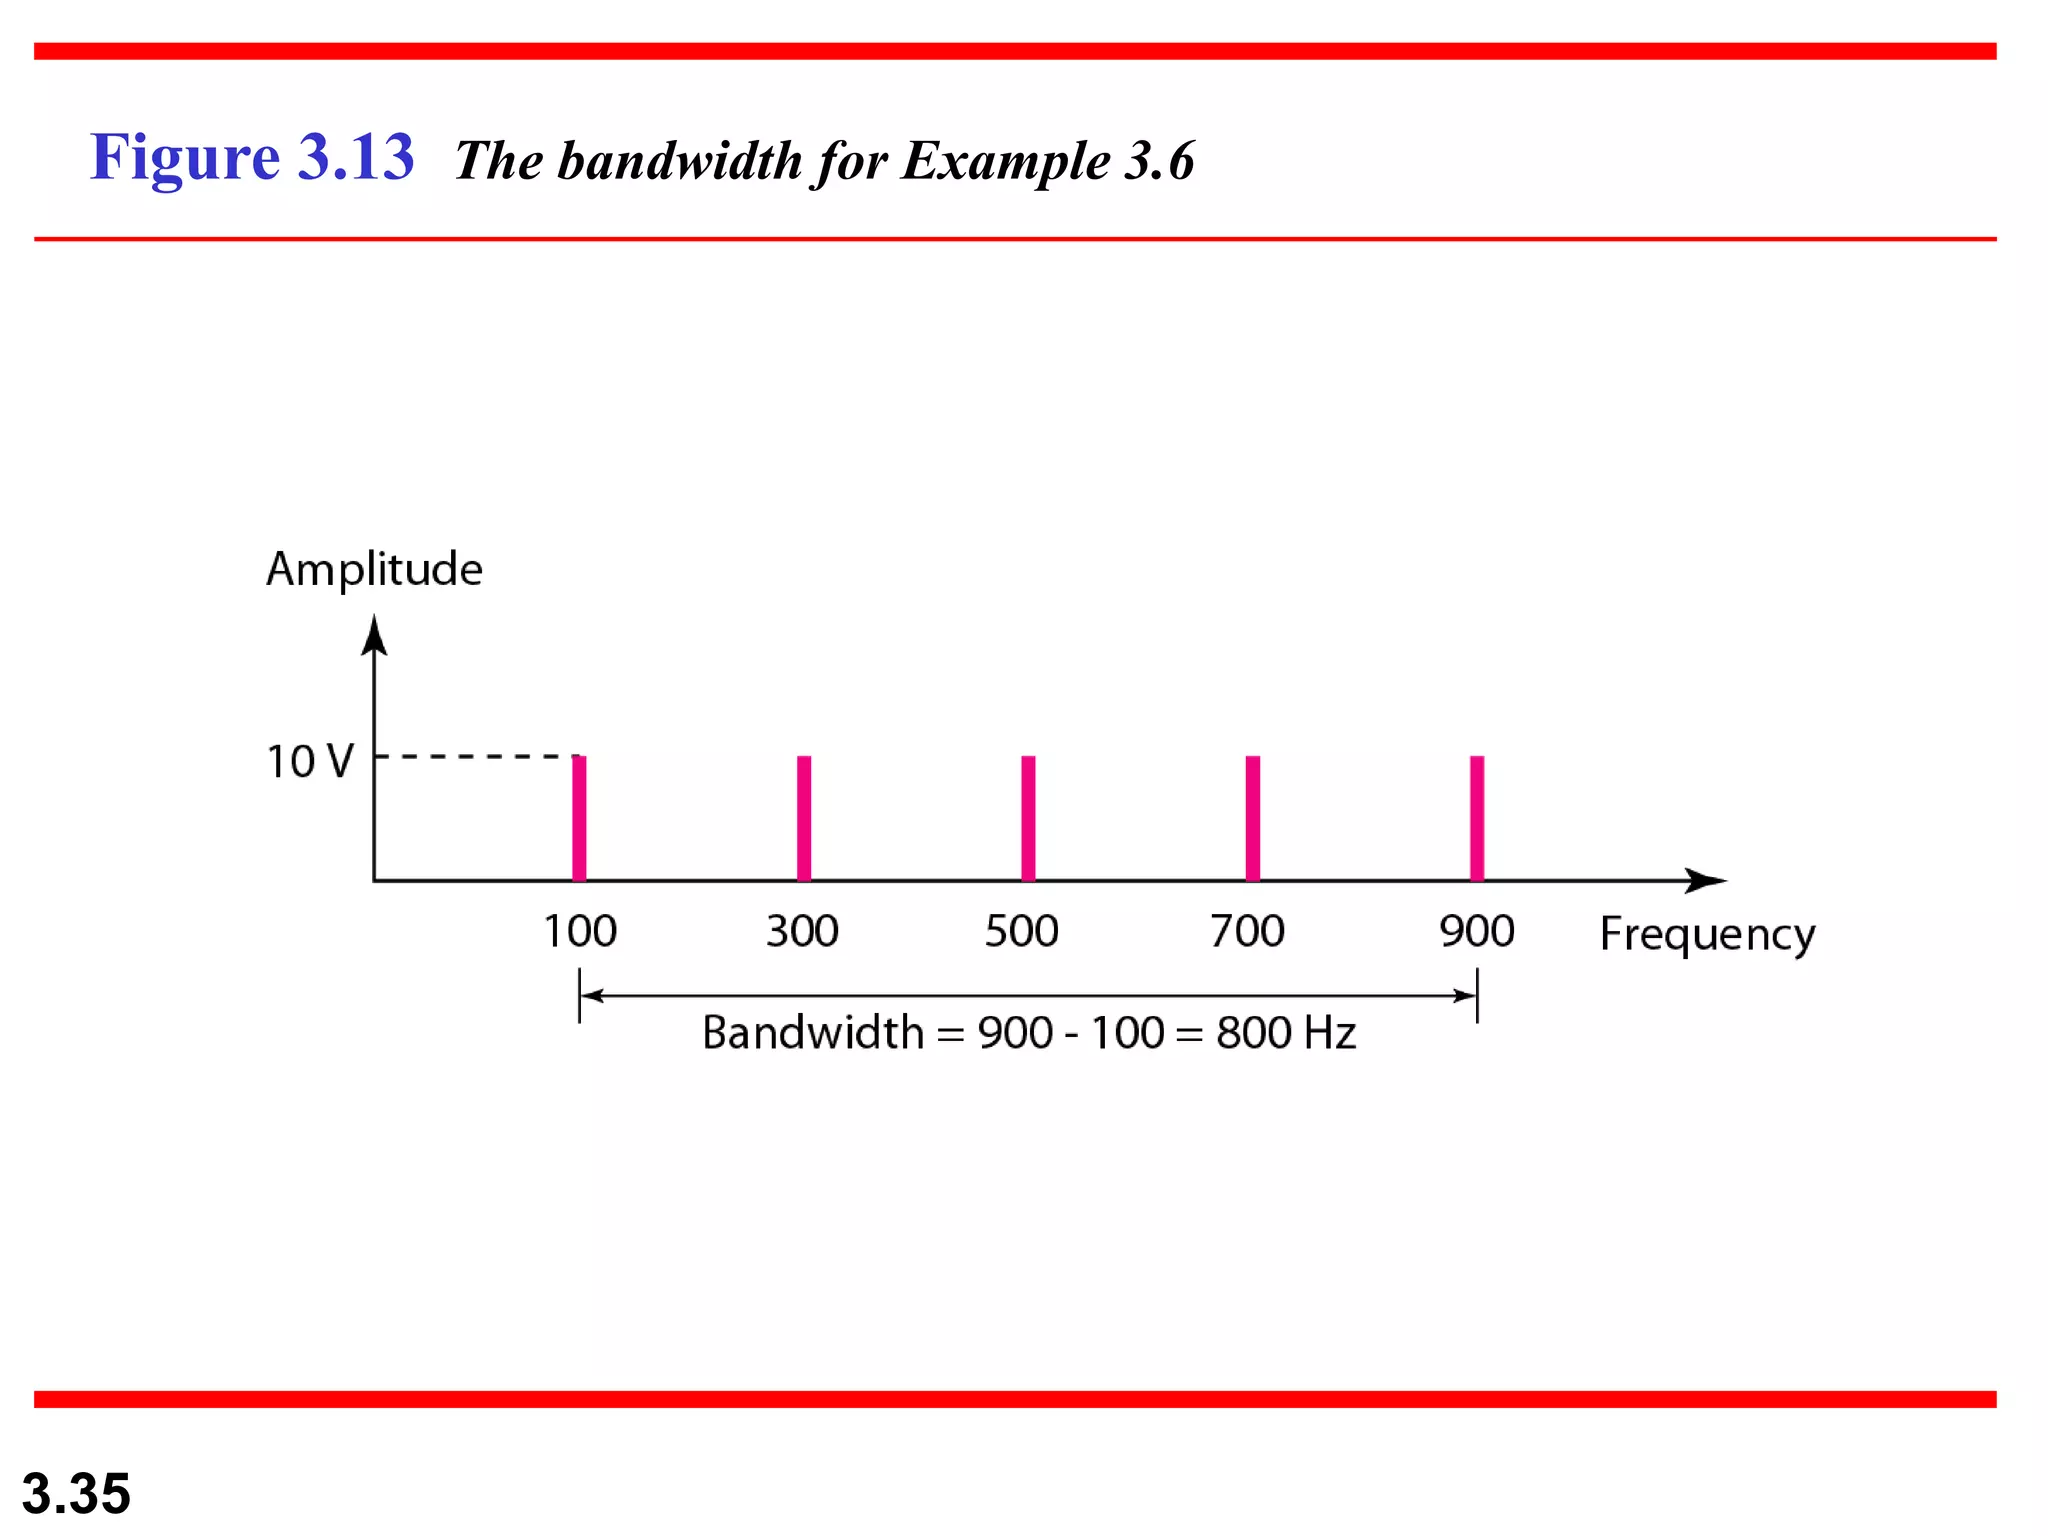
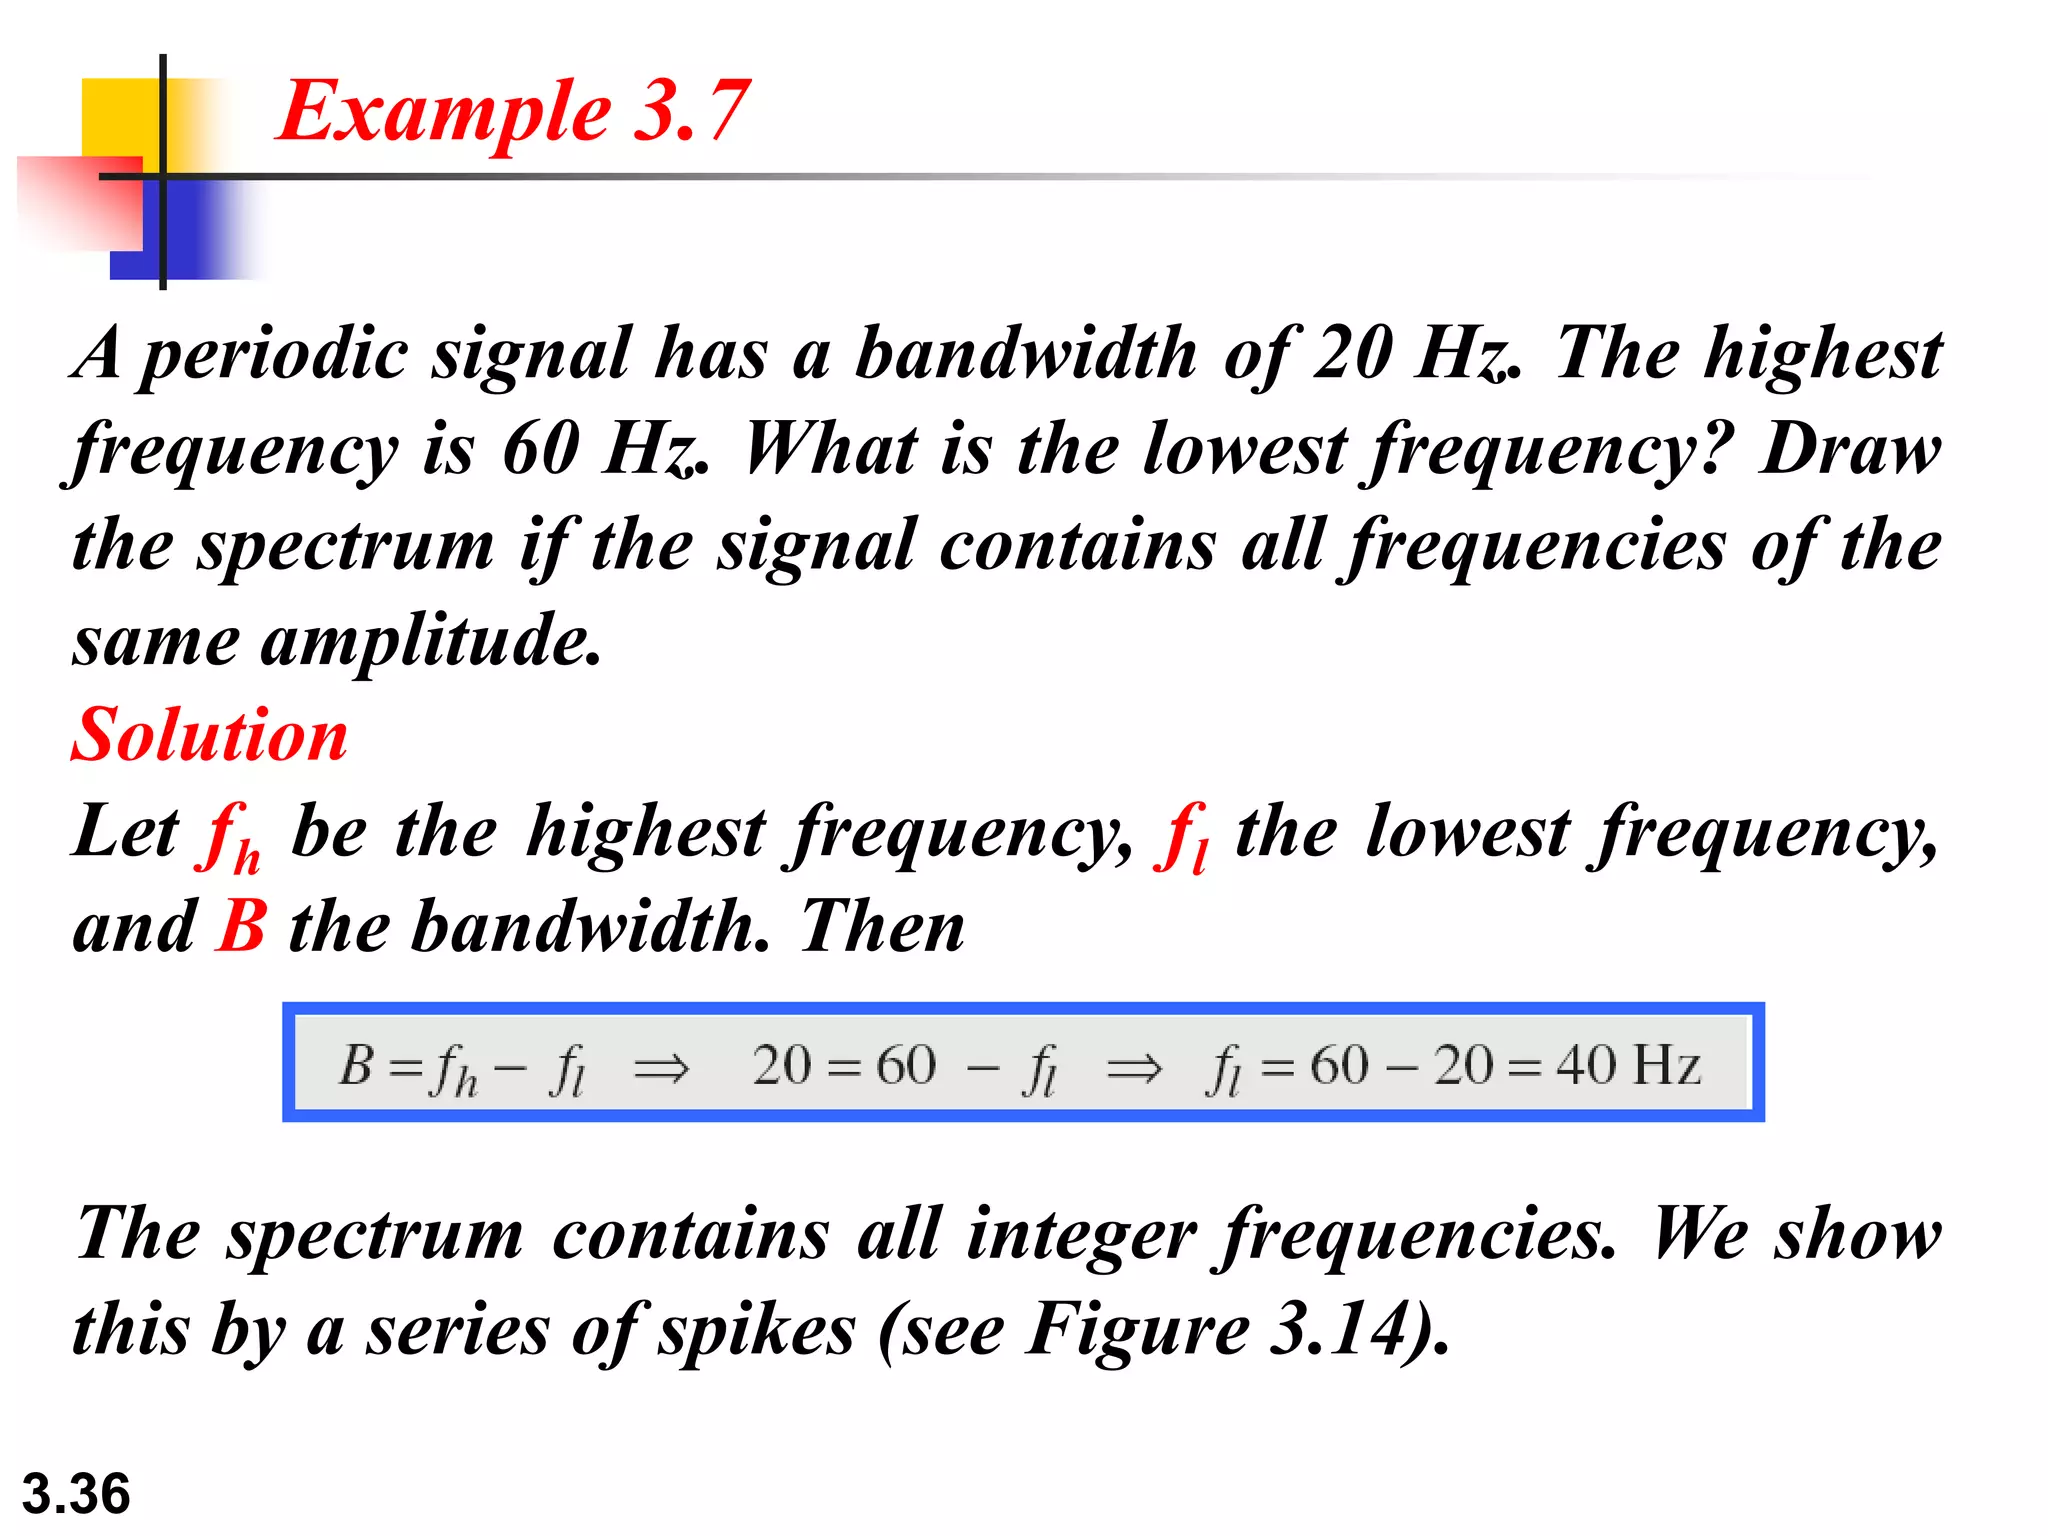
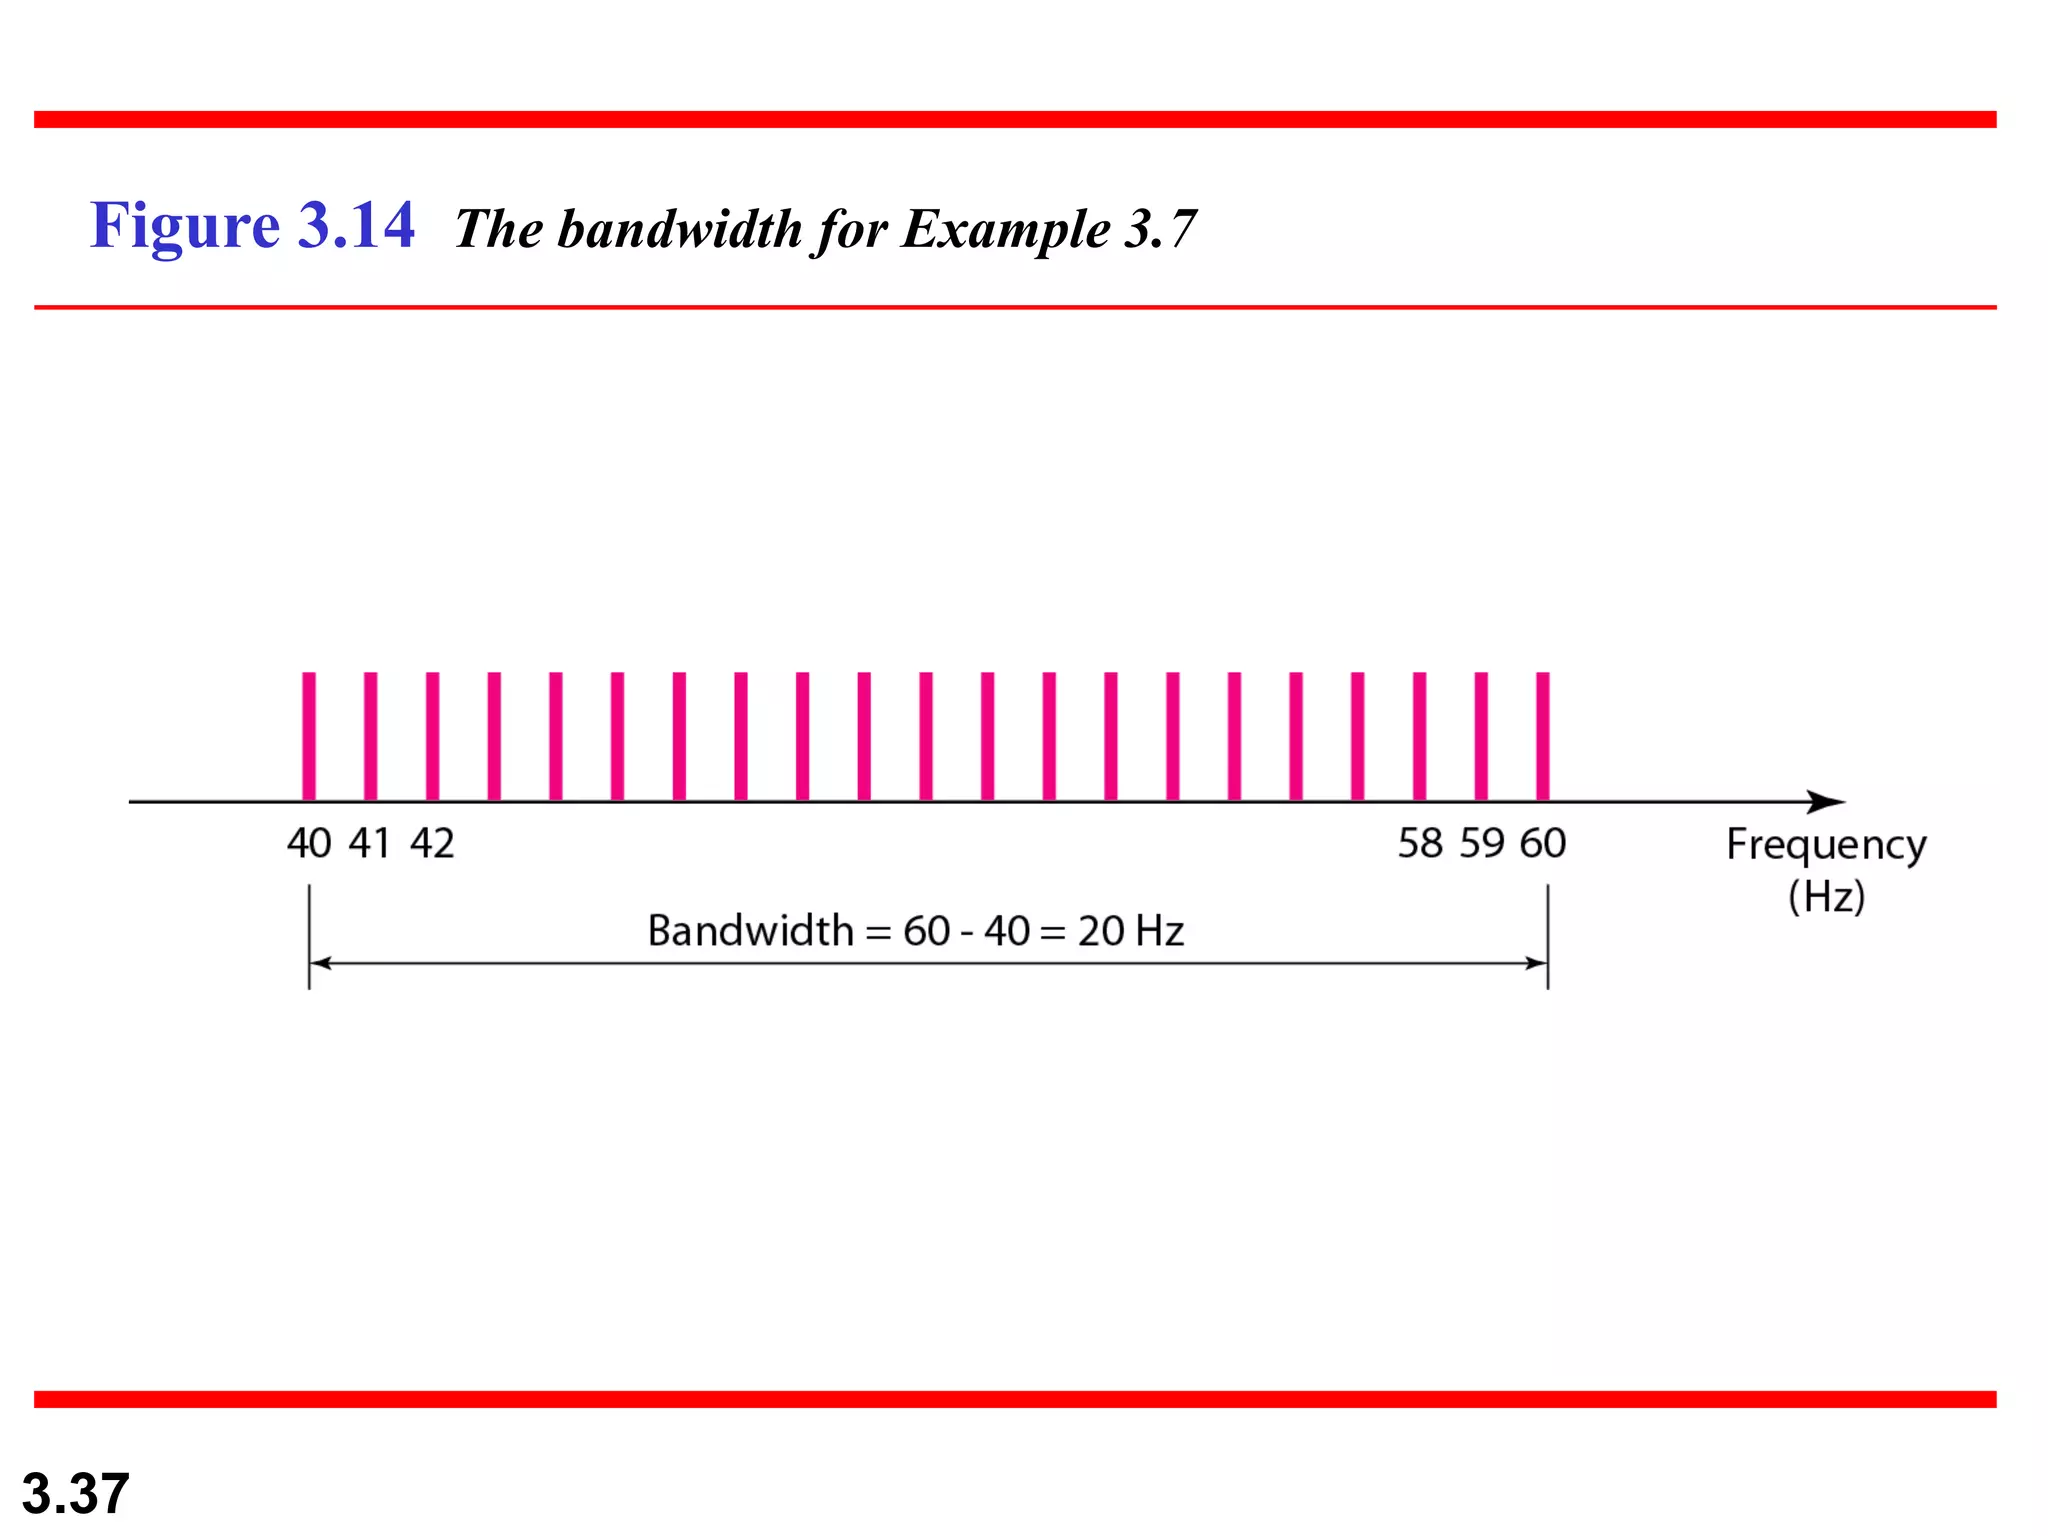
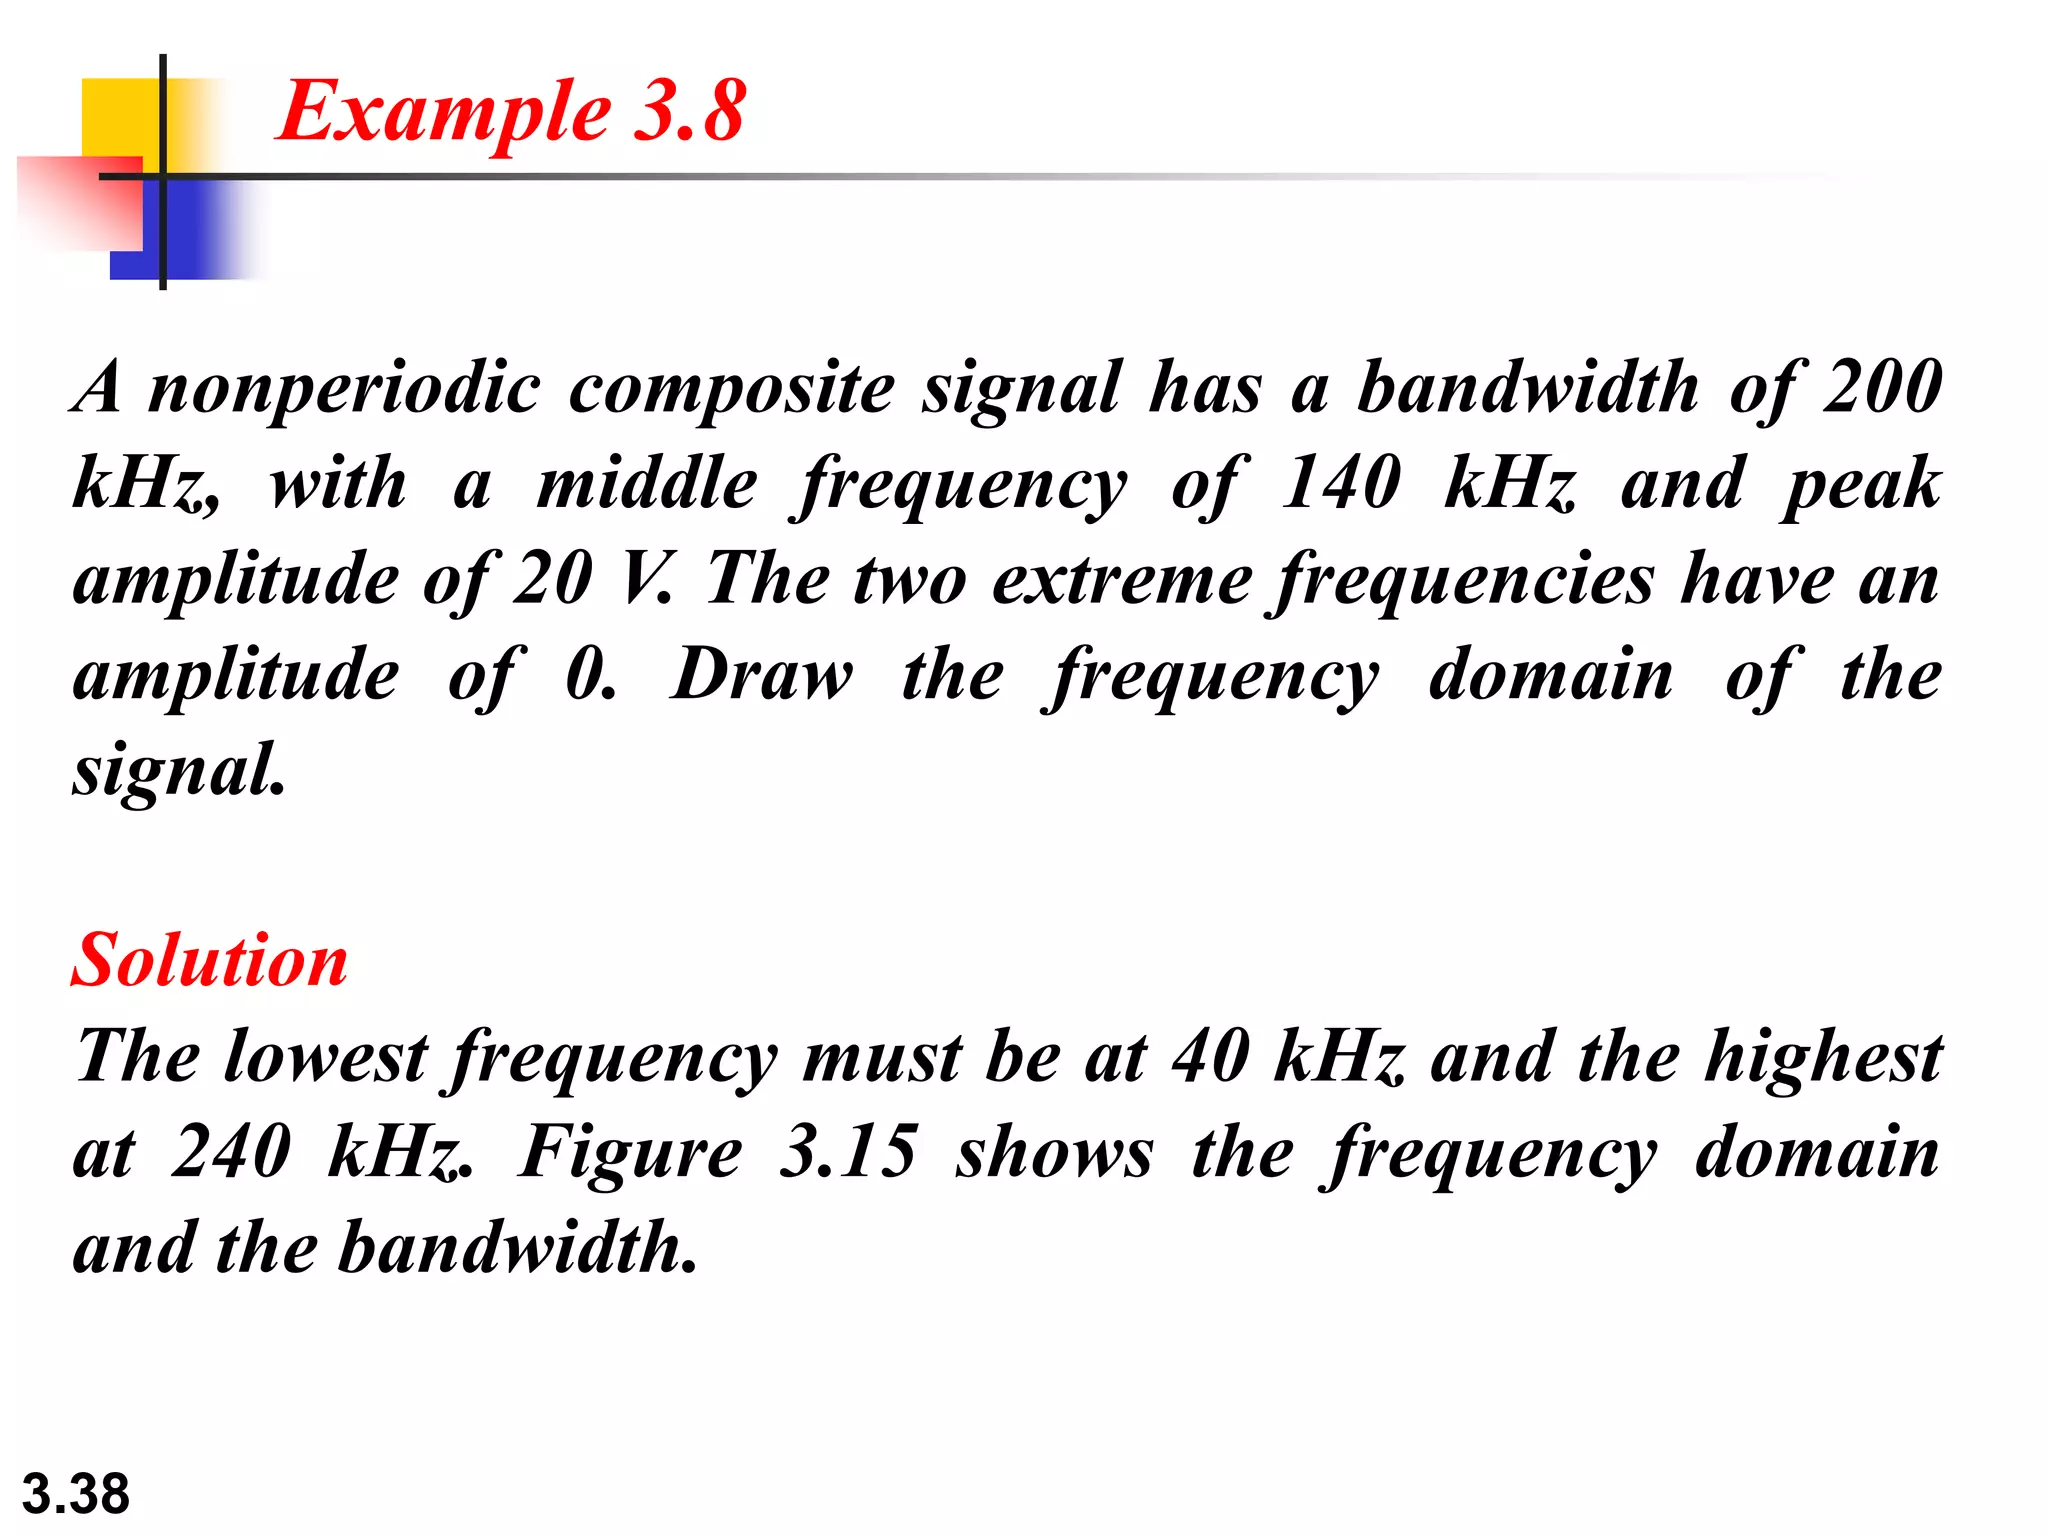
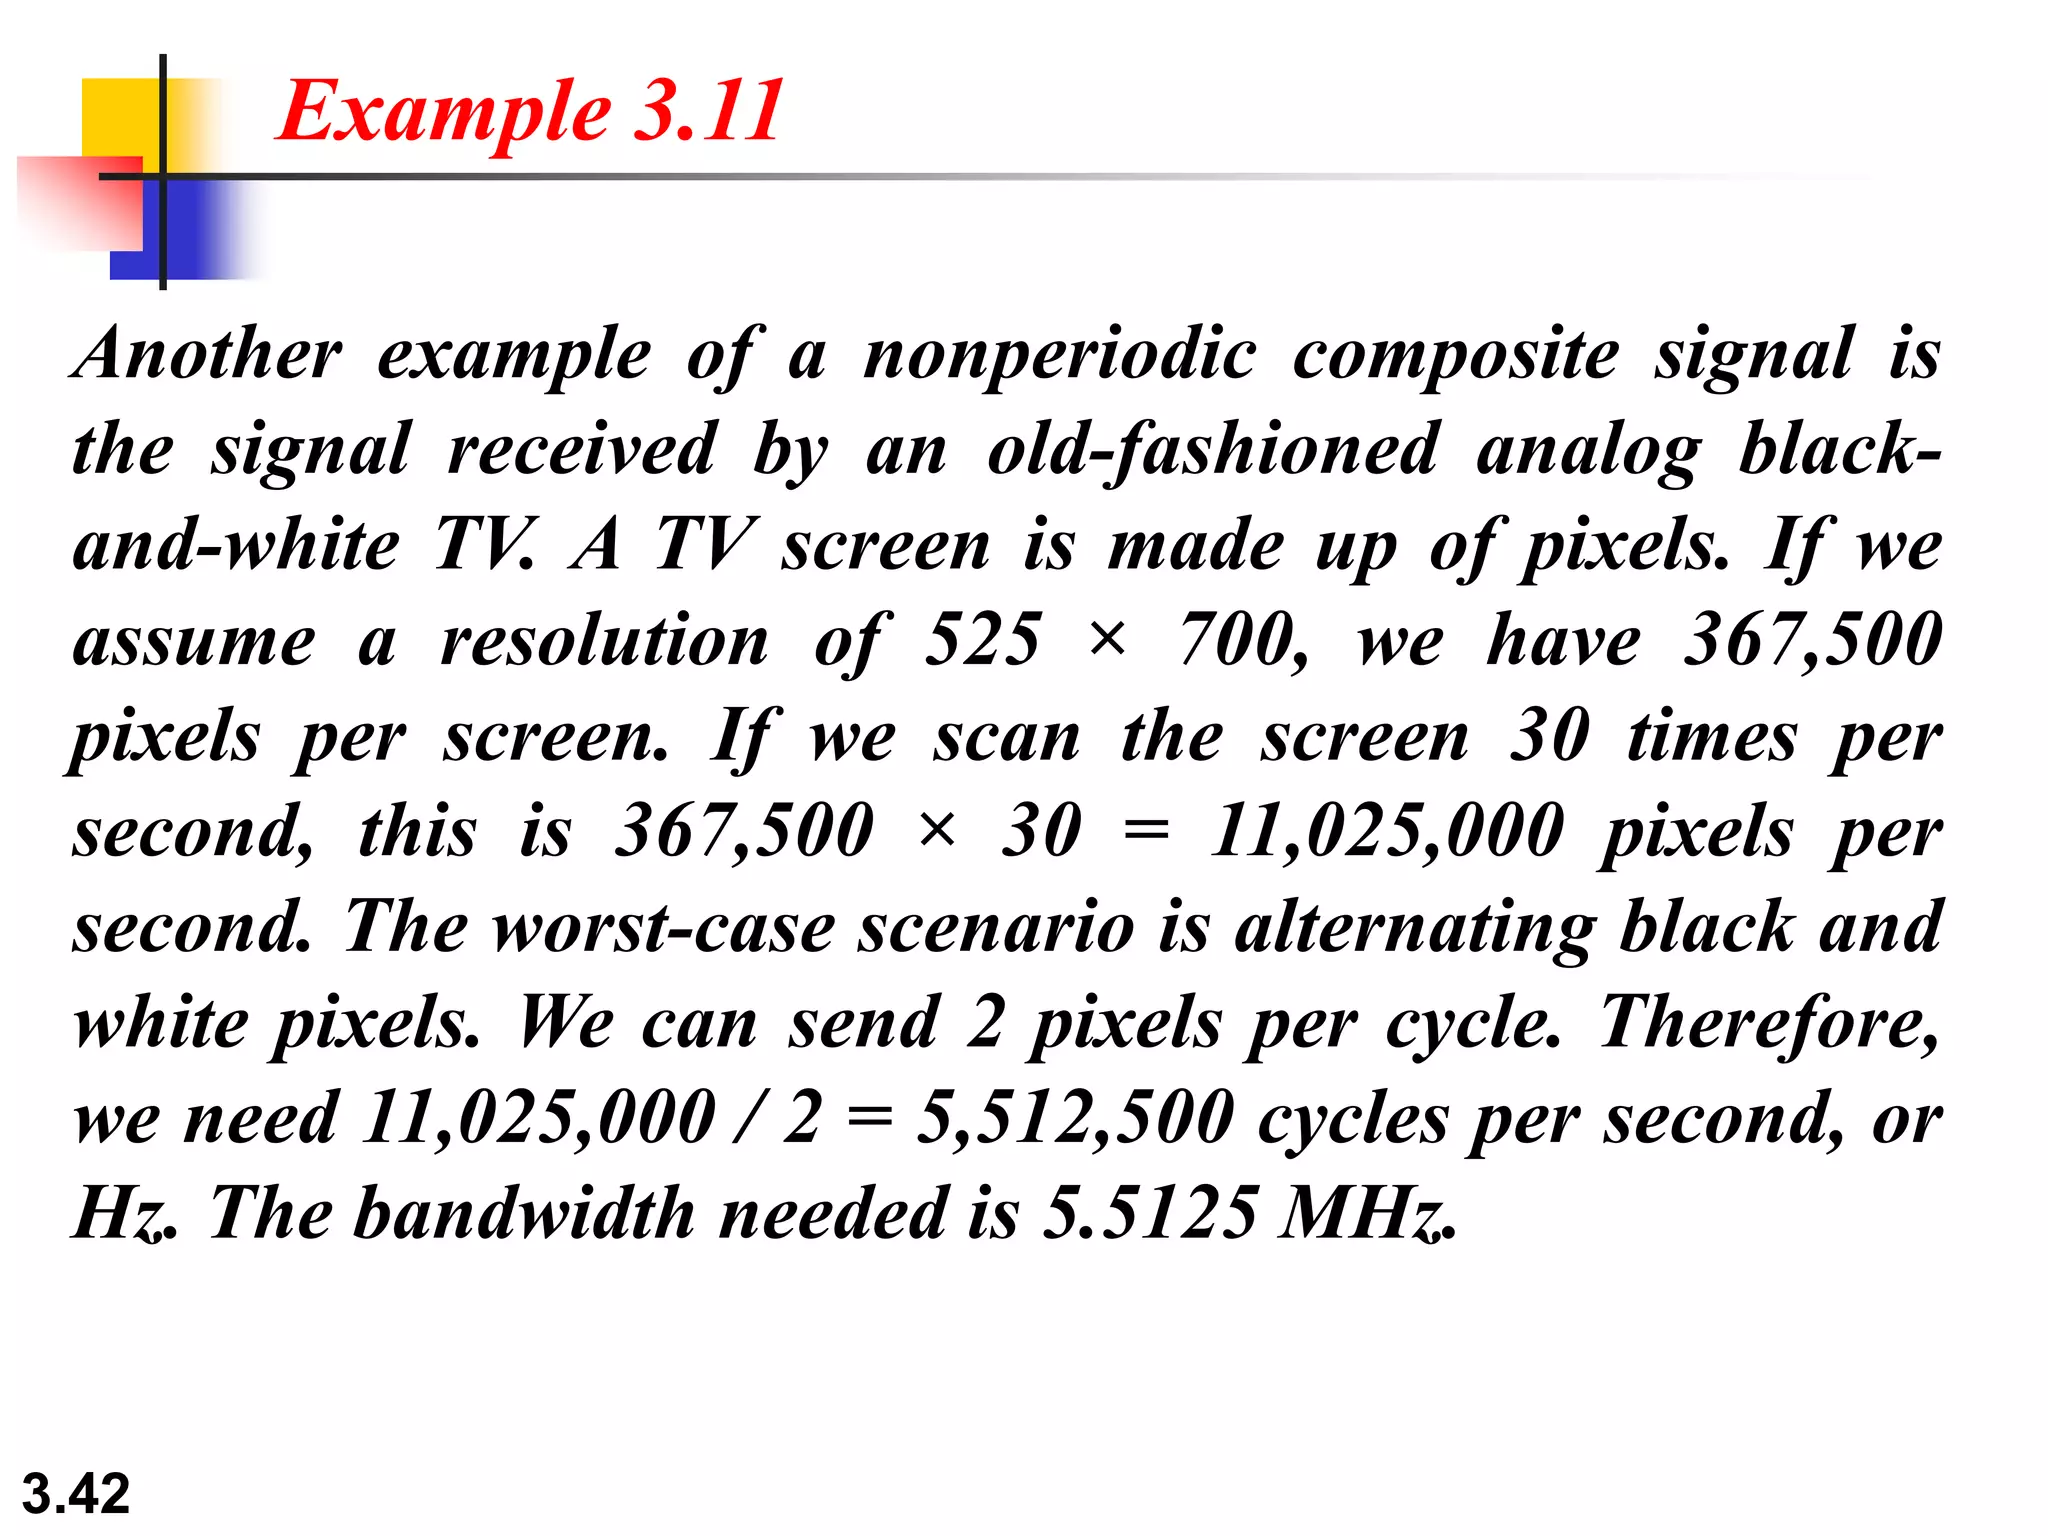
3) The bandwidth of a composite signal is the difference between its highest and lowest frequencies. Bandwidth is important for signals like radio and television.