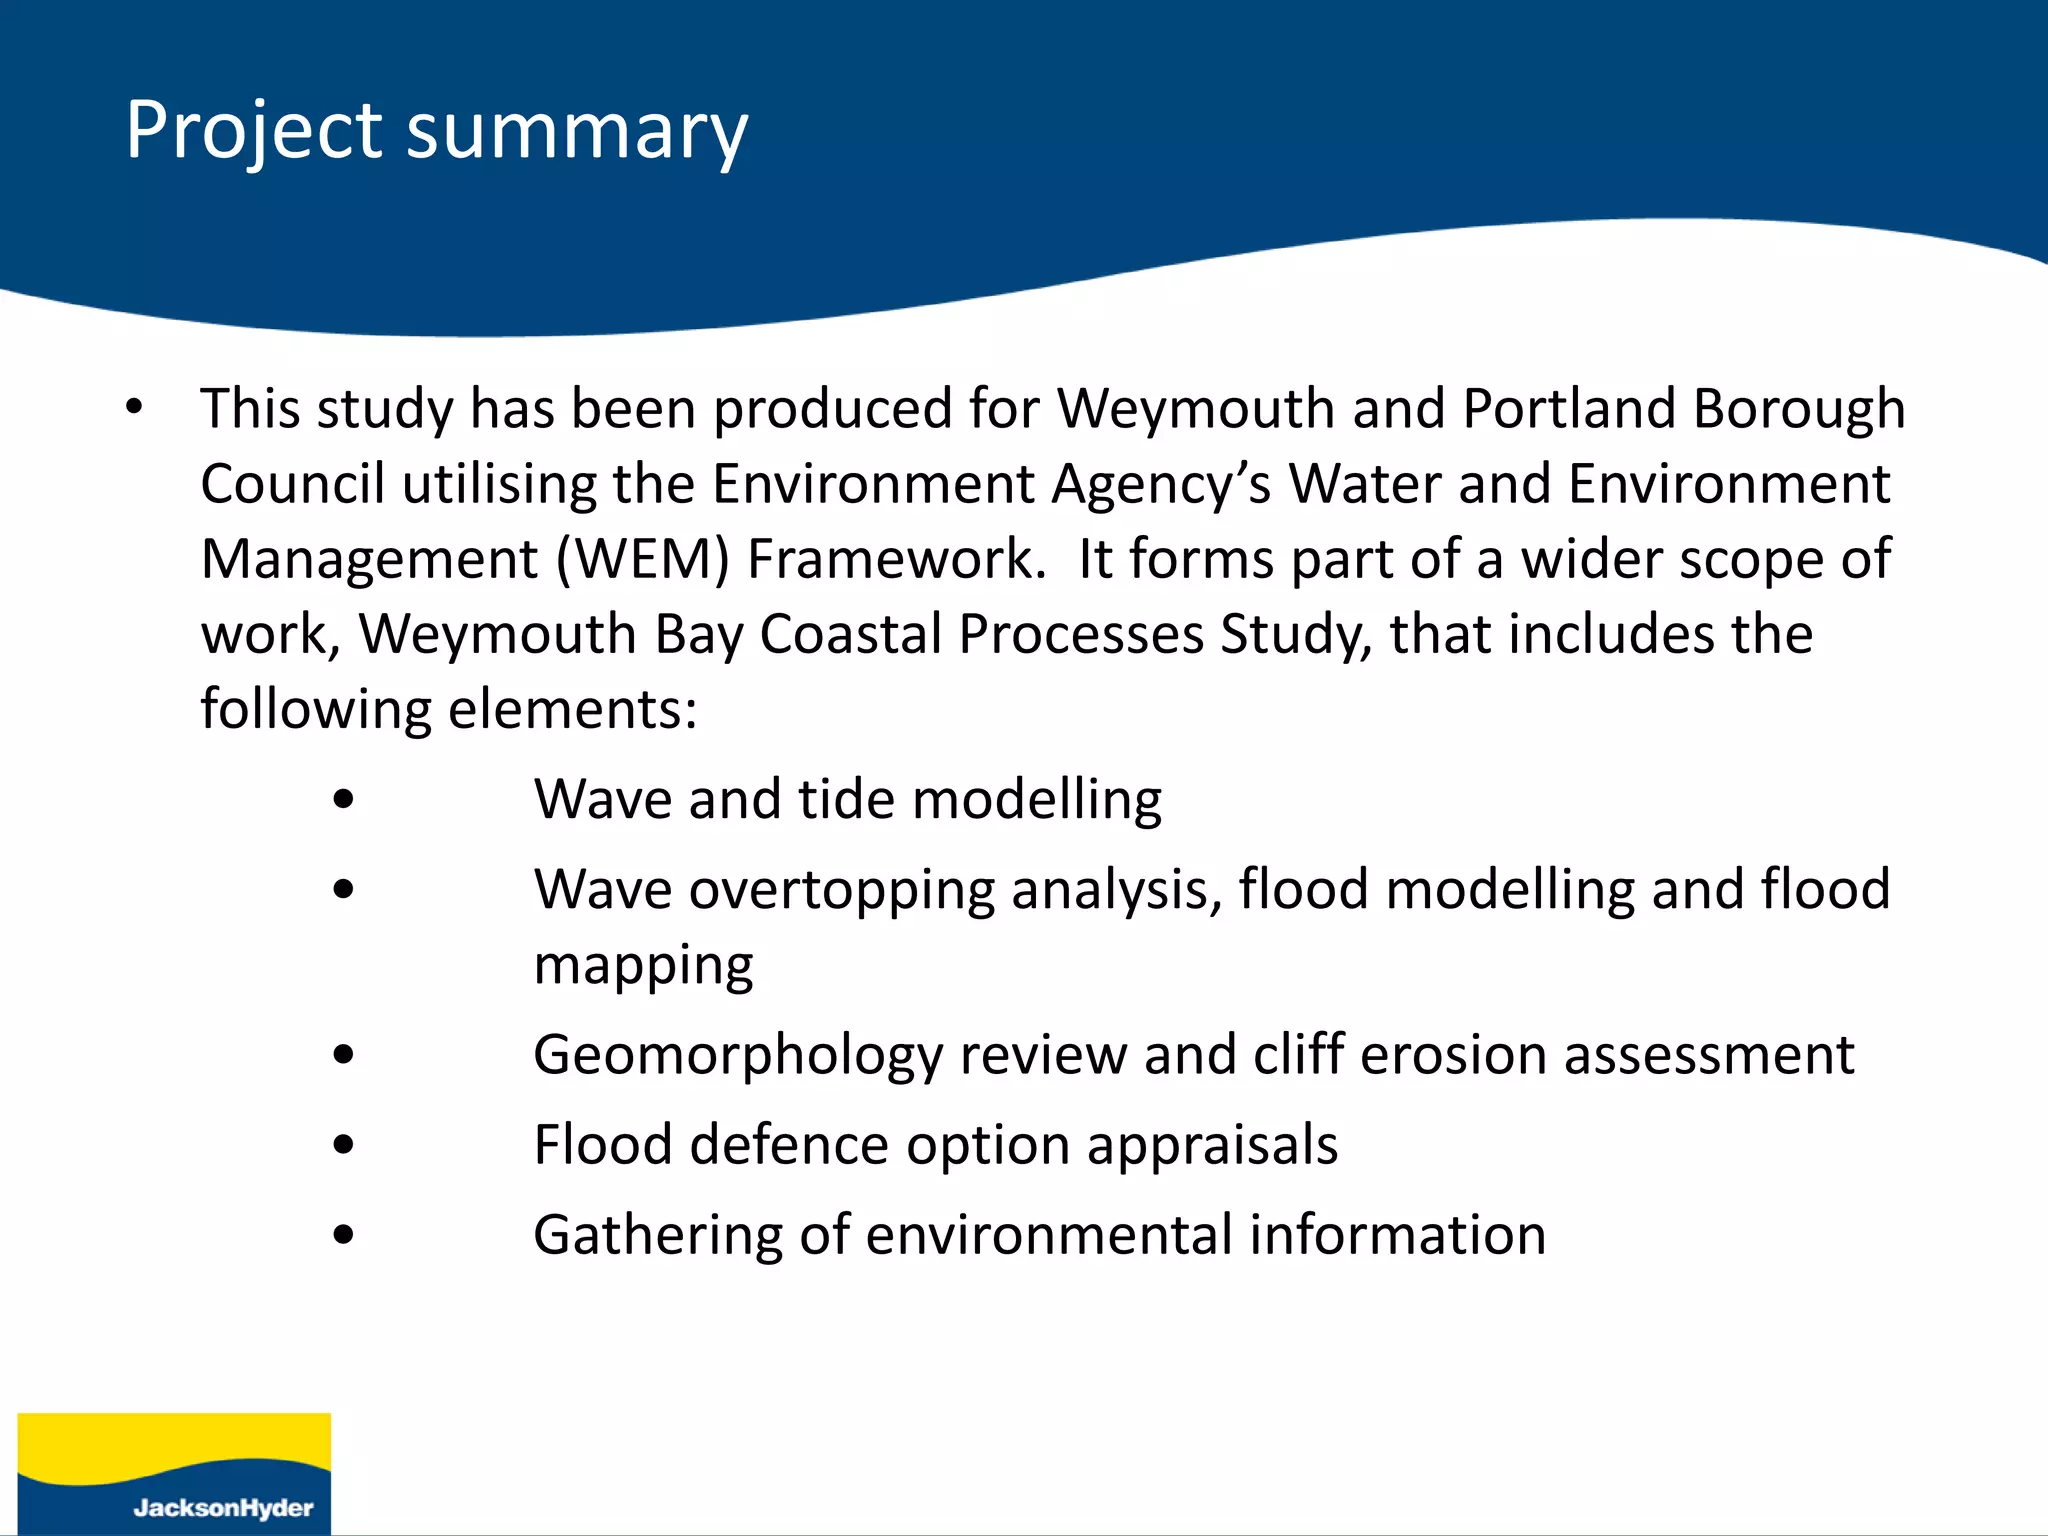
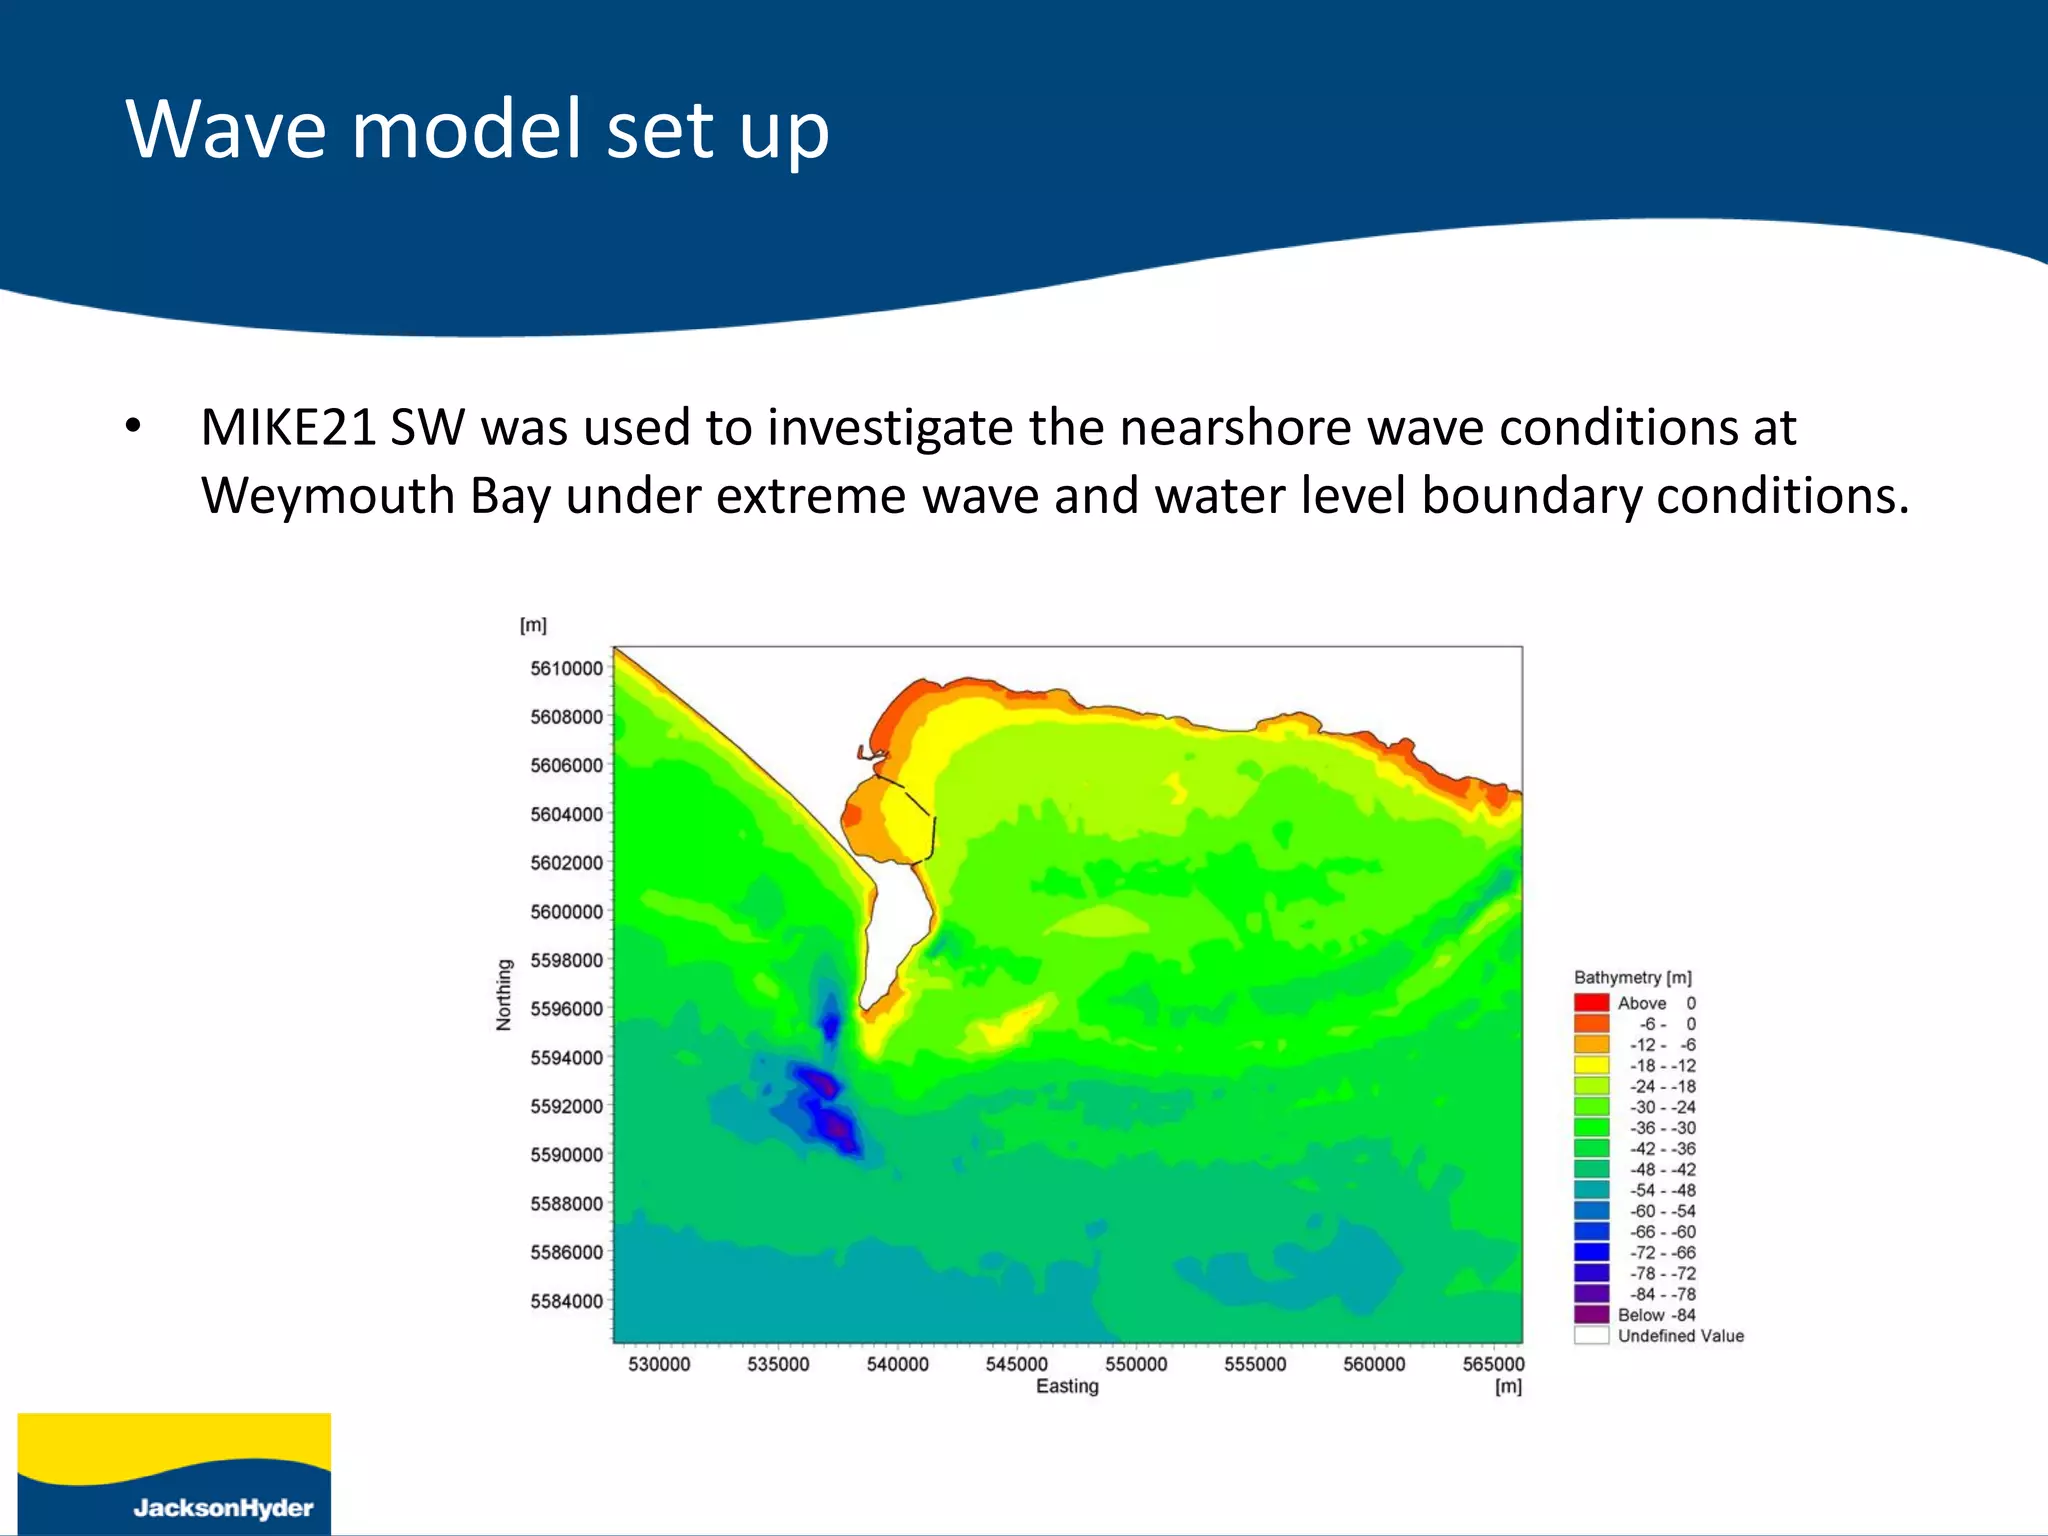
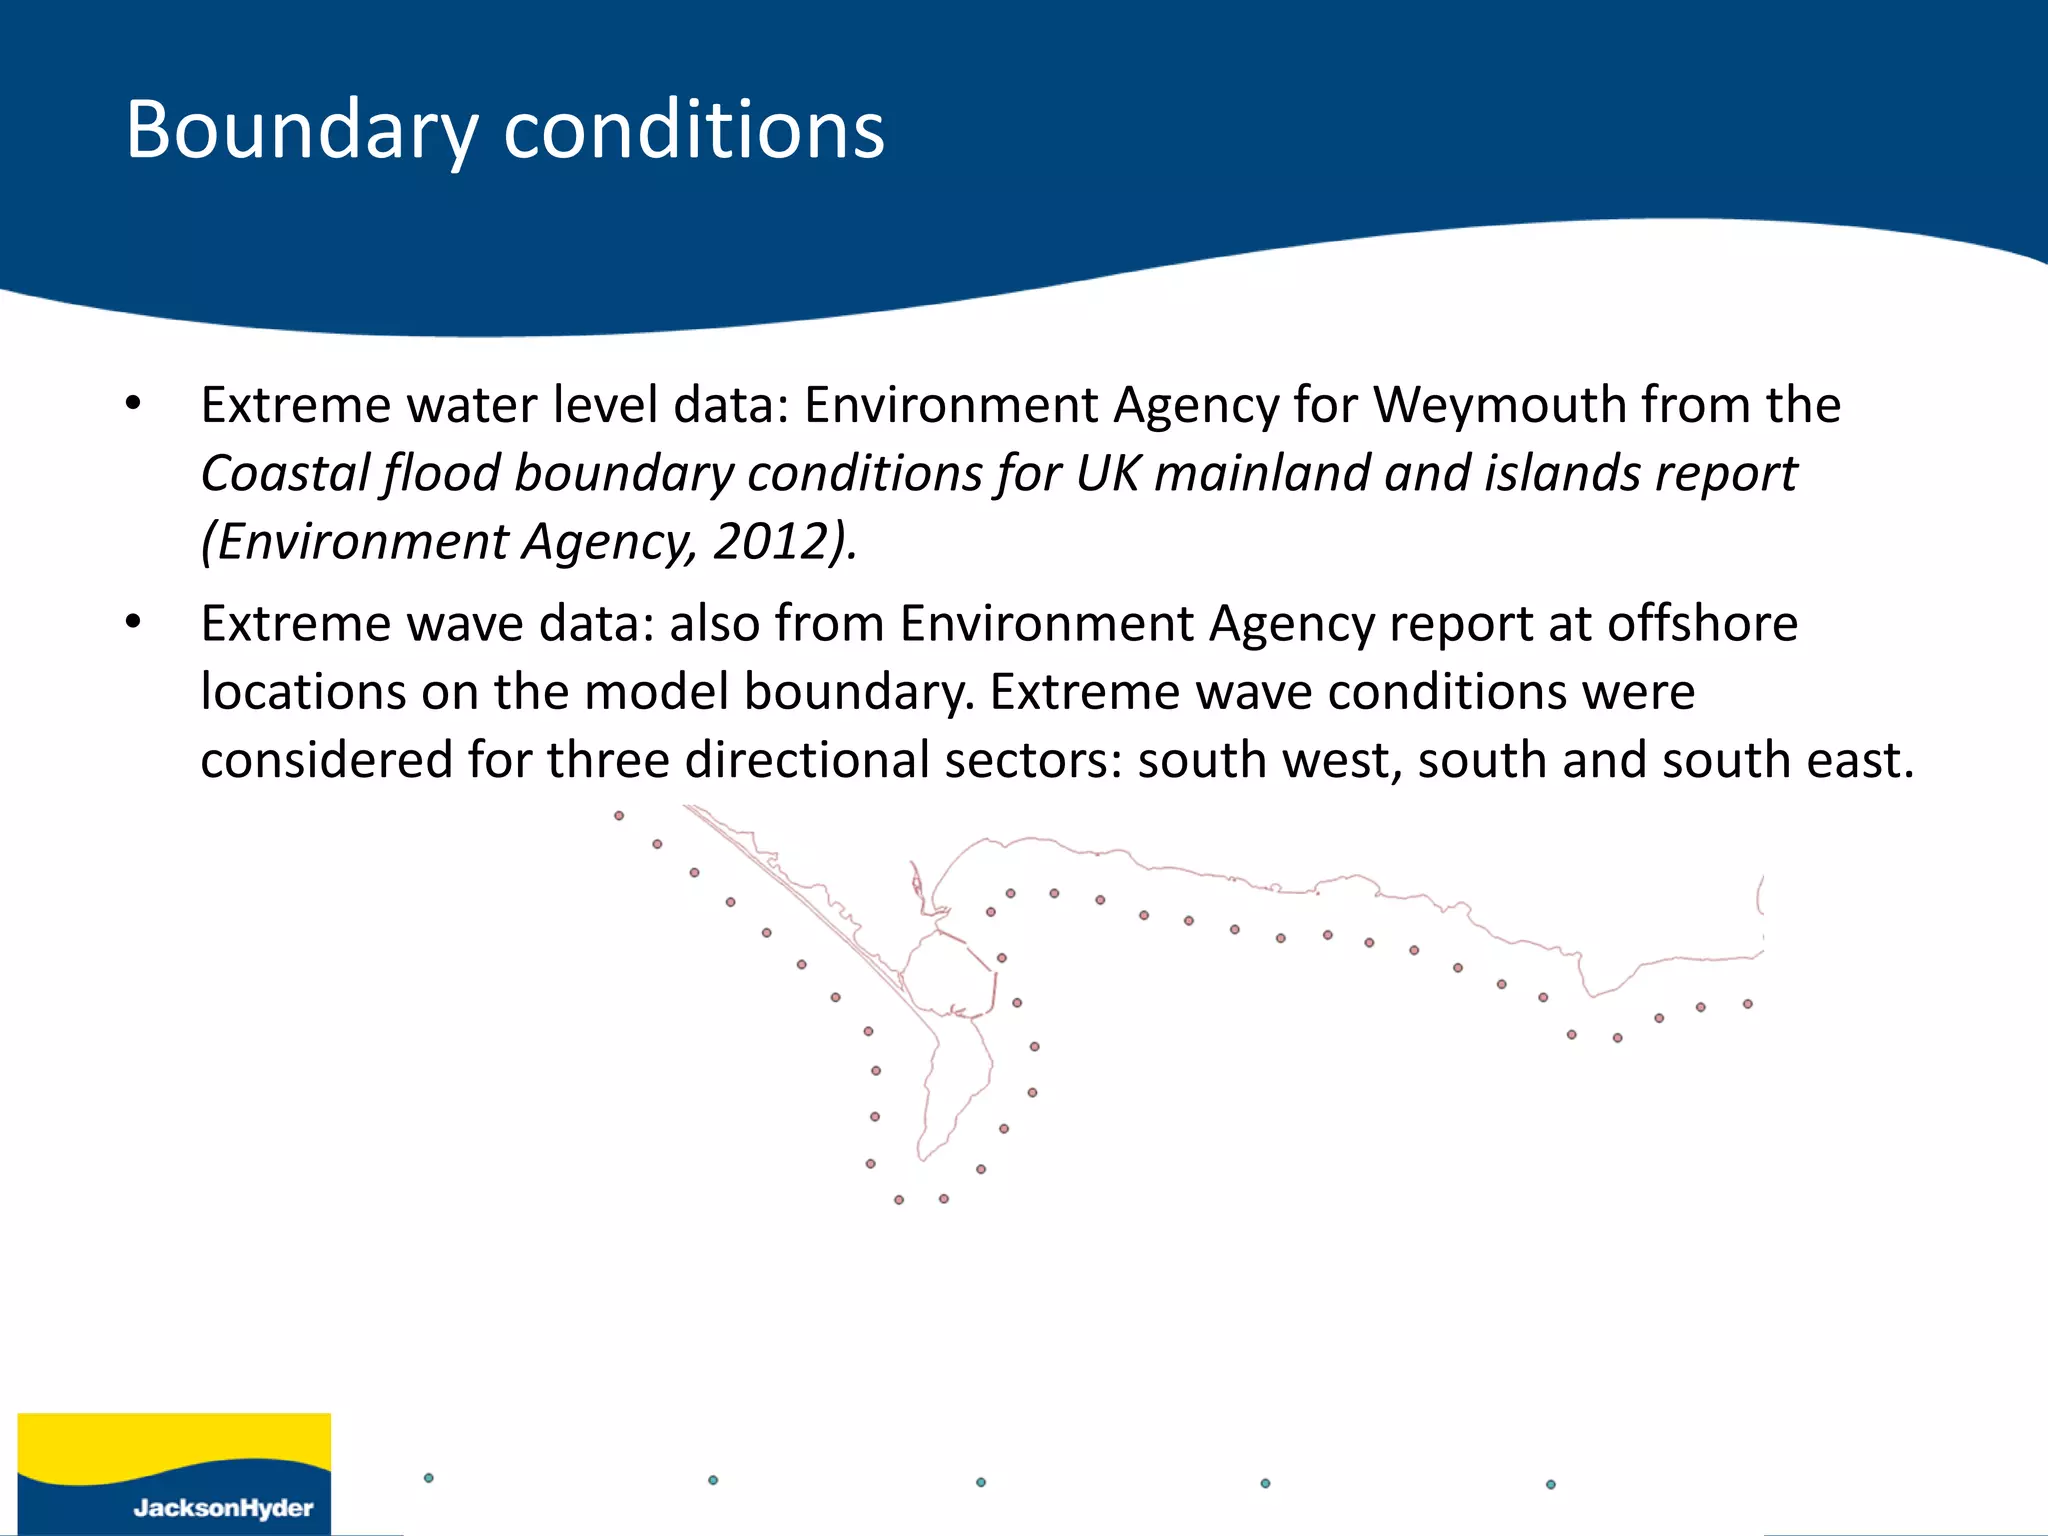
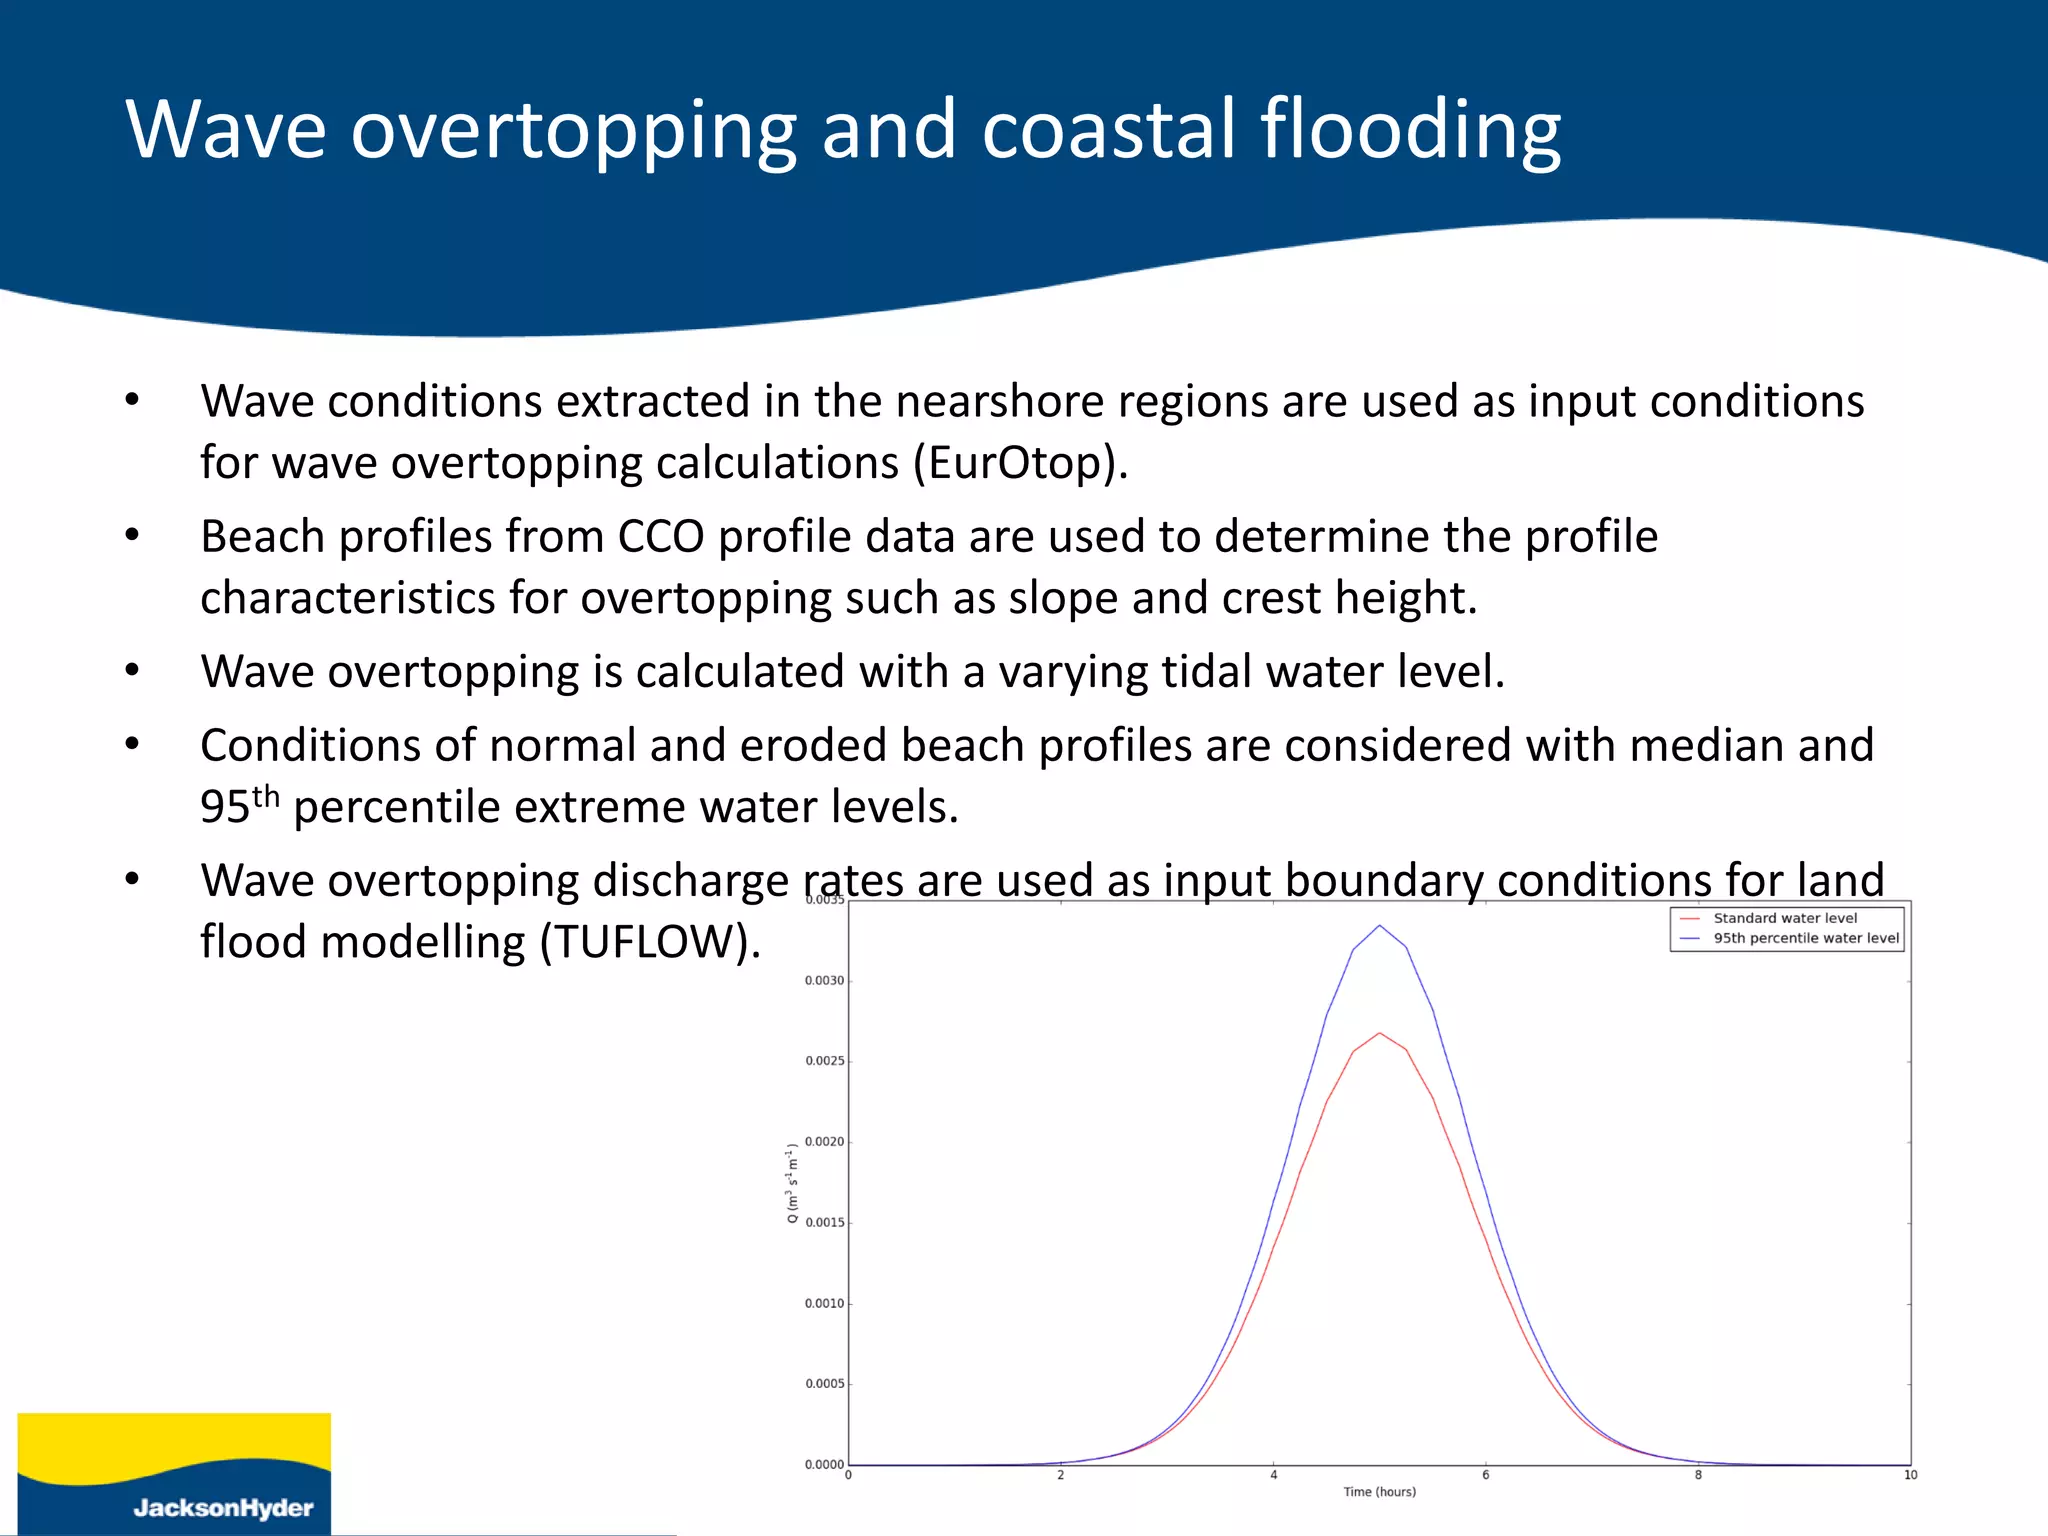
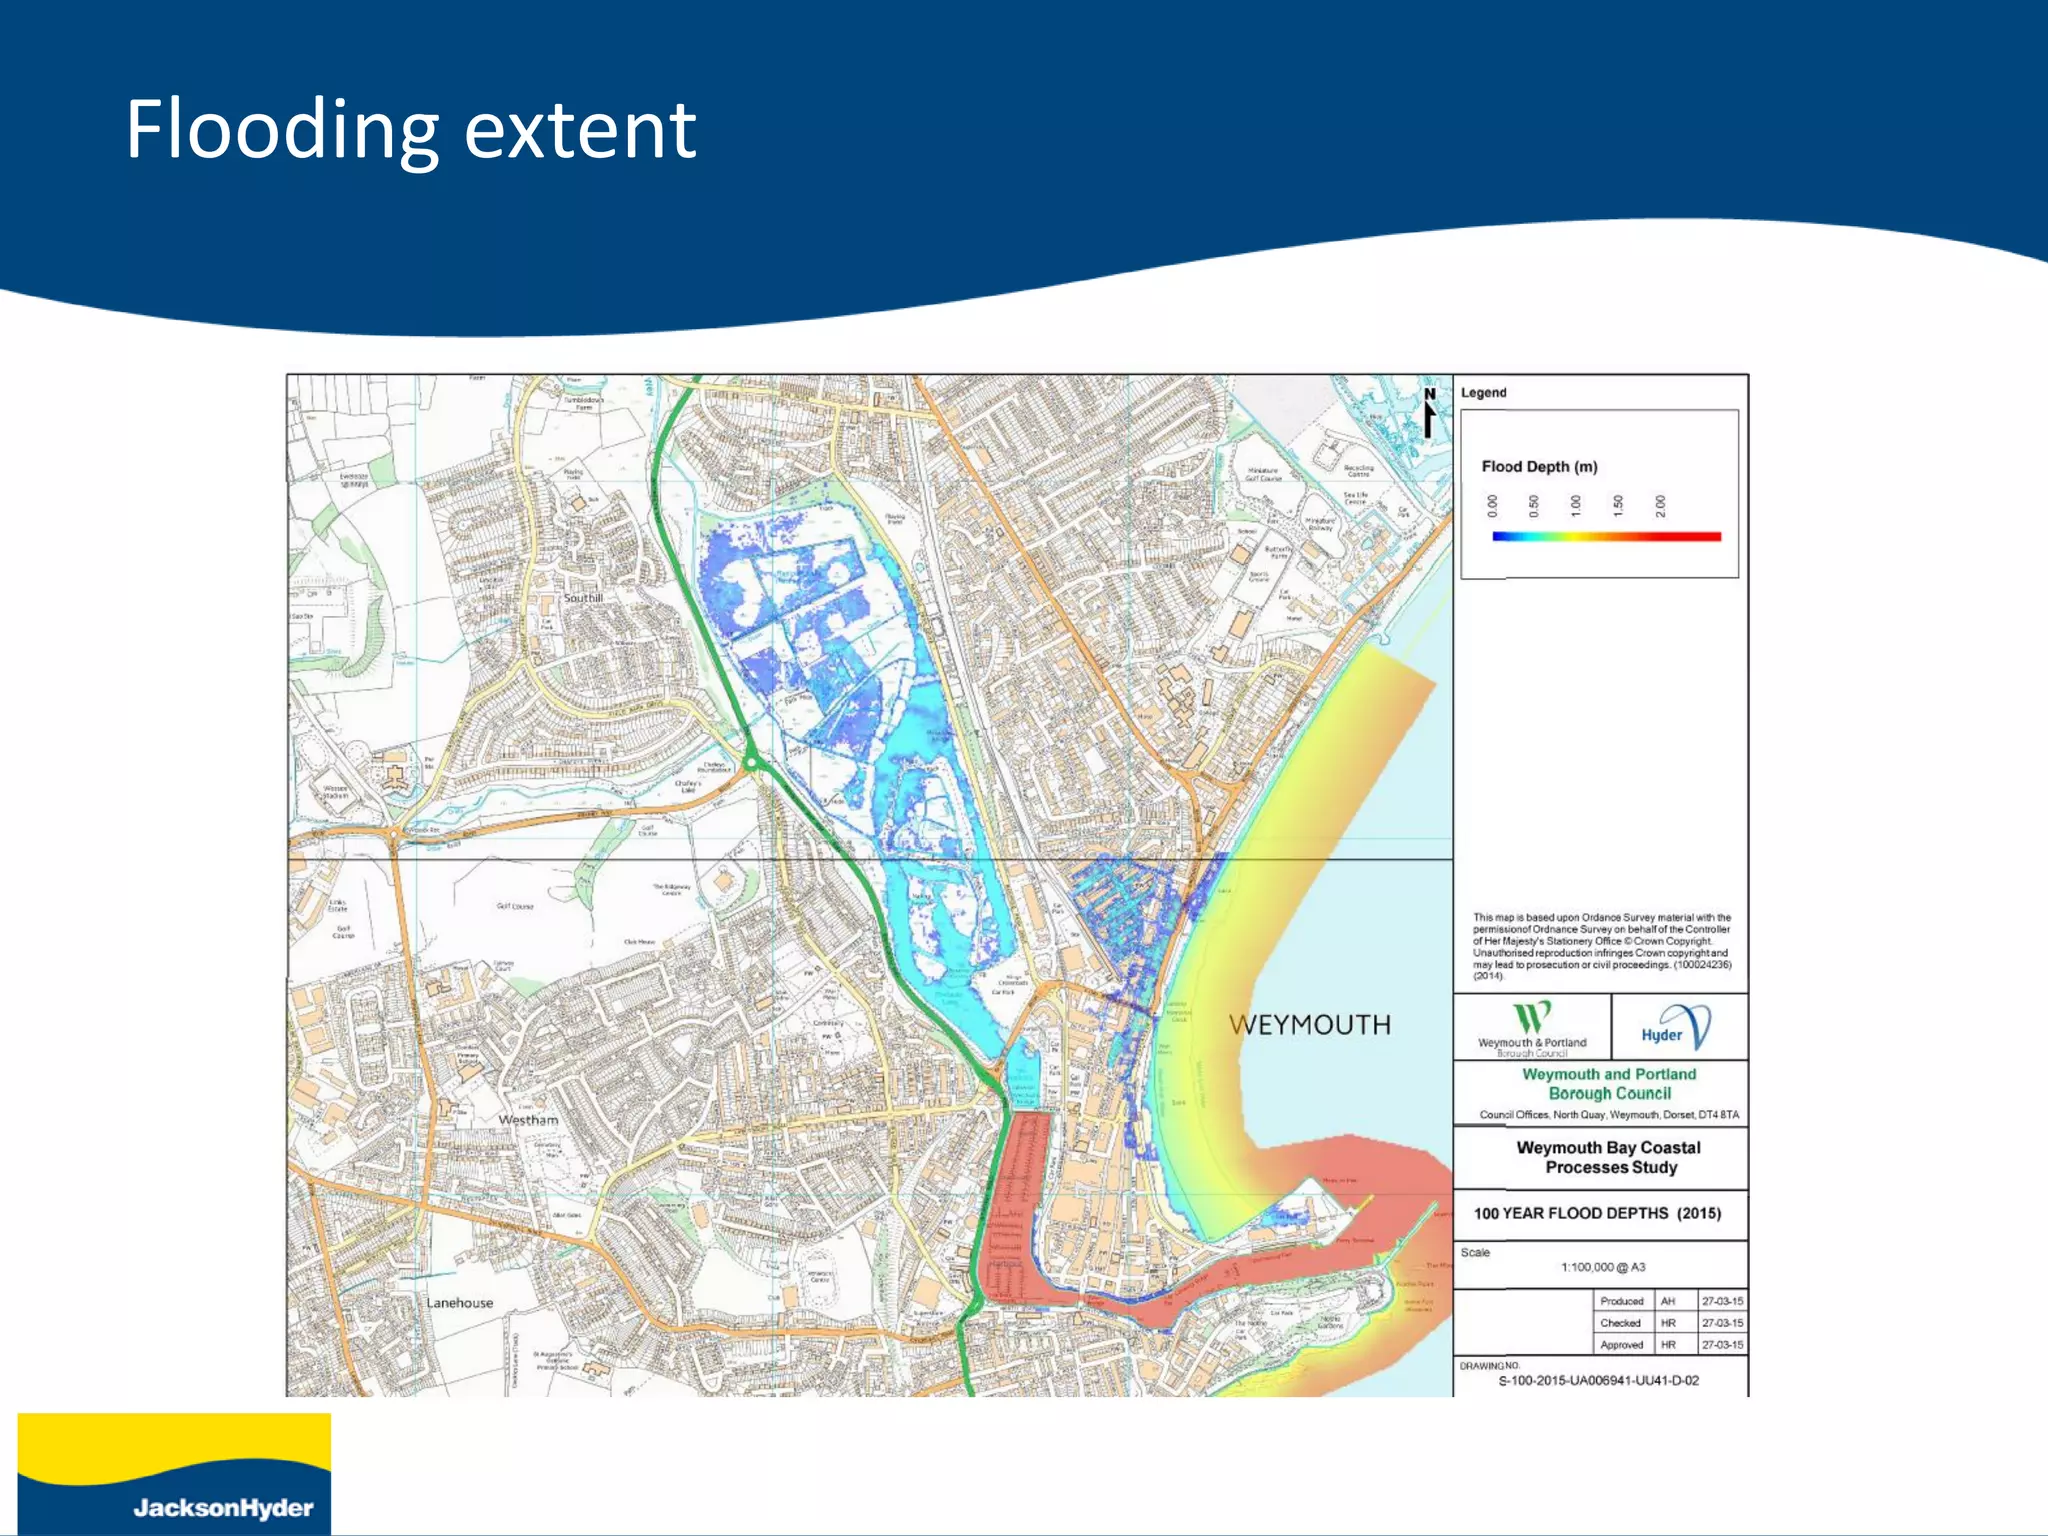
Modelling extreme conditions for
wave overtopping at Weymouth
Oliver Way
Project summary
• This study has been produced for Weymouth and Portland Borough
Council utilising the Environment Agency’s Water and Environment
Management (WEM) Framework. It forms part of a wider scope of
work, Weymouth Bay Coastal Processes Study, that includes the
following elements:
• Wave and tide modelling
• Wave overtopping analysis, flood modelling and flood
mapping
• Geomorphology review and cliff erosion assessment
• Flood defence option appraisals
• Gathering of environmental information
Wave model set up
• MIKE21 SW was used to investigate the nearshore wave conditions at
Weymouth Bay under extreme wave and water level boundary conditions.
Boundary conditions
• Extreme water level data: Environment Agency for Weymouth from the
Coastal flood boundary conditions for UK mainland and islands report
(Environment Agency, 2012).
• Extreme wave data: also from Environment Agency report at offshore
locations on the model boundary. Extreme wave conditions were
considered for three directional sectors: south west, south and south east.
Wave data format
• Swell and resultant wave data available
– Hs
– Tz
DIRECTIONS T1 T2 T5 T10 T20 T25 T50 T75 T100 T150 T200 T250 T300 T500 T1000
NORTH N/A N/A N/A N/A N/A N/A N/A N/A N/A N/A N/A N/A N/A N/A N/A
NORTHEAST N/A N/A N/A N/A N/A N/A N/A N/A N/A N/A N/A N/A N/A N/A N/A
SOUTHEAST 2.34 2.51 2.69 2.81 2.91 2.94 3.02 3.06 3.09 3.13 3.15 3.17 3.19 3.22 3.27
SOUTH 2.86 3.16 3.48 3.67 3.83 3.87 3.99 4.05 4.09 4.14 4.18 4.2 4.22 4.27 4.32
SOUTHWEST 3.61 3.82 4.07 4.24 4.4 4.45 4.59 4.67 4.72 4.79 4.84 4.88 4.91 4.99 5.09
NORTHWEST 1.91 2.15 2.37 2.48 2.57 2.59 2.65 2.67 2.69 2.71 2.72 2.73 2.73 2.75 2.76
Water level data format
Return period Water level Confidence
1 1.77 0.1
2 1.84 0.1
5 1.93 0.1
10 1.99 0.1
20 2.05 0.1
25 2.07 0.1
50 2.14 0.1
75 2.17 0.1
100 2.20 0.2
150 2.23 0.2
200 2.26 0.2
250 2.28 0.2
300 2.29 0.2
500 2.34 0.2
1000 2.40 0.3
10000 2.59 0.3
Sea level rise
• An adjustment for sea level rise to the extreme water levels was applied to
account for potential future coastal flooding. Projections of relative mean
sea level were provided by EA Guidance Note: Adapting to Climate
Change: Advice for Flood and Coastal Erosion Risk Management
Authorities (Environment Agency, 2011).
– 4 mm/yr up to 2025,
– 8 mm/yr for 2026 to 2050,
– 11 mm/yr for 2051 to 2080 and
– 15 mm/yr between 2081 and 2115.
• The return period values of extreme water level provided by the
Environment Agency are referenced from a base year of 2008. Therefore,
the extreme water levels have been adjusted to present day levels (2015)
and further projections are made for 2065, 2115 and 2126.
Joint probability
• Joint probability was estimated in accordance with EA/Defra guidance
contained within Use of Joint probability Methods in Flood Management, A
Guide to Best Practice, 2005. A “super” correlated relationship between
water level and wave conditions has been assumed using the guidance
Figures in EA/Defra 2005.
Simulations
• Joint probability
– 1, 2, 5, 10, 25, 50, 75, 100, 200, 1000
• Climate change
– 2015, 2065, 2115, 2126
• Total = 40 for each of the 3 directional sectors
– South west, south, south east
– For resultant and swell wave data
Simulation matrix
Joint
Probability
(yrs)
Climate
Change
(yrs) Degrees
Tide
return
(yrs)
Water
level
(mOD)
Wave
return
(yrs)
Wave
height
(m)
1 2015 120 1 1.80 1 4.25
1 2065 120 1 2.18 1 4.25
1 2115 120 1 2.87 1 4.25
1 2126 120 1 3.04 1 4.25
2 2015 120 2 1.87 1 4.25
2 2065 120 2 2.25 1 4.25
2 2115 120 2 2.94 1 4.25
2 2126 120 2 3.11 1 4.25
5 2015 120 5 1.95 1 4.25
5 2065 120 5 2.33 1 4.25
5 2115 120 5 3.02 1 4.25
5 2126 120 5 3.19 1 4.25
10 2015 120 10 2.02 1 4.25
10 2065 120 10 2.40 1 4.25
10 2115 120 10 3.09 1 4.25
10 2126 120 10 3.26 1 4.25
25 2015 120 25 2.10 1 4.25
25 2065 120 25 2.48 1 4.25
25 2115 120 25 3.17 1 4.25
25 2126 120 25 3.34 1 4.25
Joint
Probability
(yrs)
Climate
Change
(yrs) Degrees
Tide
return
(yrs)
Water
level
(mOD)
Wave
return
(yrs)
Wave
height
(m)
50 2015 120 50 2.16 1 4.25
50 2065 120 50 2.54 1 4.25
50 2115 120 50 3.23 1 4.25
50 2126 120 50 3.40 1 4.25
75 2015 120 75 2.20 2 4.40
75 2065 120 75 2.58 2 4.40
75 2115 120 75 3.27 2 4.40
75 2126 120 75 3.44 2 4.40
100 2015 120 100 2.22 2 4.40
100 2065 120 100 2.60 2 4.40
100 2115 120 100 3.29 2 4.40
100 2126 120 100 3.46 2 4.40
200 2015 120 200 2.28 3 4.45
200 2065 120 200 2.66 3 4.45
200 2115 120 200 3.35 3 4.45
200 2126 120 200 3.52 3 4.45
1000 2015 120 1000 2.42 10 4.64
1000 2065 120 1000 2.80 10 4.64
1000 2115 120 1000 3.49 10 4.64
1000 2126 120 1000 3.66 10 4.64
Model validation
• Time series wave data were not available
at the model boundary to make a direct
comparison with time series data further
inshore on the model domain.
• A 50 year storm event was identified
from the Channel Coastal Observatory
(CCO) report Review of south coast
beach response to wave conditions in
the winter of 2013-2014.
• Due to the limited availability of time
series wave data at the model boundary,
this was considered to be an appropriate
method of validation for the Weymouth
MIKE21 SW model.
Swell or resultant wave data
• Resultant wave data was determined to produce larger nearshore wave heights.
Wave results: south west
Wave results: south
Wave results: south east
Data output
Output results
Beach profiles
• Wave conditions extracted in the nearshore regions are used as input conditions
for wave overtopping calculations (EurOtop).
• Beach profiles from CCO profile data are used to determine the profile
characteristics for overtopping such as slope and crest height.
• Wave overtopping is calculated with a varying tidal water level.
• Conditions of normal and eroded beach profiles are considered with median and
95th percentile extreme water levels.
• Wave overtopping discharge rates are used as input boundary conditions for land
flood modelling (TUFLOW).
Wave overtopping and coastal flooding
• Many short runs for all return periods and climate change.
• Python used to create multiple steering files from boundary condition
matrix.
• MIKE21 SW run with batch file.
• Results extracted from MIKE data files using the .NET scripts (read_dfs0).
• This allows data to be extracted from multiple results files which can then
be plotted and/or used in python based EurOtop calculations.
Routine automation
Flooding extent
Any questions?

Modelling extreme conditions for wave overtopping at Weymouth - Oliver Way (Hyder Consulting)

  • 1.
    Modelling extreme conditionsfor wave overtopping at Weymouth Oliver Way
  • 2.
    Project summary • Thisstudy has been produced for Weymouth and Portland Borough Council utilising the Environment Agency’s Water and Environment Management (WEM) Framework. It forms part of a wider scope of work, Weymouth Bay Coastal Processes Study, that includes the following elements: • Wave and tide modelling • Wave overtopping analysis, flood modelling and flood mapping • Geomorphology review and cliff erosion assessment • Flood defence option appraisals • Gathering of environmental information
  • 3.
    Wave model setup • MIKE21 SW was used to investigate the nearshore wave conditions at Weymouth Bay under extreme wave and water level boundary conditions.
  • 4.
    Boundary conditions • Extremewater level data: Environment Agency for Weymouth from the Coastal flood boundary conditions for UK mainland and islands report (Environment Agency, 2012). • Extreme wave data: also from Environment Agency report at offshore locations on the model boundary. Extreme wave conditions were considered for three directional sectors: south west, south and south east.
  • 5.
    Wave data format •Swell and resultant wave data available – Hs – Tz DIRECTIONS T1 T2 T5 T10 T20 T25 T50 T75 T100 T150 T200 T250 T300 T500 T1000 NORTH N/A N/A N/A N/A N/A N/A N/A N/A N/A N/A N/A N/A N/A N/A N/A NORTHEAST N/A N/A N/A N/A N/A N/A N/A N/A N/A N/A N/A N/A N/A N/A N/A SOUTHEAST 2.34 2.51 2.69 2.81 2.91 2.94 3.02 3.06 3.09 3.13 3.15 3.17 3.19 3.22 3.27 SOUTH 2.86 3.16 3.48 3.67 3.83 3.87 3.99 4.05 4.09 4.14 4.18 4.2 4.22 4.27 4.32 SOUTHWEST 3.61 3.82 4.07 4.24 4.4 4.45 4.59 4.67 4.72 4.79 4.84 4.88 4.91 4.99 5.09 NORTHWEST 1.91 2.15 2.37 2.48 2.57 2.59 2.65 2.67 2.69 2.71 2.72 2.73 2.73 2.75 2.76
  • 6.
    Water level dataformat Return period Water level Confidence 1 1.77 0.1 2 1.84 0.1 5 1.93 0.1 10 1.99 0.1 20 2.05 0.1 25 2.07 0.1 50 2.14 0.1 75 2.17 0.1 100 2.20 0.2 150 2.23 0.2 200 2.26 0.2 250 2.28 0.2 300 2.29 0.2 500 2.34 0.2 1000 2.40 0.3 10000 2.59 0.3
  • 7.
    Sea level rise •An adjustment for sea level rise to the extreme water levels was applied to account for potential future coastal flooding. Projections of relative mean sea level were provided by EA Guidance Note: Adapting to Climate Change: Advice for Flood and Coastal Erosion Risk Management Authorities (Environment Agency, 2011). – 4 mm/yr up to 2025, – 8 mm/yr for 2026 to 2050, – 11 mm/yr for 2051 to 2080 and – 15 mm/yr between 2081 and 2115. • The return period values of extreme water level provided by the Environment Agency are referenced from a base year of 2008. Therefore, the extreme water levels have been adjusted to present day levels (2015) and further projections are made for 2065, 2115 and 2126.
  • 8.
    Joint probability • Jointprobability was estimated in accordance with EA/Defra guidance contained within Use of Joint probability Methods in Flood Management, A Guide to Best Practice, 2005. A “super” correlated relationship between water level and wave conditions has been assumed using the guidance Figures in EA/Defra 2005.
  • 9.
    Simulations • Joint probability –1, 2, 5, 10, 25, 50, 75, 100, 200, 1000 • Climate change – 2015, 2065, 2115, 2126 • Total = 40 for each of the 3 directional sectors – South west, south, south east – For resultant and swell wave data
  • 10.
    Simulation matrix Joint Probability (yrs) Climate Change (yrs) Degrees Tide return (yrs) Water level (mOD) Wave return (yrs) Wave height (m) 12015 120 1 1.80 1 4.25 1 2065 120 1 2.18 1 4.25 1 2115 120 1 2.87 1 4.25 1 2126 120 1 3.04 1 4.25 2 2015 120 2 1.87 1 4.25 2 2065 120 2 2.25 1 4.25 2 2115 120 2 2.94 1 4.25 2 2126 120 2 3.11 1 4.25 5 2015 120 5 1.95 1 4.25 5 2065 120 5 2.33 1 4.25 5 2115 120 5 3.02 1 4.25 5 2126 120 5 3.19 1 4.25 10 2015 120 10 2.02 1 4.25 10 2065 120 10 2.40 1 4.25 10 2115 120 10 3.09 1 4.25 10 2126 120 10 3.26 1 4.25 25 2015 120 25 2.10 1 4.25 25 2065 120 25 2.48 1 4.25 25 2115 120 25 3.17 1 4.25 25 2126 120 25 3.34 1 4.25 Joint Probability (yrs) Climate Change (yrs) Degrees Tide return (yrs) Water level (mOD) Wave return (yrs) Wave height (m) 50 2015 120 50 2.16 1 4.25 50 2065 120 50 2.54 1 4.25 50 2115 120 50 3.23 1 4.25 50 2126 120 50 3.40 1 4.25 75 2015 120 75 2.20 2 4.40 75 2065 120 75 2.58 2 4.40 75 2115 120 75 3.27 2 4.40 75 2126 120 75 3.44 2 4.40 100 2015 120 100 2.22 2 4.40 100 2065 120 100 2.60 2 4.40 100 2115 120 100 3.29 2 4.40 100 2126 120 100 3.46 2 4.40 200 2015 120 200 2.28 3 4.45 200 2065 120 200 2.66 3 4.45 200 2115 120 200 3.35 3 4.45 200 2126 120 200 3.52 3 4.45 1000 2015 120 1000 2.42 10 4.64 1000 2065 120 1000 2.80 10 4.64 1000 2115 120 1000 3.49 10 4.64 1000 2126 120 1000 3.66 10 4.64
  • 11.
    Model validation • Timeseries wave data were not available at the model boundary to make a direct comparison with time series data further inshore on the model domain. • A 50 year storm event was identified from the Channel Coastal Observatory (CCO) report Review of south coast beach response to wave conditions in the winter of 2013-2014. • Due to the limited availability of time series wave data at the model boundary, this was considered to be an appropriate method of validation for the Weymouth MIKE21 SW model.
  • 12.
    Swell or resultantwave data • Resultant wave data was determined to produce larger nearshore wave heights.
  • 13.
  • 14.
  • 15.
  • 16.
  • 17.
  • 18.
  • 19.
    • Wave conditionsextracted in the nearshore regions are used as input conditions for wave overtopping calculations (EurOtop). • Beach profiles from CCO profile data are used to determine the profile characteristics for overtopping such as slope and crest height. • Wave overtopping is calculated with a varying tidal water level. • Conditions of normal and eroded beach profiles are considered with median and 95th percentile extreme water levels. • Wave overtopping discharge rates are used as input boundary conditions for land flood modelling (TUFLOW). Wave overtopping and coastal flooding
  • 20.
    • Many shortruns for all return periods and climate change. • Python used to create multiple steering files from boundary condition matrix. • MIKE21 SW run with batch file. • Results extracted from MIKE data files using the .NET scripts (read_dfs0). • This allows data to be extracted from multiple results files which can then be plotted and/or used in python based EurOtop calculations. Routine automation
  • 21.
  • 22.