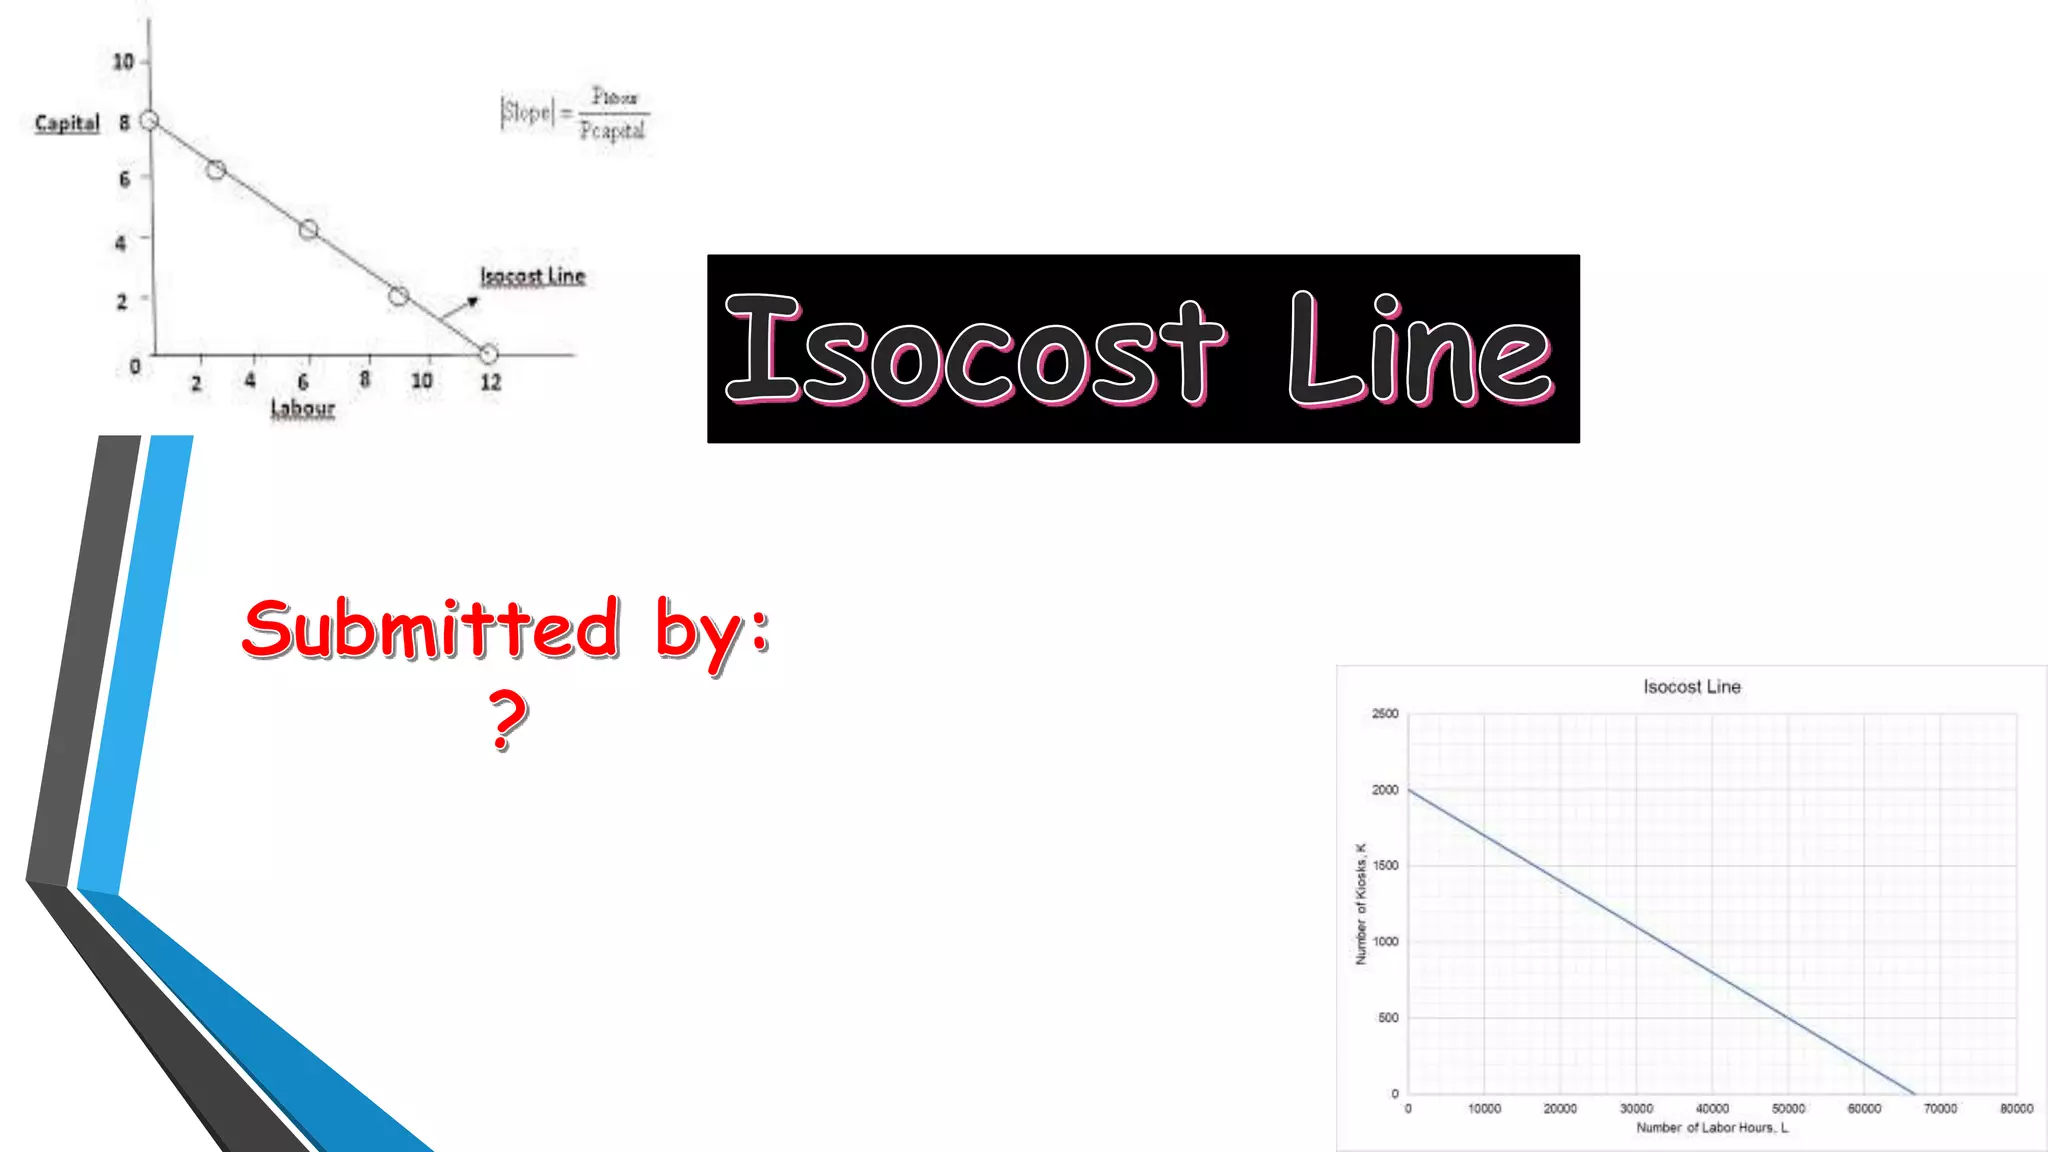
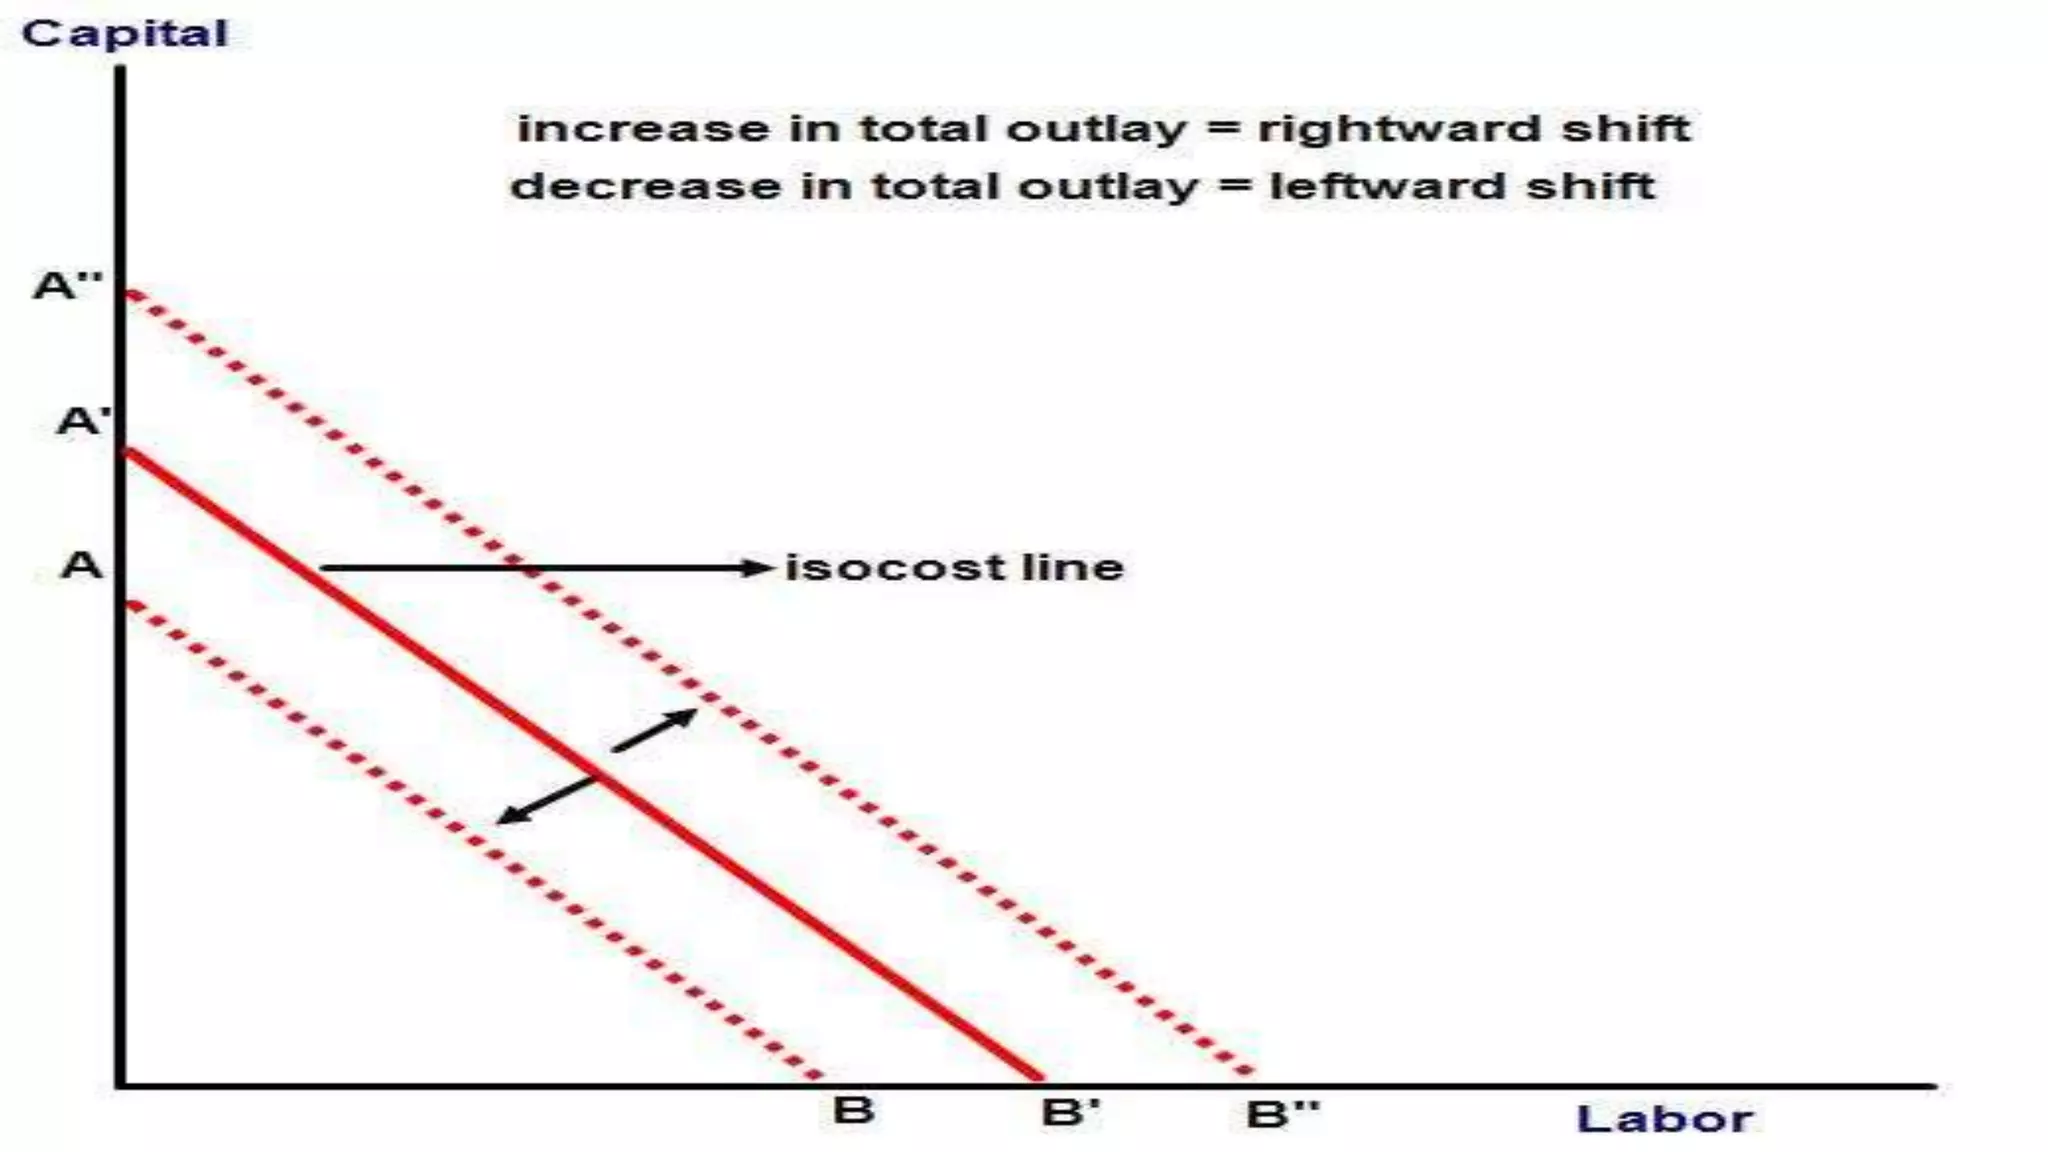
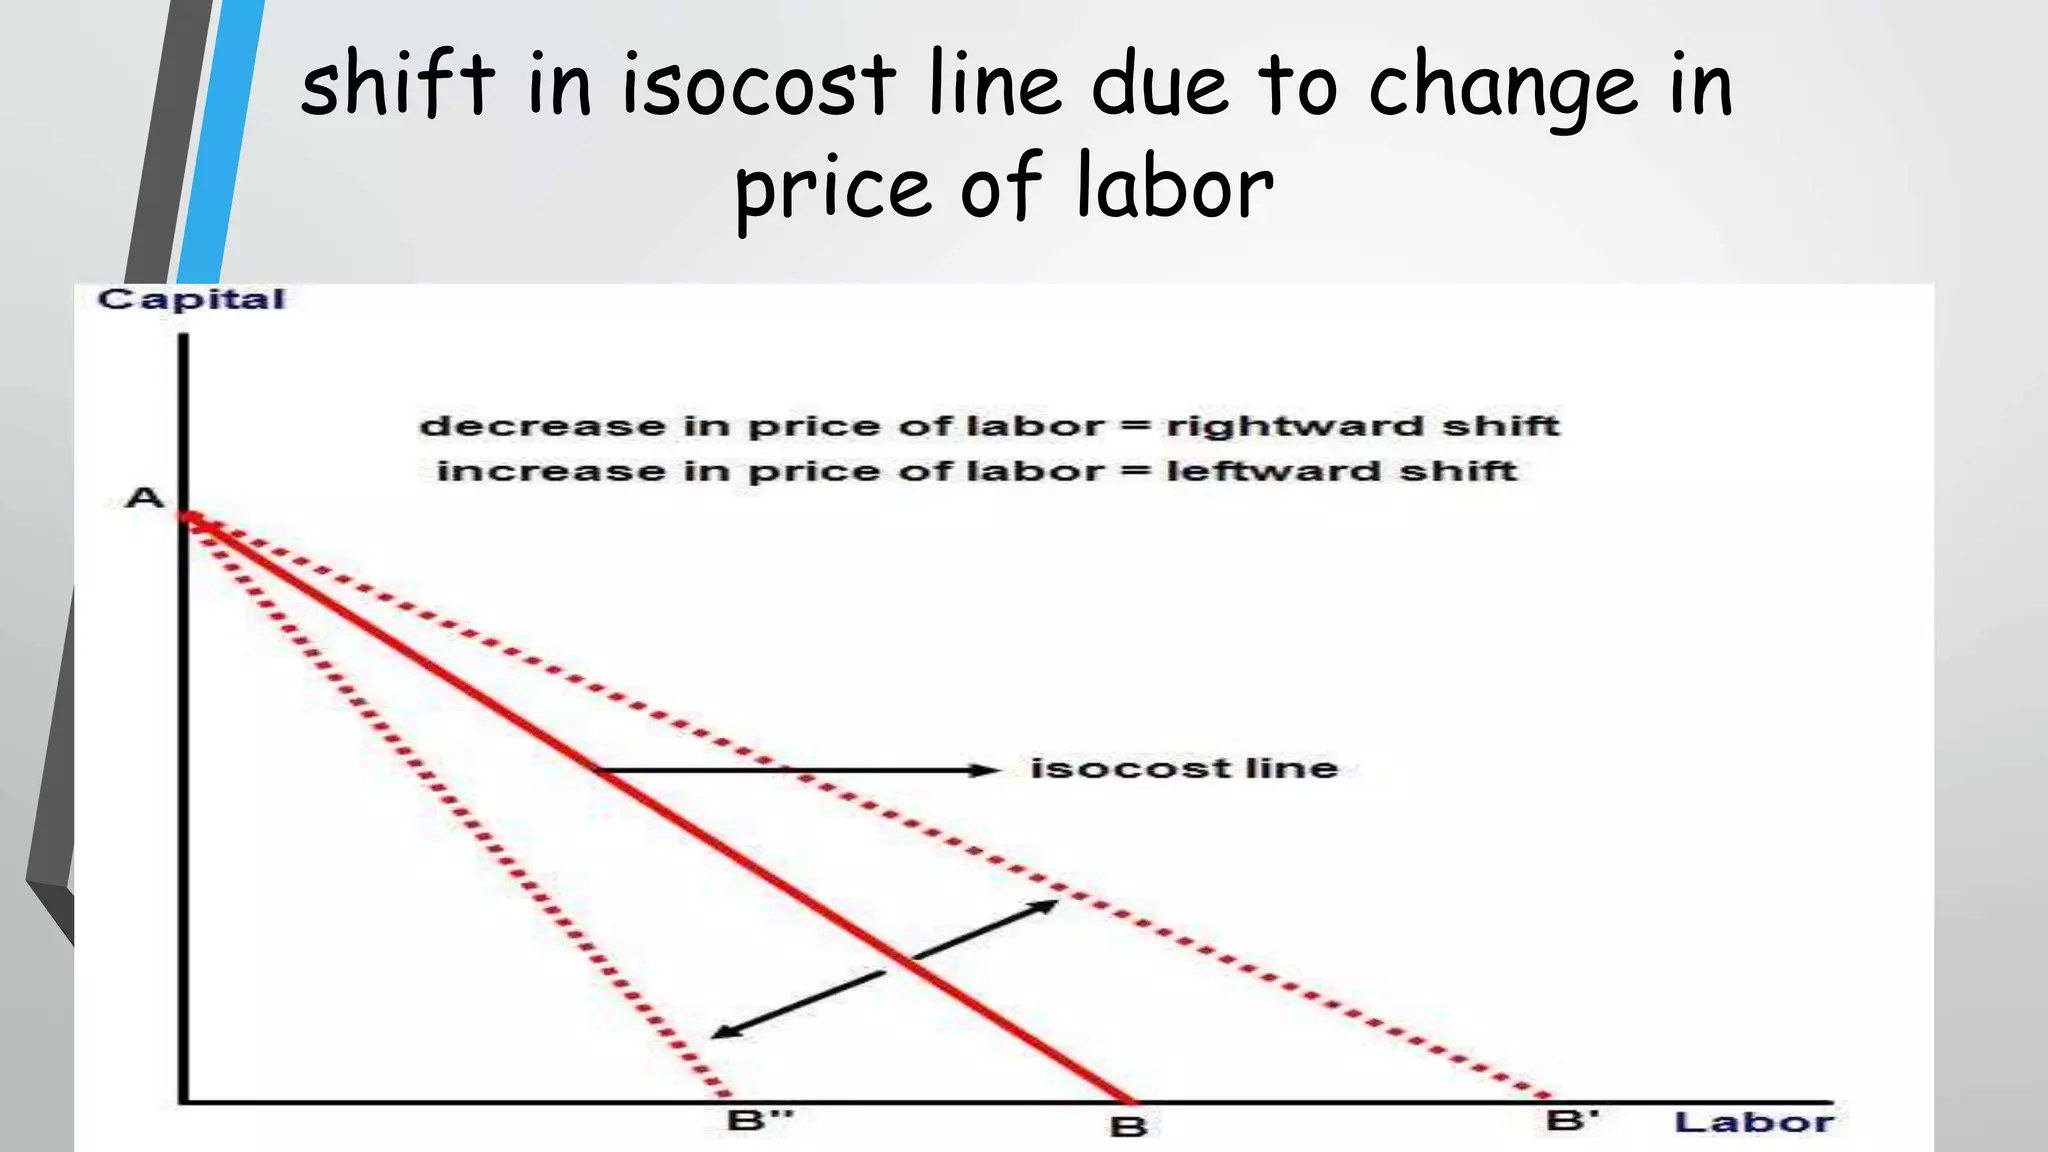
An isocost line graphically represents combinations of two factors, like labor and capital, that a firm can purchase with a given total budget. It is expressed mathematically as C = wL + rK, where C is the cost, w is the wage, L is labor, r is the interest rate, and K is capital. The slope of the isocost line equals the ratio of input prices. An isocost line can shift if the total budget or input prices change. An increased budget shifts the line parallel to the right, while higher input prices rotate the line clockwise or counterclockwise depending on which input's price increased.