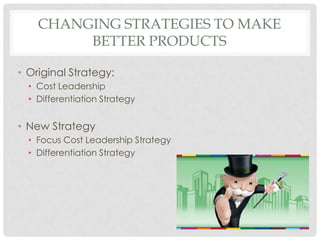
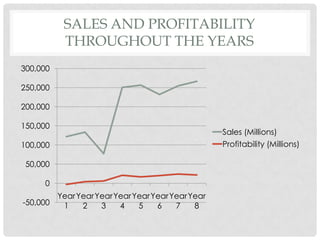
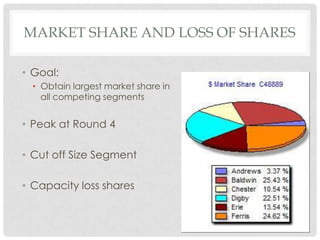
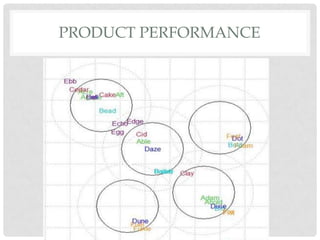
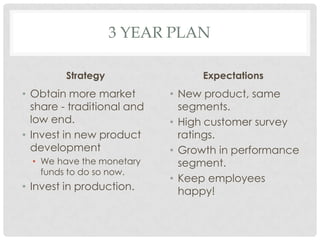
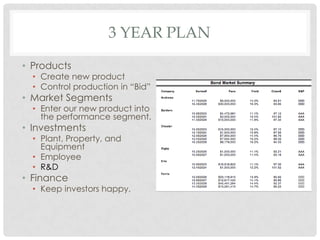
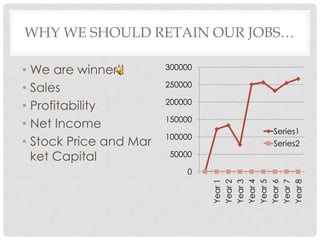
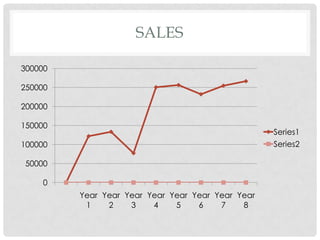
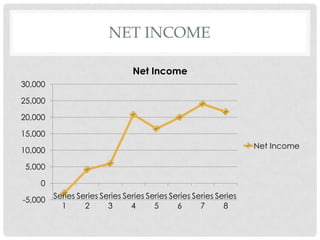
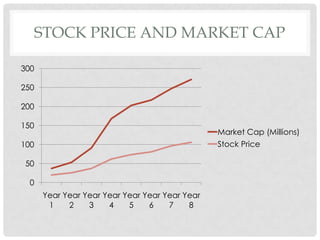
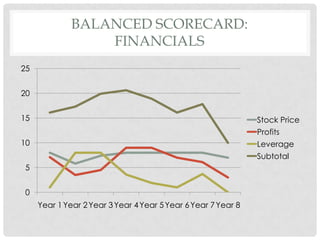
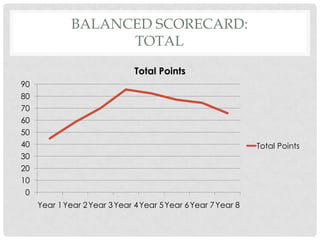
The document summarizes the Capstone simulation results of Minhee Huh, Molly McGowan, and King Tan. Their original strategy was cost leadership and differentiation but they shifted to focus on cost leadership and differentiation. They achieved peak market share in round 4 but then lost shares. Their 3-year plan focuses on developing new products, entering new segments, and making investments. They achieved high sales, profits, and stock price over the 8 rounds.


![Baldwin[2][1]](https://cdn.slidesharecdn.com/ss_thumbnails/baldwin21-120806215951-phpapp02-thumbnail.jpg?width=640&height=640&fit=bounds)


