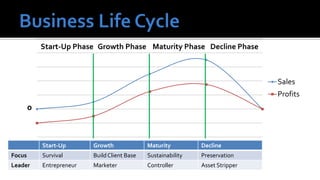
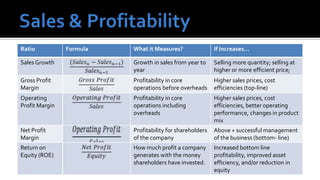
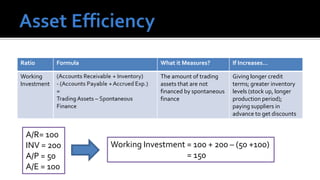
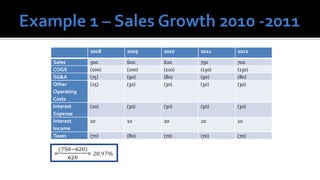
Ashraf Heleka
                     GOL Trainer


                 26 March, 2013
3/26/2013   `    All Rights Reserved © 2013   1
   Sales & Profitability
   Asset Efficiency
   Liquidity
   Solvency & Financial Structure
   Set targets
   Measure progress
   Compare to peers or industry
   Risk analysis/problem identification
   Accounting Knowledge
   Business Life Cycle
   Industry Analysis
   Financial Ratios
Start-Up Phase Growth Phase Maturity Phase Decline Phase


                                                                                 Sales
                                                                                 Profits
        0


            Start-Up       Growth              Maturity         Decline
Focus       Survival       Build Client Base   Sustainability   Preservation
Leader      Entrepreneur   Marketer            Controller       Asset Stripper
Threat of
              Potential
              Entrants


Bargaining     Rivalry     Bargaining
 Power of      Among        Power of
Suppliers    Competitors     Buyers


              Threat of
             Substitutes
    Cyclical
    Seasonal
    High Operational Leverage
    Differentiated
    Commoditized
3/26/2013       `     All Rights Reserved © 2013   7
Ratio           Formula   What it Measures?                If Increases…

Sales Growth              Growth in sales from year to     Selling more quantity; selling at
                          year                             higher or more efficient price;
Gross Profit              Profitability in core            Higher sales prices, cost
Margin                    operations before overheads      efficiencies (top-line)
Operating                 Profitability in core            Higher sales prices, cost
Profit Margin             operations including             efficiencies, better operating
                          overheads                        performance, changes in product
                                                           mix
Net Profit                Profitability for shareholders   Above + successful management
Margin                    of the company                   of the business (bottom- line)
Return on                 How much profit a company        Increased bottom line
Equity (ROE)              generates with the money         profitability, improved asset
                          shareholders have invested.      efficiency, and/or reduction in
                                                           equity
Ratio        Formula                What it Measures?         If Increases…

Working                             The amount of trading     Giving longer credit
Investment                          assets that are not       terms; greater inventory
                                    financed by spontaneous   levels (stock up, longer
                                    finance                   production period);
                                                              paying suppliers in
                                                              advance to get discounts


 A/R= 100
 INV = 200             Working Investment = 100 + 200 – (50 +100)
 A/P = 50                                 = 150
 A/E = 100
2008    2009    2010    2011    2012

Sales       500     600     620     750     700
COGS        (100)   (100)   (110)   (130)   (130)
SG&A        (75)    (90)    (80)    (90)    (80)
Other       (25)    (30)    (30)    (30)    (30)
Operating
Costs
Interest    (20)    (30)    (30)    (30)    (30)
Expense
Interest    10      10      20      20      10
Income
Taxes       (70)    (80)    (70)    (70)    (70)
2008          2009         2010          2011    2012

Sales        500           600          620           750     700
COGS         (100)         (100)        (110)         (130)   (130)
SG&A         (75)          (90)         (80)          (90)    (80)
Other        (25)          (30)         (30)          (30)    (30)
Operating
Costs
Interest     (20)          (30)         (30)          (30)    (30)
Expense
Interest     10            10           20            20      10
Income
Taxes        (70)          (80)         (70)          (70)    (70)

Net Profit = 700 - 130 - 80 -30 – 30 +10 – 70 = 370
2008         2009    2010    2011    2012

Sales        500          600     620     750     700
COGS         (100)        (100)   (110)   (130)   (130)
SG&A         (75)         (90)    (80)    (90)    (80)
Other        (25)         (30)    (30)    (30)    (30)
Operating
Costs
Interest     (20)         (30)    (30)    (30)    (30)
Expense
Interest     10           10      20      20      10
Income
Taxes        (70)         (80)    (70)    (70)    (70)

Gross Profit = 500 – 100 = 400
   Assess feasibility of a business or project
   Required by most investors and banks
   Set targets
   Scenario analysis
   Understanding of Business Life Cycle

   Industry Analysis

   FSA

   Marketing Research

   Educated Estimations
   Who are my customers?

   What are their spending habits?

   How much are they willing to pay for my products/services?

   What quantity of my product/service are they willing and able to

    purchase?
   Start with Sales
                               Division   Volume          Value
     Economic Environment?
                               A          100 units       10 EGP
     Competition in Market?   B          300 units       5 EGP

     Customer Demand?         C          500 units       1 EGP

     Past Performance?

     Volume vs. Value?                   A = 100 * 10 = 500
                                          B = 300 * 5 = 1500
     Capacity?                           C = 500 * 1 = 500
                                          Total Sales = 2500
    Continue with Costs
       COGS/COS

            ▪ Cost needed in producing product or rendering a service

       Selling & Distribution Costs

       General & Administrative Costs
3/26/2013              `     All Rights Reserved © 2013                 17
    Other/Special Factors that May Affect Costs
       Major macro issues that can increase costs
        ▪ Legal, regulatory, or insurance-related factors
       Commodity prices
        ▪ If dealing with commodities, fluctuation in price can harm business)
       FX rates
        ▪ If dealing with customers or companies abroad
       Labor environment
        ▪ Shortage of qualified labor can increase costs
       R&D

3/26/2013              `      All Rights Reserved © 2013                         18
Quarter 1 2010    Quarter 2 2010   Quarter 3 2010   Quarter 4 2010
        December 2009 –   March - May      June-August      September –
        February 2010                                       November
Sales   100,000           40,000           30,000           60,000
COGS    (20,000)          (15,000)         (15,000)         (15,000)
SGA     (15,000)          (10,000)         (10,000)         (25,000)


         What quarter in 2011, do you anticipate will
         have the greatest sales? Profit?
         What are possible explanations?
Quarter 1 2011    Quarter 2 2011   Quarter 3 2011   Quarter 4 2011
        December 2010 –   March - May      June-August      September –
        February 2011                                       November
Sales   40,000            35,000           25,000           35,000
COGS    (20,000)          (15,000)         (15,000)         (15,000)
SGA     (15,000)          (10,000)         (10,000)         (15,000)


         What trend do you notice when comparing
         data for 2010 with 2011?
         What explanation can you give for the
         difference between the 2 years?
   What other information would you gather to project
    Shariff Travel Sharm’s 2013 sales?
   What information would you gather to project costs?
    Hint: list all potential costs for this business, then
    think how you would project each cost.
   Manage your Cash
     Monitor inflows and outflows
     Trade Credit Terms (A/P and A/R)
   Focus on Sales and Margins
   Constantly Monitor Progress
3/26/2013   `   All Rights Reserved © 2013   23

Financial Statement Analysis & Projections

  • 1.
    Ashraf Heleka GOL Trainer 26 March, 2013 3/26/2013 ` All Rights Reserved © 2013 1
  • 2.
    Sales & Profitability  Asset Efficiency  Liquidity  Solvency & Financial Structure
  • 3.
    Set targets  Measure progress  Compare to peers or industry  Risk analysis/problem identification
  • 4.
    Accounting Knowledge  Business Life Cycle  Industry Analysis  Financial Ratios
  • 5.
    Start-Up Phase GrowthPhase Maturity Phase Decline Phase Sales Profits 0 Start-Up Growth Maturity Decline Focus Survival Build Client Base Sustainability Preservation Leader Entrepreneur Marketer Controller Asset Stripper
  • 6.
    Threat of Potential Entrants Bargaining Rivalry Bargaining Power of Among Power of Suppliers Competitors Buyers Threat of Substitutes
  • 7.
    Cyclical  Seasonal  High Operational Leverage  Differentiated  Commoditized 3/26/2013 ` All Rights Reserved © 2013 7
  • 8.
    Ratio Formula What it Measures? If Increases… Sales Growth Growth in sales from year to Selling more quantity; selling at year higher or more efficient price; Gross Profit Profitability in core Higher sales prices, cost Margin operations before overheads efficiencies (top-line) Operating Profitability in core Higher sales prices, cost Profit Margin operations including efficiencies, better operating overheads performance, changes in product mix Net Profit Profitability for shareholders Above + successful management Margin of the company of the business (bottom- line) Return on How much profit a company Increased bottom line Equity (ROE) generates with the money profitability, improved asset shareholders have invested. efficiency, and/or reduction in equity
  • 9.
    Ratio Formula What it Measures? If Increases… Working The amount of trading Giving longer credit Investment assets that are not terms; greater inventory financed by spontaneous levels (stock up, longer finance production period); paying suppliers in advance to get discounts A/R= 100 INV = 200 Working Investment = 100 + 200 – (50 +100) A/P = 50 = 150 A/E = 100
  • 10.
    2008 2009 2010 2011 2012 Sales 500 600 620 750 700 COGS (100) (100) (110) (130) (130) SG&A (75) (90) (80) (90) (80) Other (25) (30) (30) (30) (30) Operating Costs Interest (20) (30) (30) (30) (30) Expense Interest 10 10 20 20 10 Income Taxes (70) (80) (70) (70) (70)
  • 11.
    2008 2009 2010 2011 2012 Sales 500 600 620 750 700 COGS (100) (100) (110) (130) (130) SG&A (75) (90) (80) (90) (80) Other (25) (30) (30) (30) (30) Operating Costs Interest (20) (30) (30) (30) (30) Expense Interest 10 10 20 20 10 Income Taxes (70) (80) (70) (70) (70) Net Profit = 700 - 130 - 80 -30 – 30 +10 – 70 = 370
  • 12.
    2008 2009 2010 2011 2012 Sales 500 600 620 750 700 COGS (100) (100) (110) (130) (130) SG&A (75) (90) (80) (90) (80) Other (25) (30) (30) (30) (30) Operating Costs Interest (20) (30) (30) (30) (30) Expense Interest 10 10 20 20 10 Income Taxes (70) (80) (70) (70) (70) Gross Profit = 500 – 100 = 400
  • 13.
    Assess feasibility of a business or project  Required by most investors and banks  Set targets  Scenario analysis
  • 14.
    Understanding of Business Life Cycle  Industry Analysis  FSA  Marketing Research  Educated Estimations
  • 15.
    Who are my customers?  What are their spending habits?  How much are they willing to pay for my products/services?  What quantity of my product/service are they willing and able to purchase?
  • 16.
    Start with Sales Division Volume Value  Economic Environment? A 100 units 10 EGP  Competition in Market? B 300 units 5 EGP  Customer Demand? C 500 units 1 EGP  Past Performance?  Volume vs. Value? A = 100 * 10 = 500 B = 300 * 5 = 1500  Capacity? C = 500 * 1 = 500 Total Sales = 2500
  • 17.
    Continue with Costs  COGS/COS ▪ Cost needed in producing product or rendering a service  Selling & Distribution Costs  General & Administrative Costs 3/26/2013 ` All Rights Reserved © 2013 17
  • 18.
    Other/Special Factors that May Affect Costs  Major macro issues that can increase costs ▪ Legal, regulatory, or insurance-related factors  Commodity prices ▪ If dealing with commodities, fluctuation in price can harm business)  FX rates ▪ If dealing with customers or companies abroad  Labor environment ▪ Shortage of qualified labor can increase costs  R&D 3/26/2013 ` All Rights Reserved © 2013 18
  • 19.
    Quarter 1 2010 Quarter 2 2010 Quarter 3 2010 Quarter 4 2010 December 2009 – March - May June-August September – February 2010 November Sales 100,000 40,000 30,000 60,000 COGS (20,000) (15,000) (15,000) (15,000) SGA (15,000) (10,000) (10,000) (25,000) What quarter in 2011, do you anticipate will have the greatest sales? Profit? What are possible explanations?
  • 20.
    Quarter 1 2011 Quarter 2 2011 Quarter 3 2011 Quarter 4 2011 December 2010 – March - May June-August September – February 2011 November Sales 40,000 35,000 25,000 35,000 COGS (20,000) (15,000) (15,000) (15,000) SGA (15,000) (10,000) (10,000) (15,000) What trend do you notice when comparing data for 2010 with 2011? What explanation can you give for the difference between the 2 years?
  • 21.
    What other information would you gather to project Shariff Travel Sharm’s 2013 sales?  What information would you gather to project costs? Hint: list all potential costs for this business, then think how you would project each cost.
  • 22.
    Manage your Cash  Monitor inflows and outflows  Trade Credit Terms (A/P and A/R)  Focus on Sales and Margins  Constantly Monitor Progress
  • 23.
    3/26/2013 ` All Rights Reserved © 2013 23

Editor's Notes

  • #6 Decline: focus: orderly declineLeader: asset stripper (decline in management, layoffs, reduce asset levels)A
  • #17 Divisional data product, function/division, geographic region/country/county/province