Ferris analyzed its production capacity, material costs, labor costs, and performance over 8 rounds of the CAPSIM simulation. Key points:
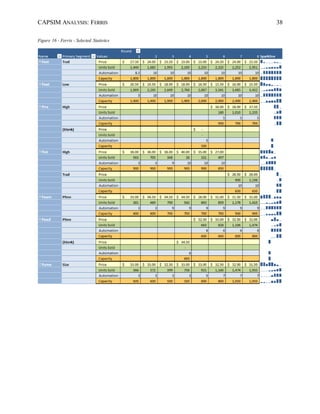
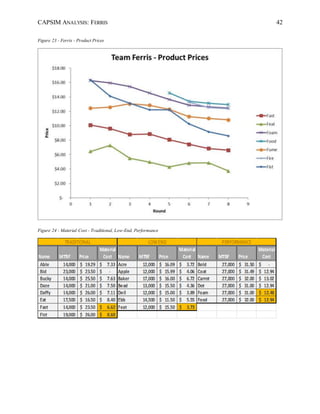
1) Ferris focused on optimizing production capacity to meet forecasted demand in each segment. Capacity for the low-end product Feat gradually increased from 1400 to 2400 units.
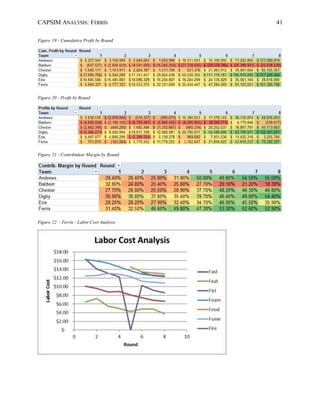
2) Material and labor costs were analyzed. Automation was increased for products to reduce variable costs.
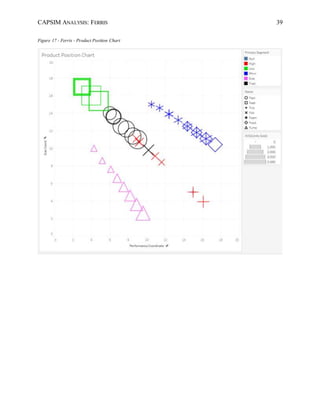
3) Ferris transitioned its high-end product Fist to the traditional segment in round 7 due to weak performance.
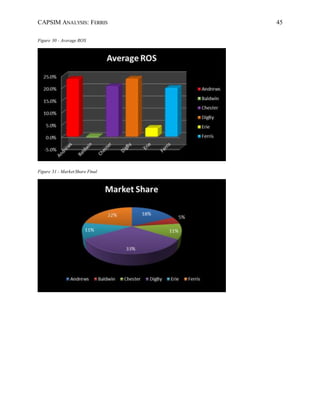
4) Overall, Ferris sought to diversify its risk and gain market share through a broad differentiation strategy focused on production efficiency.

![CAPSIM ANALYSIS: FERRIS 16
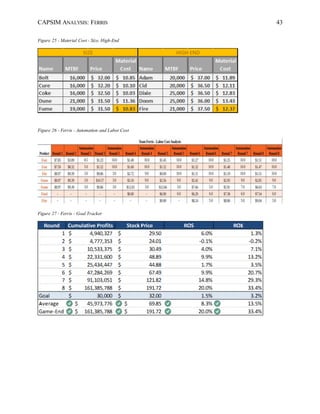
Material Cost Analysis
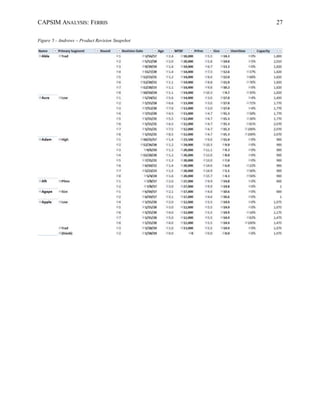
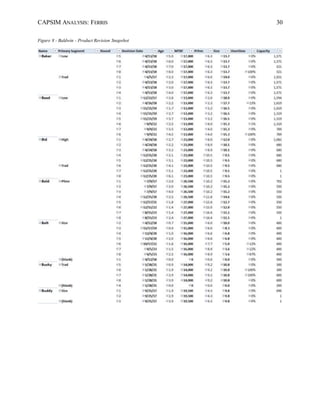
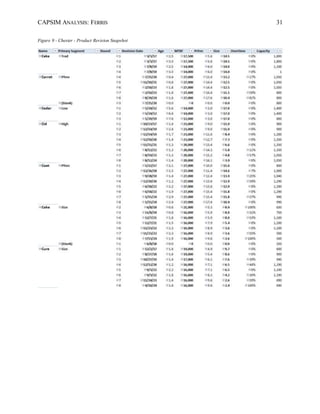
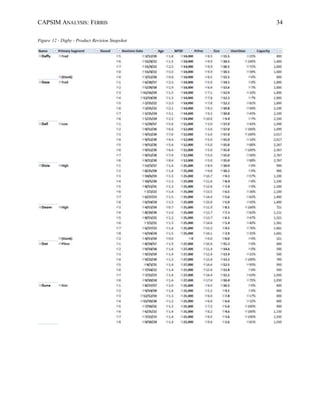
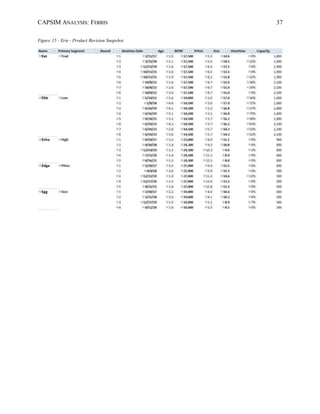
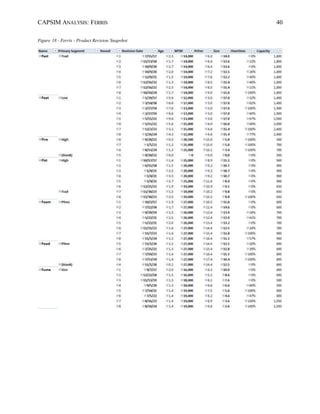
For this section, please make reference to Figure 18 - Ferris - Product Revision Snapshot;
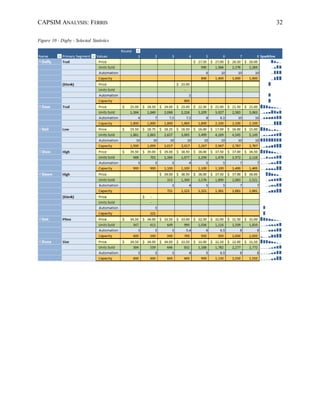
Figure 24 - Material Cost - Traditional, Low-End, Performance; and Figure 25 - Material Cost -
Size, High-End.
Ferris had consistently invested in R&D to improve quality and reduce material costs,
which could provide them higher profit margins and serve as a competitive advantage over its
competitors. It invested a total of $32,655,000 through the rounds 1-8 for an average of
$4,082,000 per round. Most of the material costs were driven from the performance segment,
which had more emphasis laid on MTBF (Mean Time Before Failure) of 43%. Performance
products Foam and Food maintained the highest MTBF of all products, 27,000, over the course
of the simulation. This level of MTBF was selected because quality and performance were of key
interest to the performance buying segment. MTBF was also important to size and high-end
segments, where MTBFs of 21,000 and 19,000 were deployed – figures at the high end of each
segment’s respective acceptable range. Low-end and traditional segment products place little
importance on MTBF, so lower material cost of quality was generated for these segments.
Given that there are two products introduced performance segments (Foam and Food)
with emphasis on reliability, Ferris needed to reduce the material costs considerably to receive
higher margins. From Round 5, Ferris invested in TQM initiatives such as CCE (Concurrent
Engineering) /6 Sigma Training, UNEP Green Program, Vendor/JIT (Just in Time [Inventory]),
Vendor/JIT (Just in Time [Inventory]), and GEMI TQEM Sustainability to reduce the material
costs. It invested $4,000 total ($1,500 in Round 5, $1,500 in Round 6, and $1,000 in Round 7)
which reduced total material costs by 11.8% by the end of Round 8.](https://image.slidesharecdn.com/349521c8-32d3-47ae-9c5a-295ede42b21e-170117204447/85/CAPSIM-Final-Paper_FINAL-16-320.jpg)


![Baldwin[2][1]](https://cdn.slidesharecdn.com/ss_thumbnails/baldwin21-120806215951-phpapp02-thumbnail.jpg?width=640&height=640&fit=bounds)


