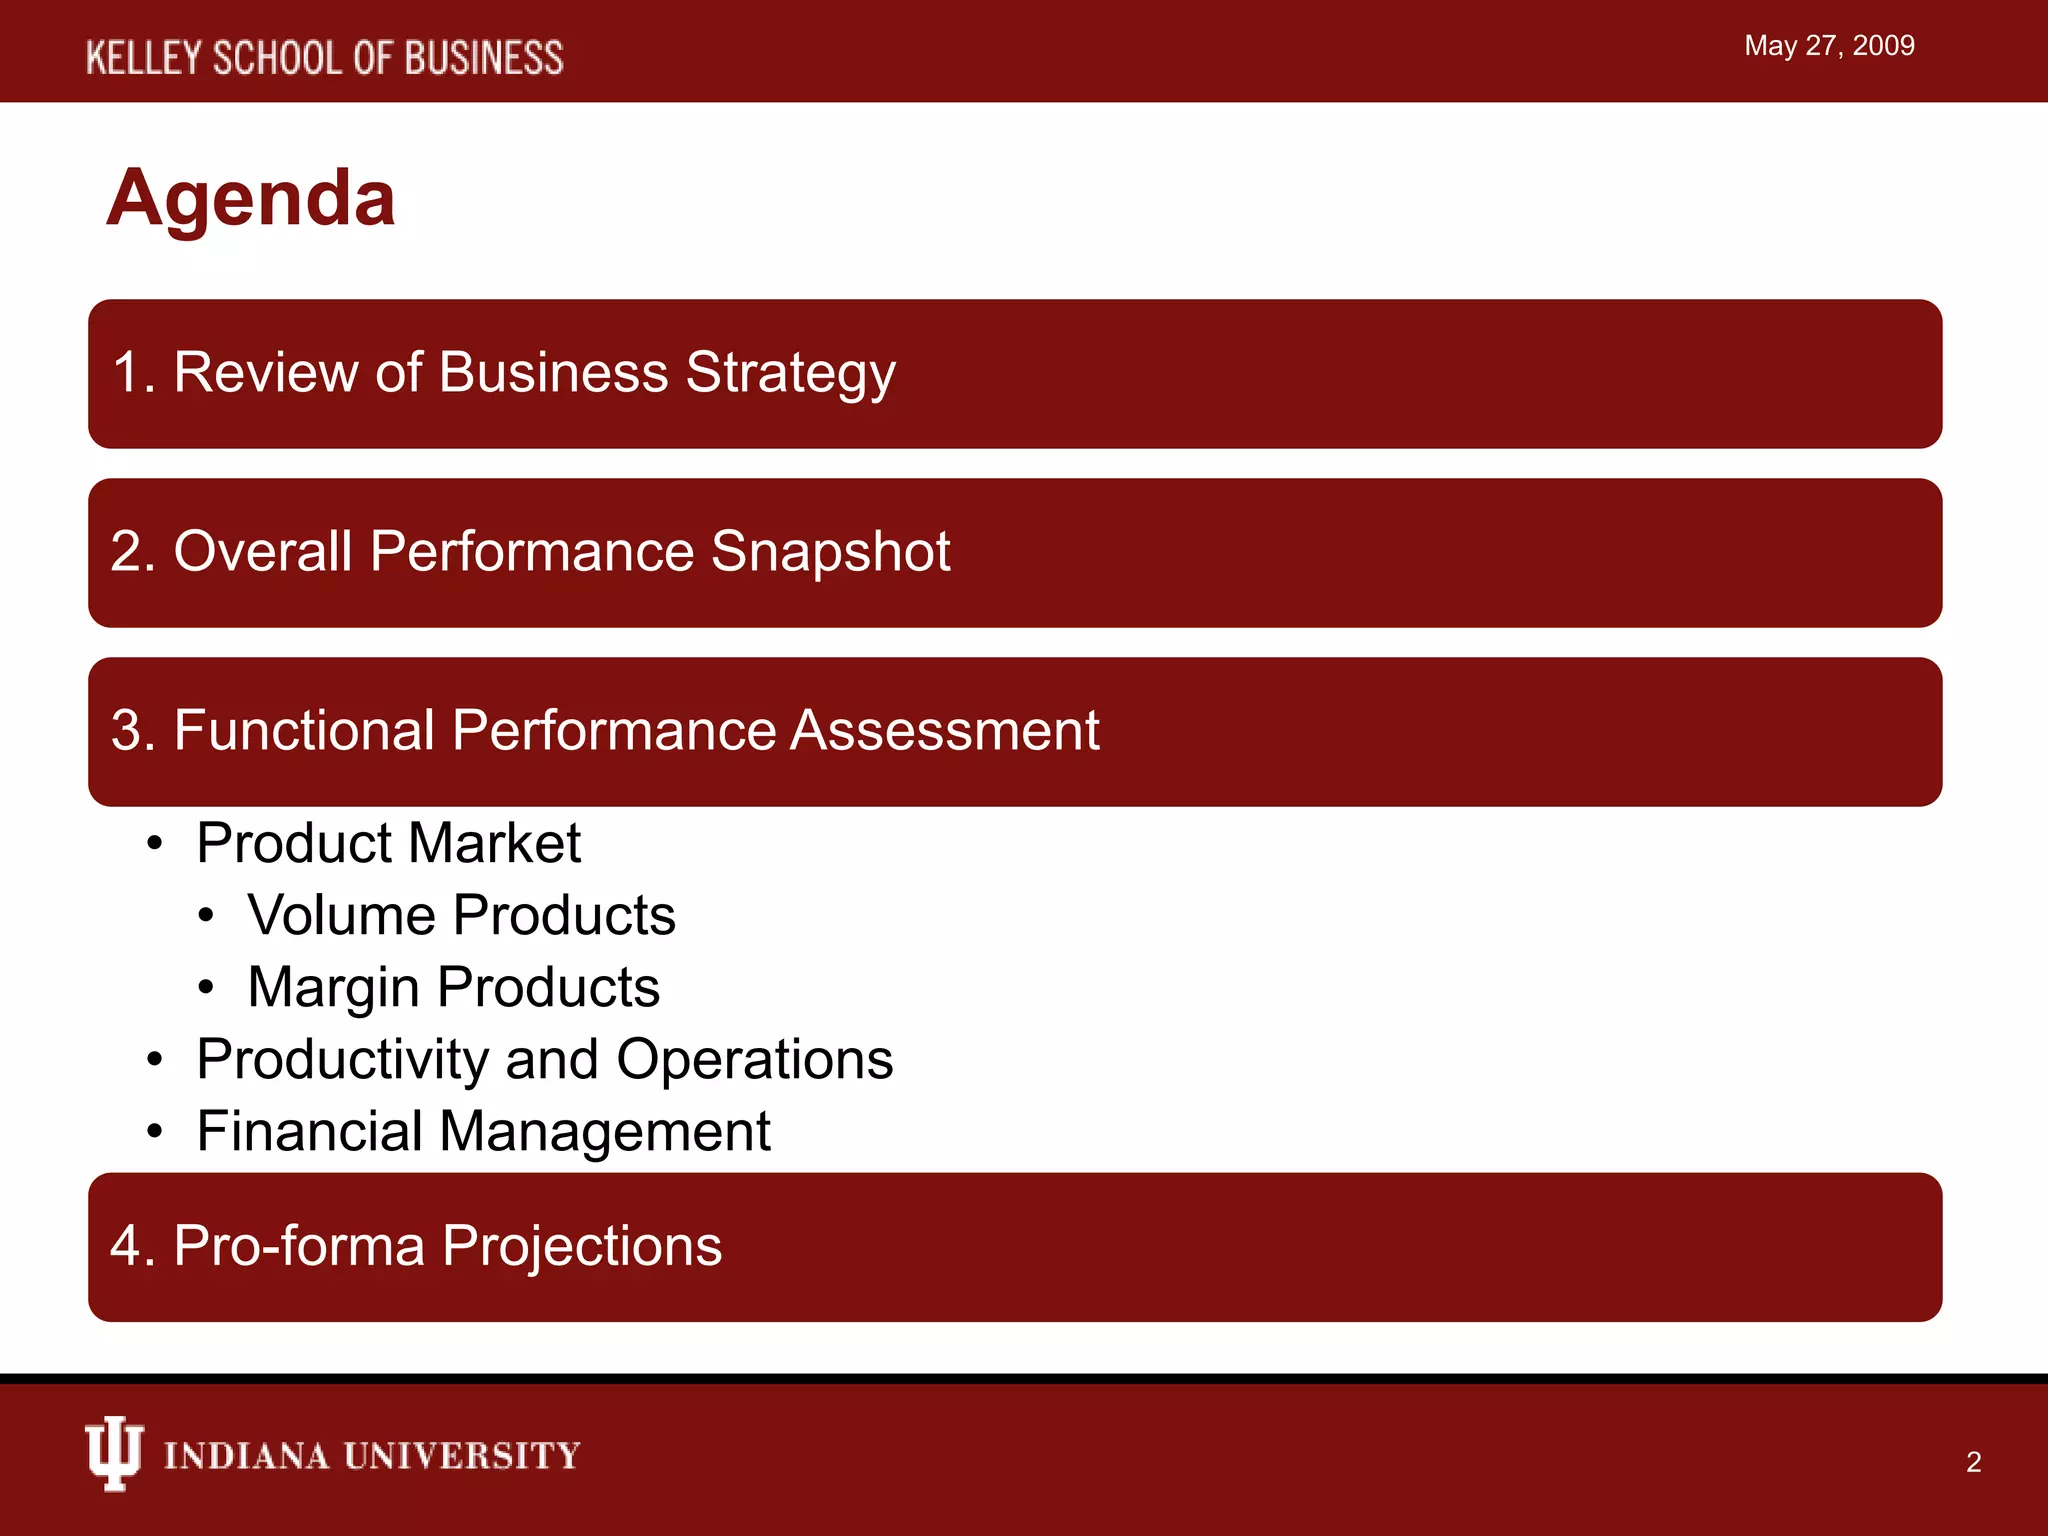
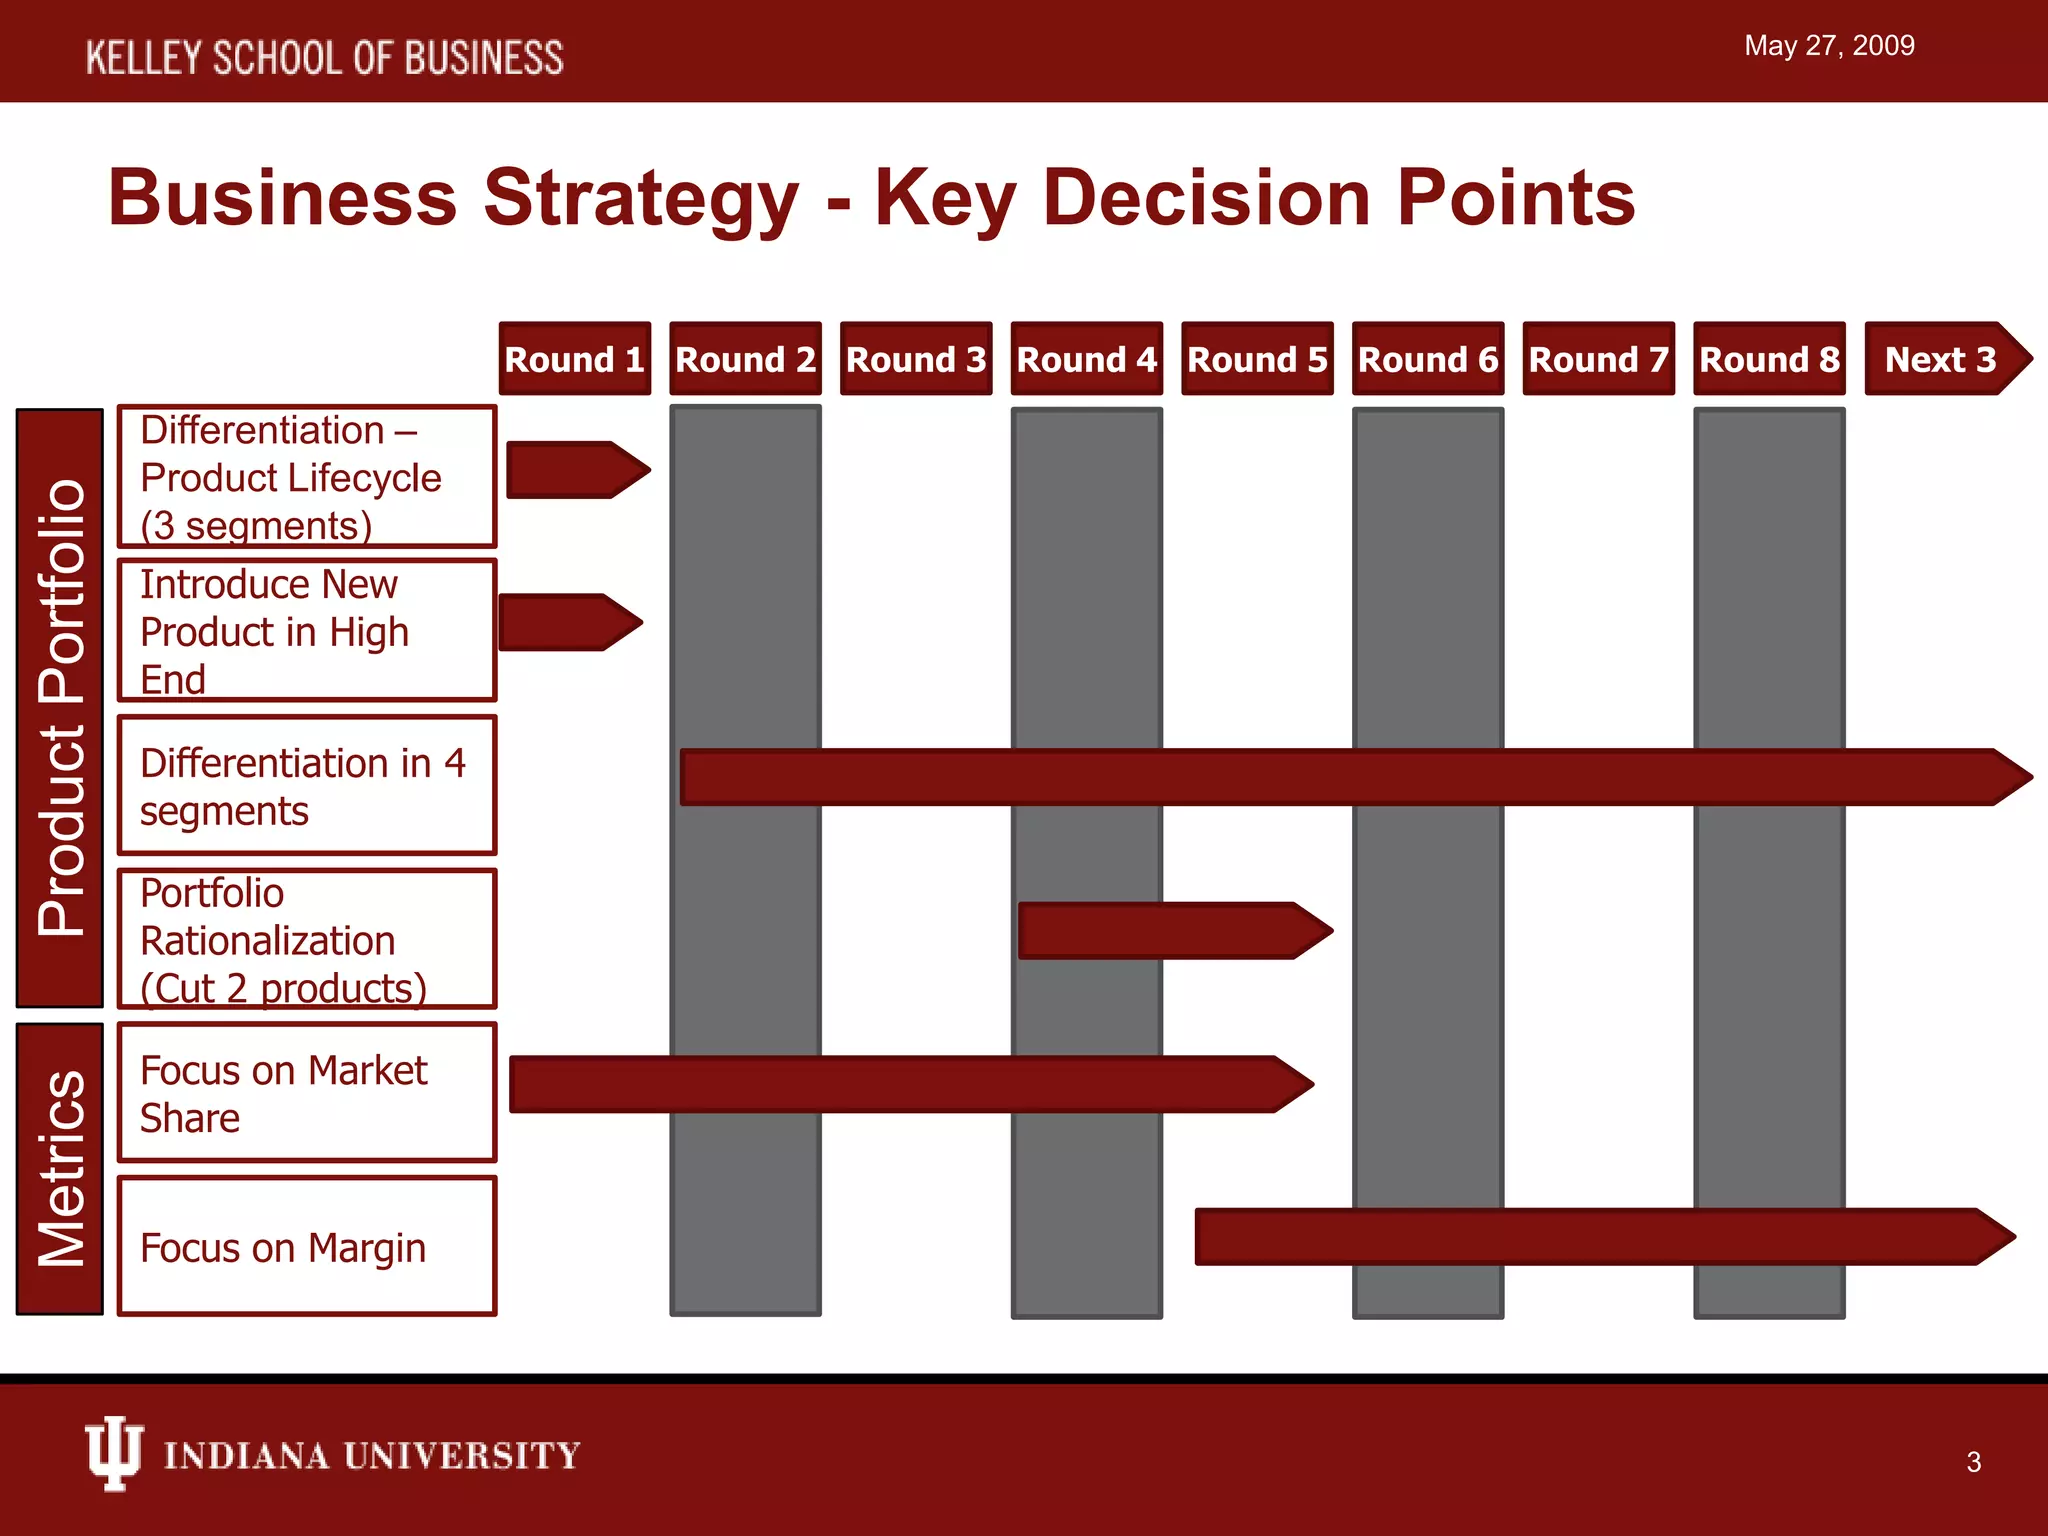
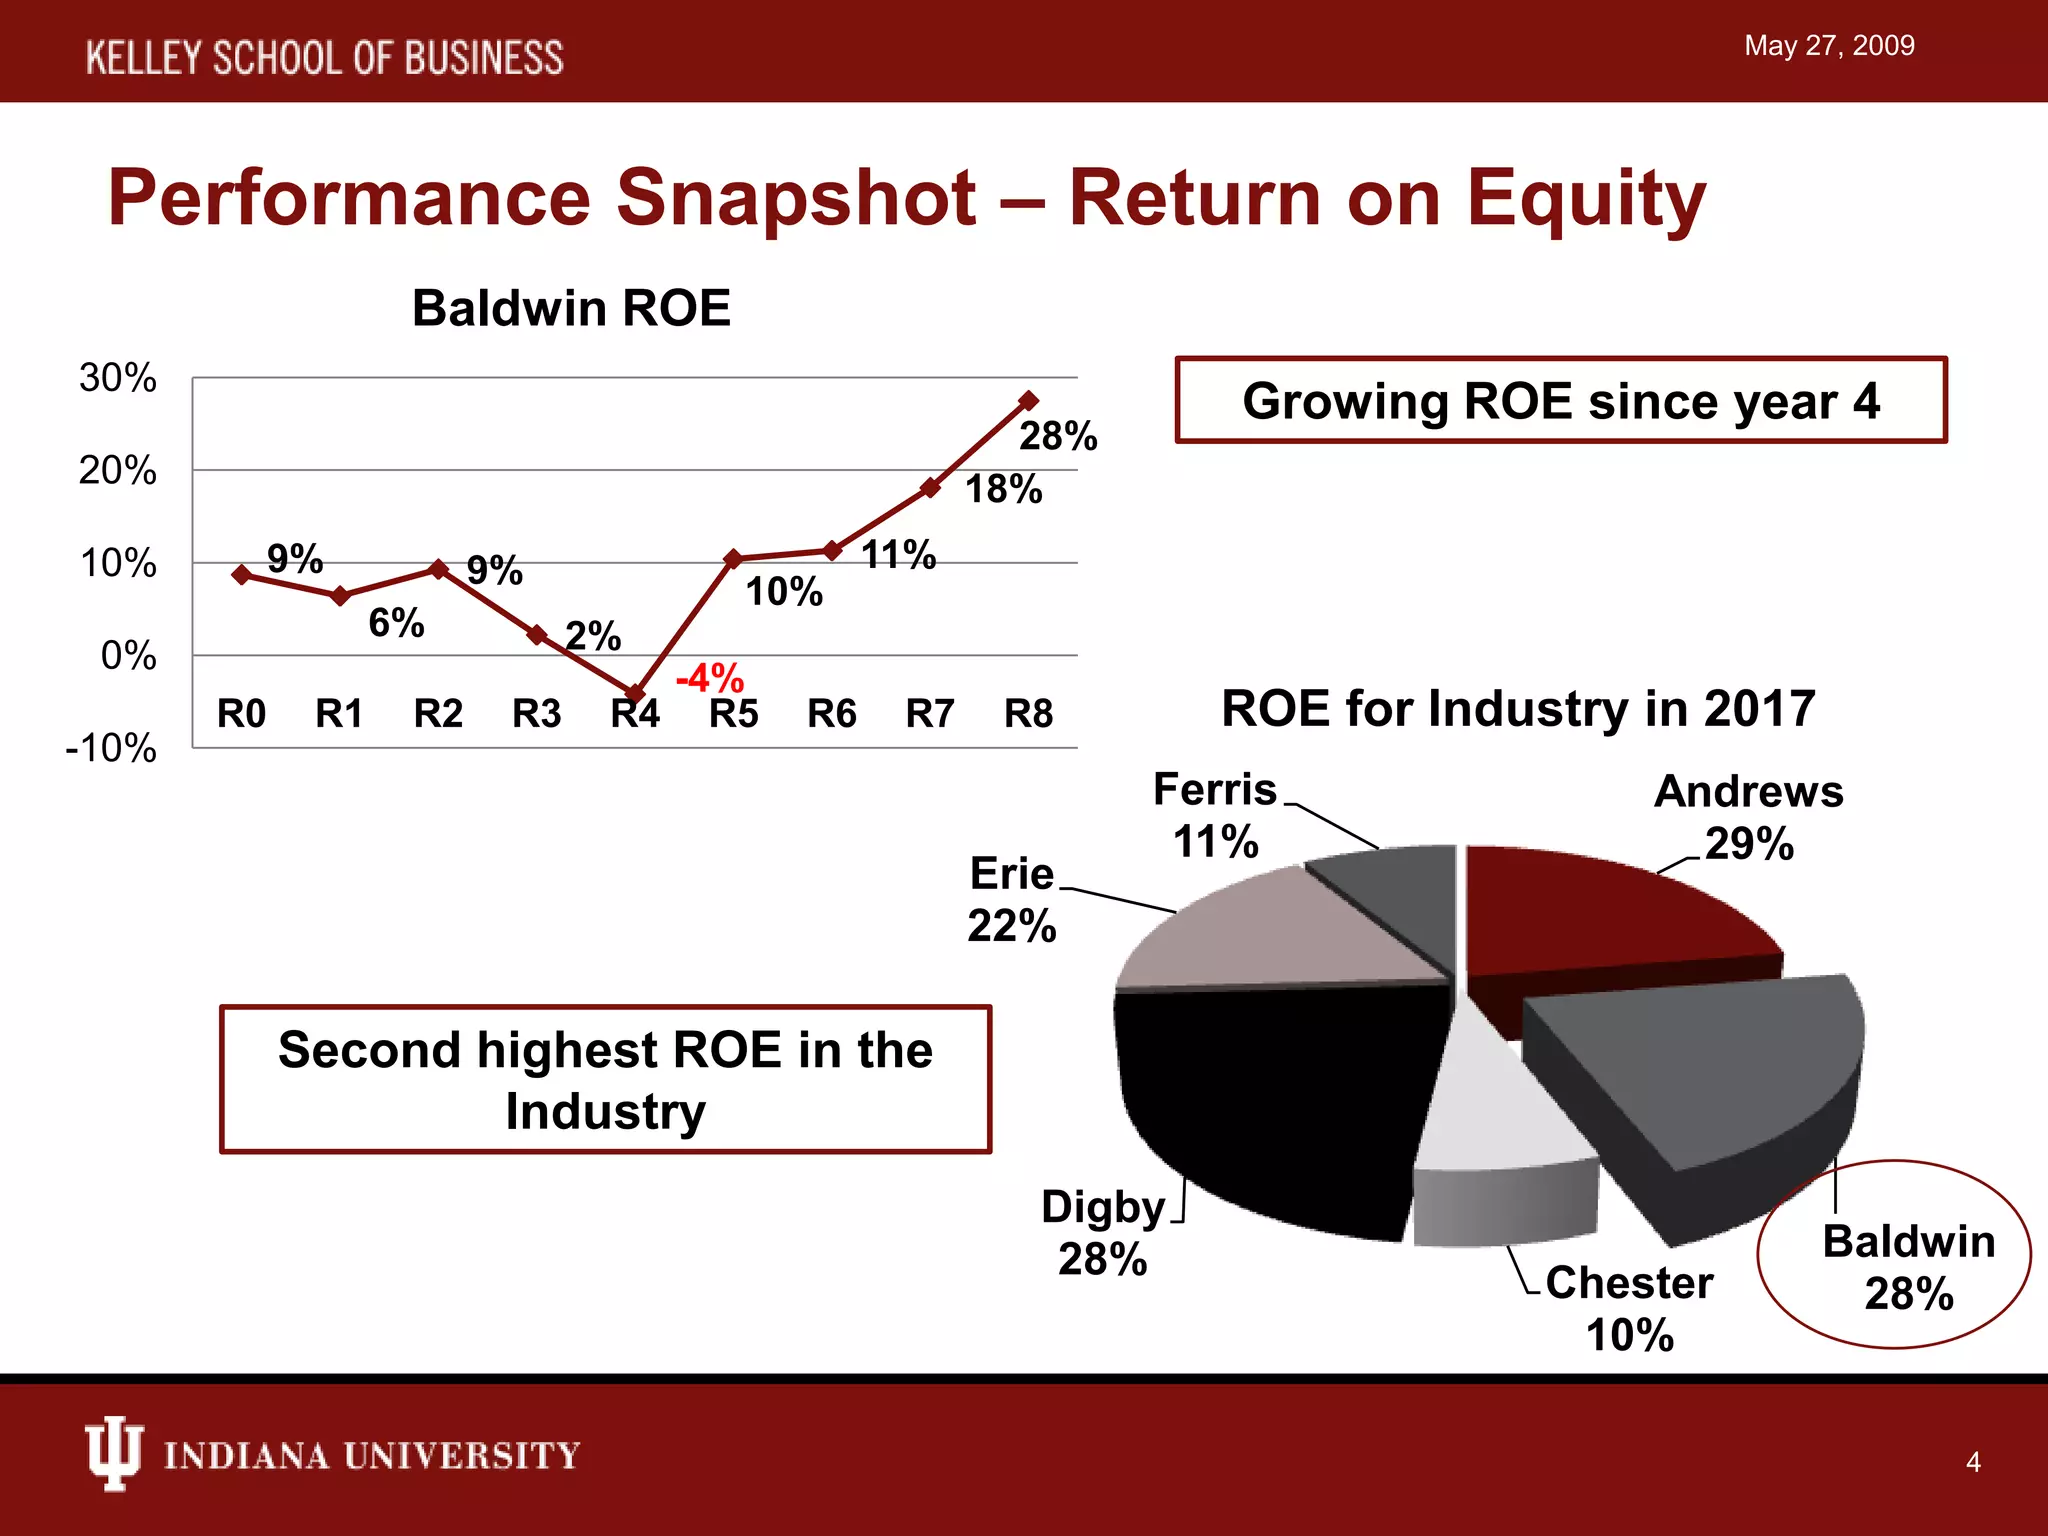
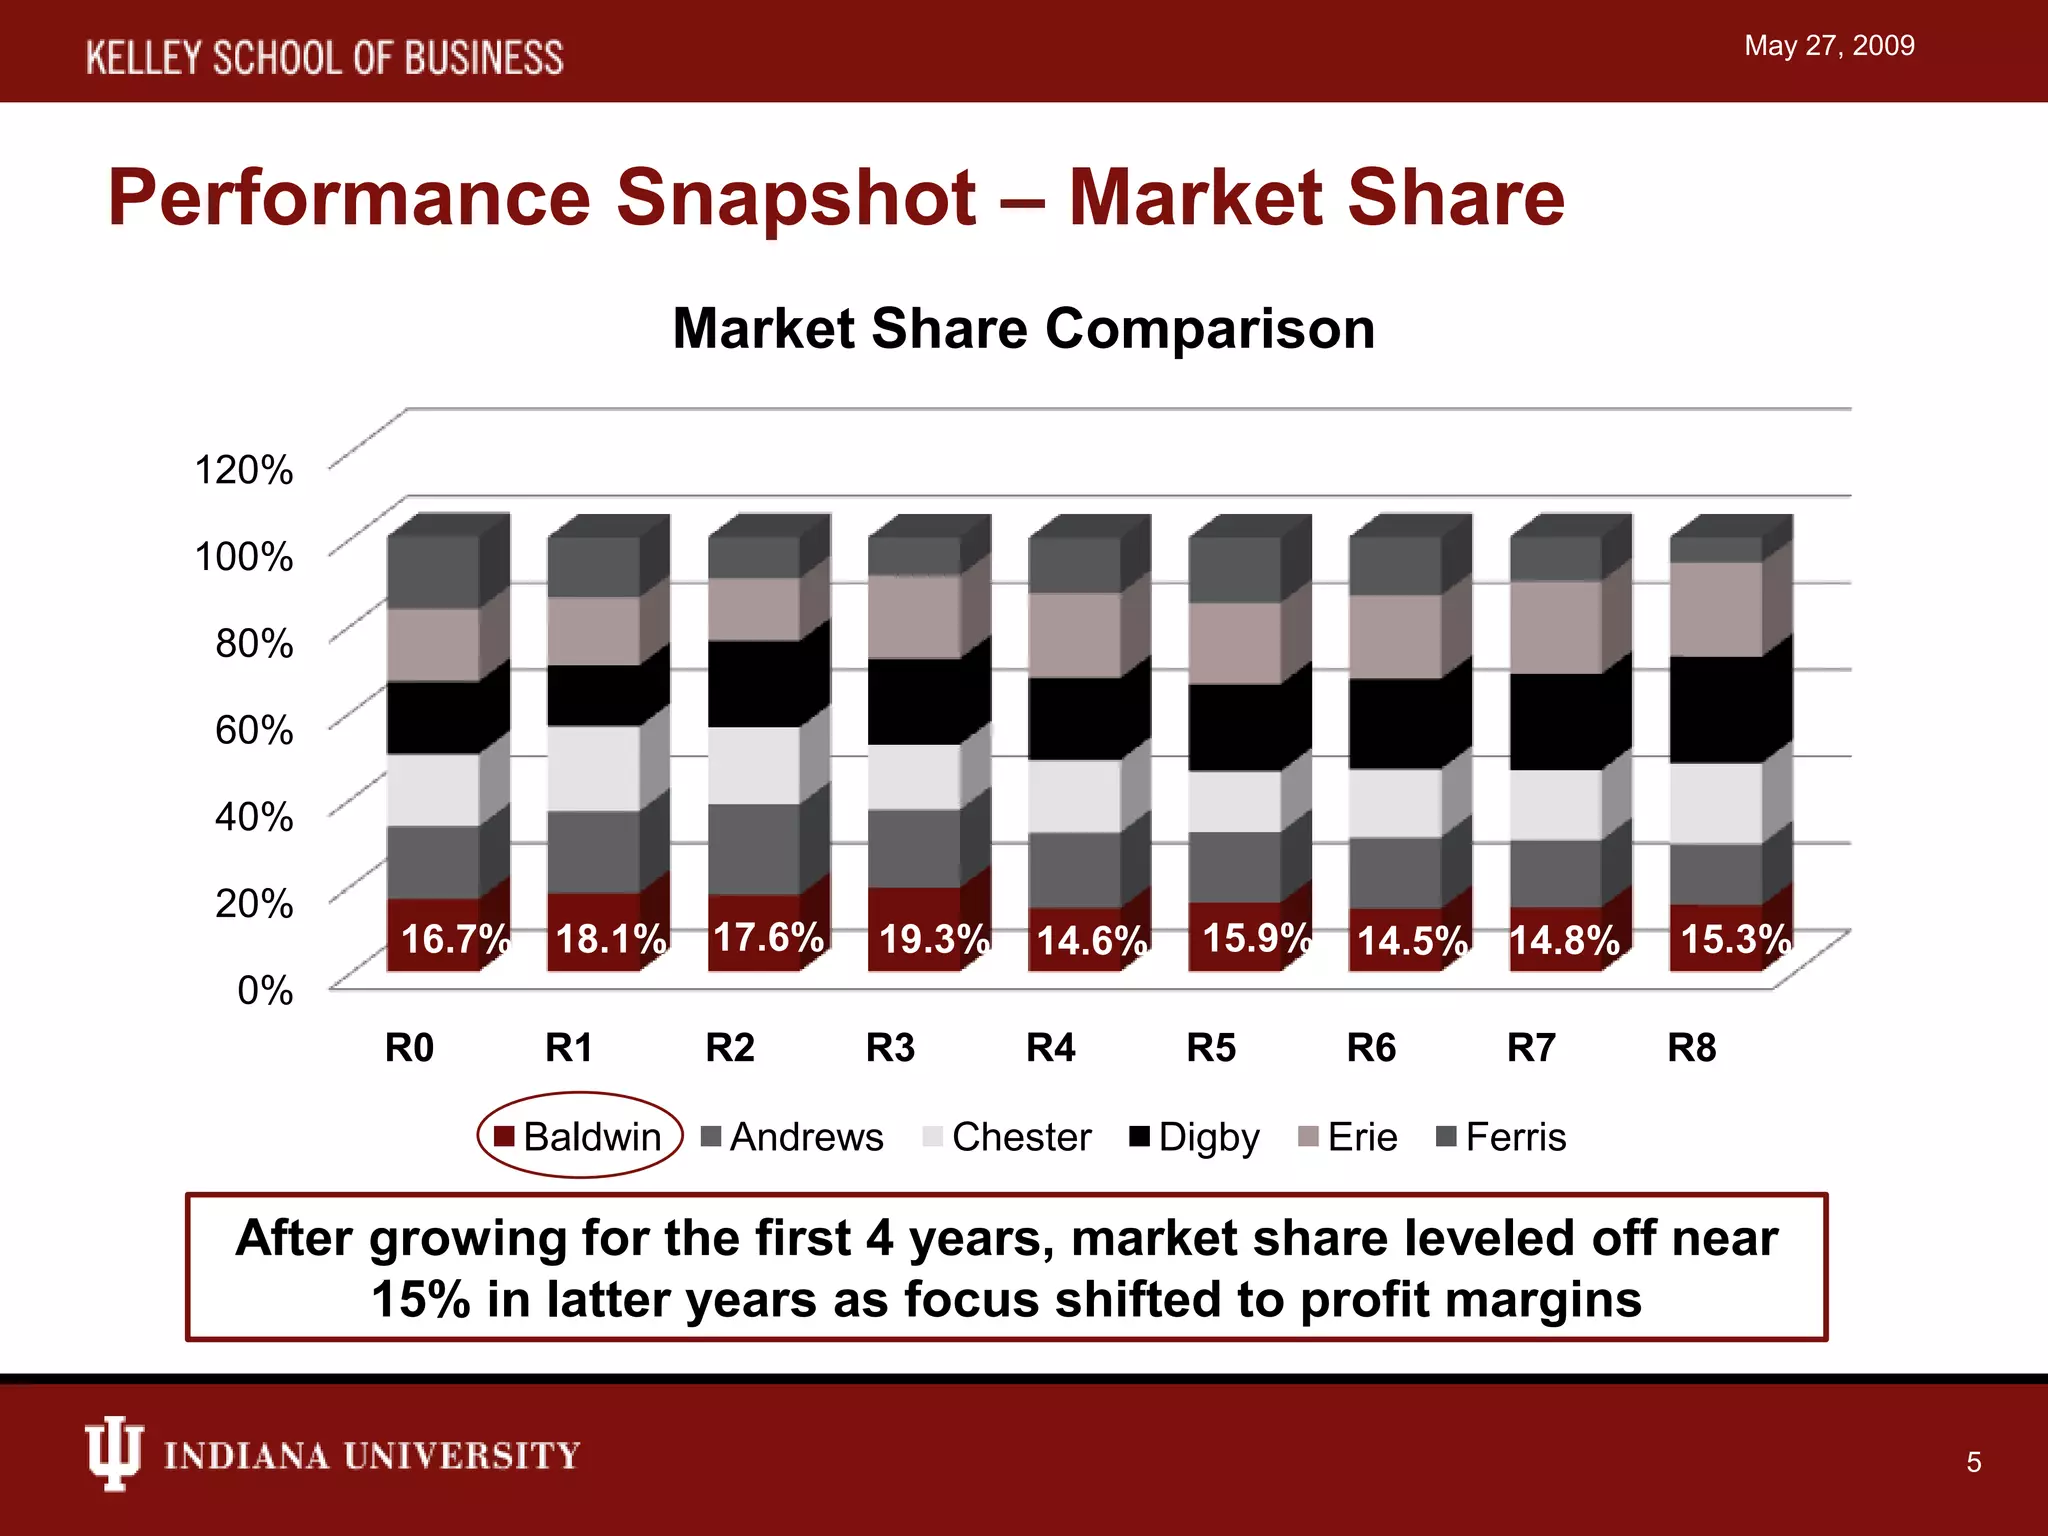
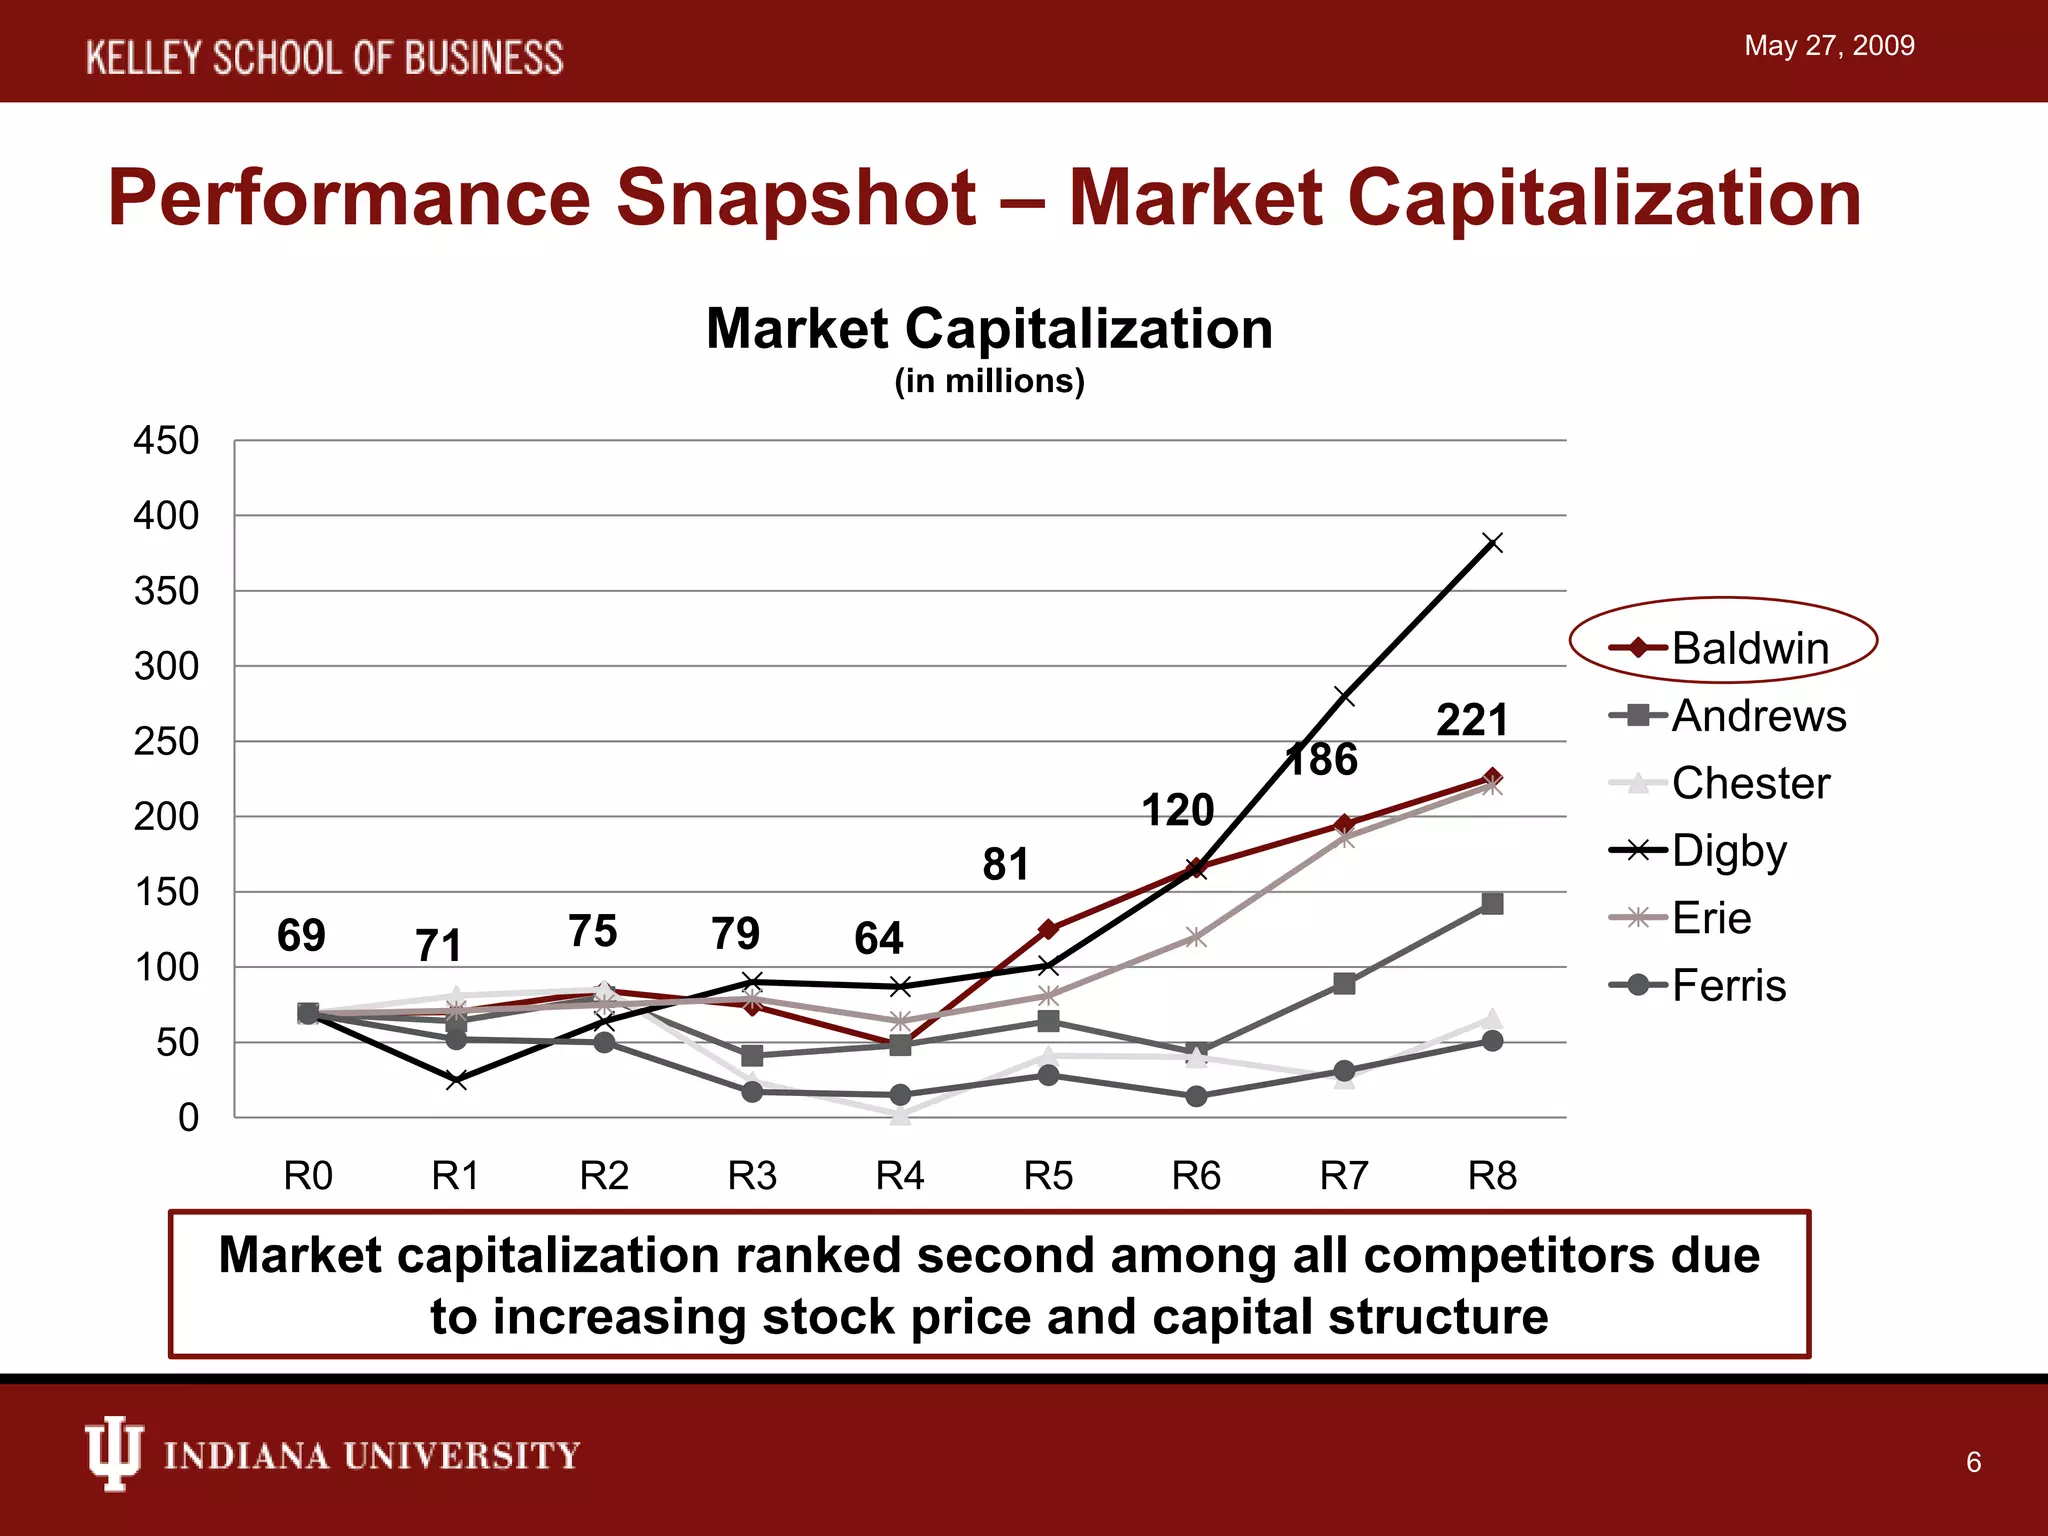
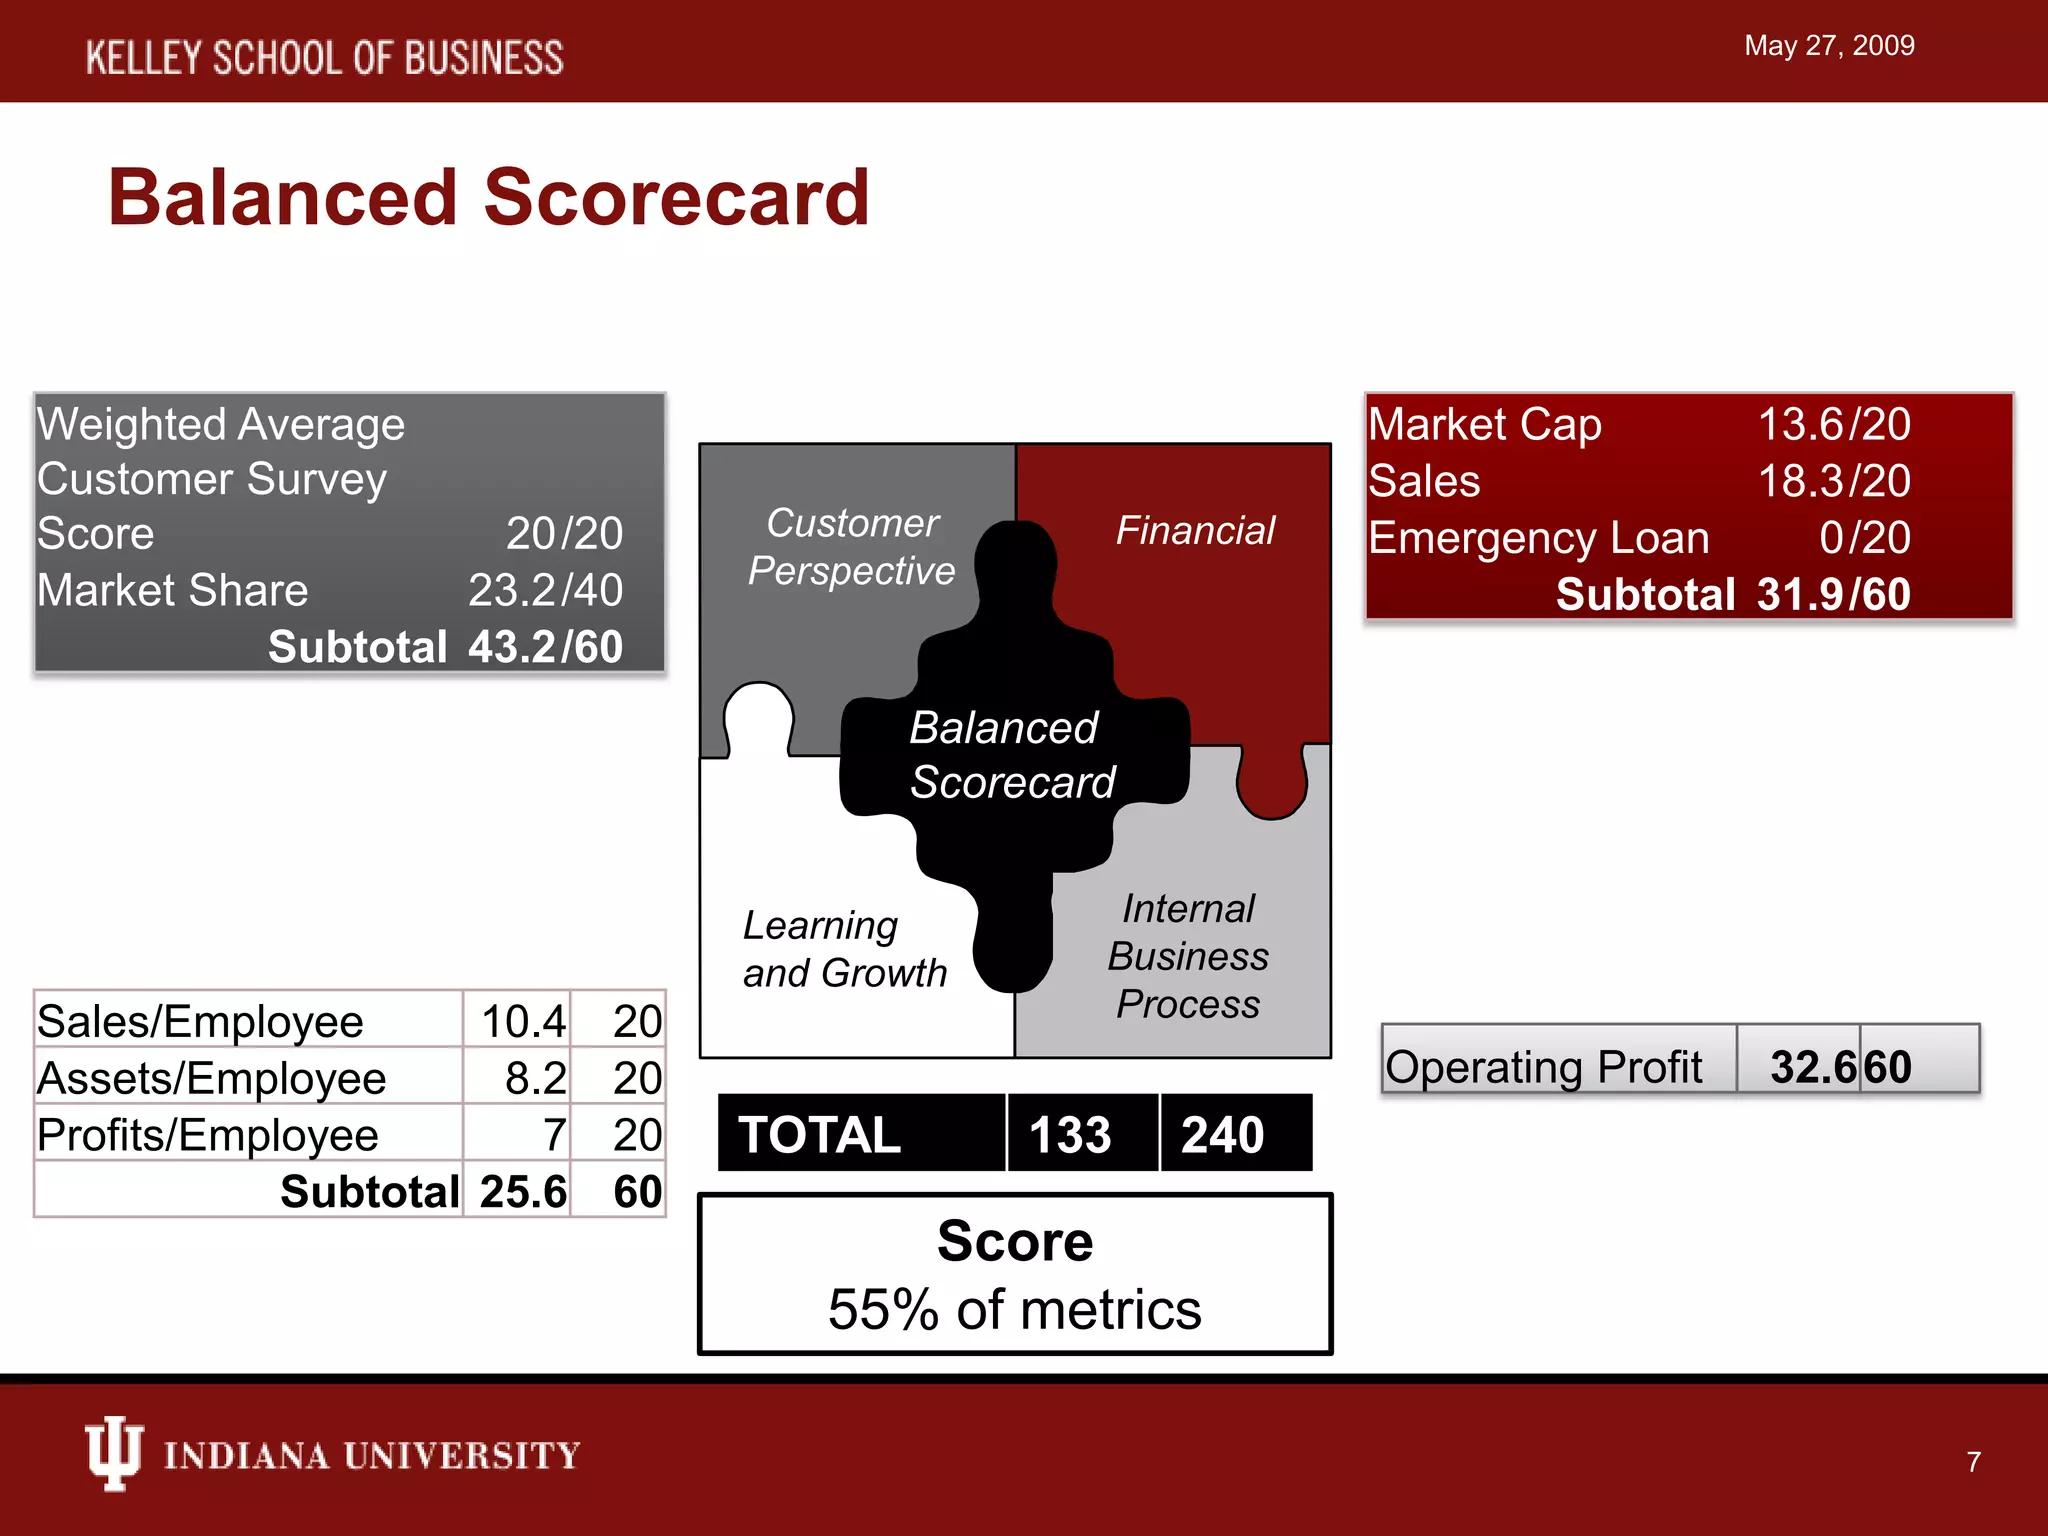
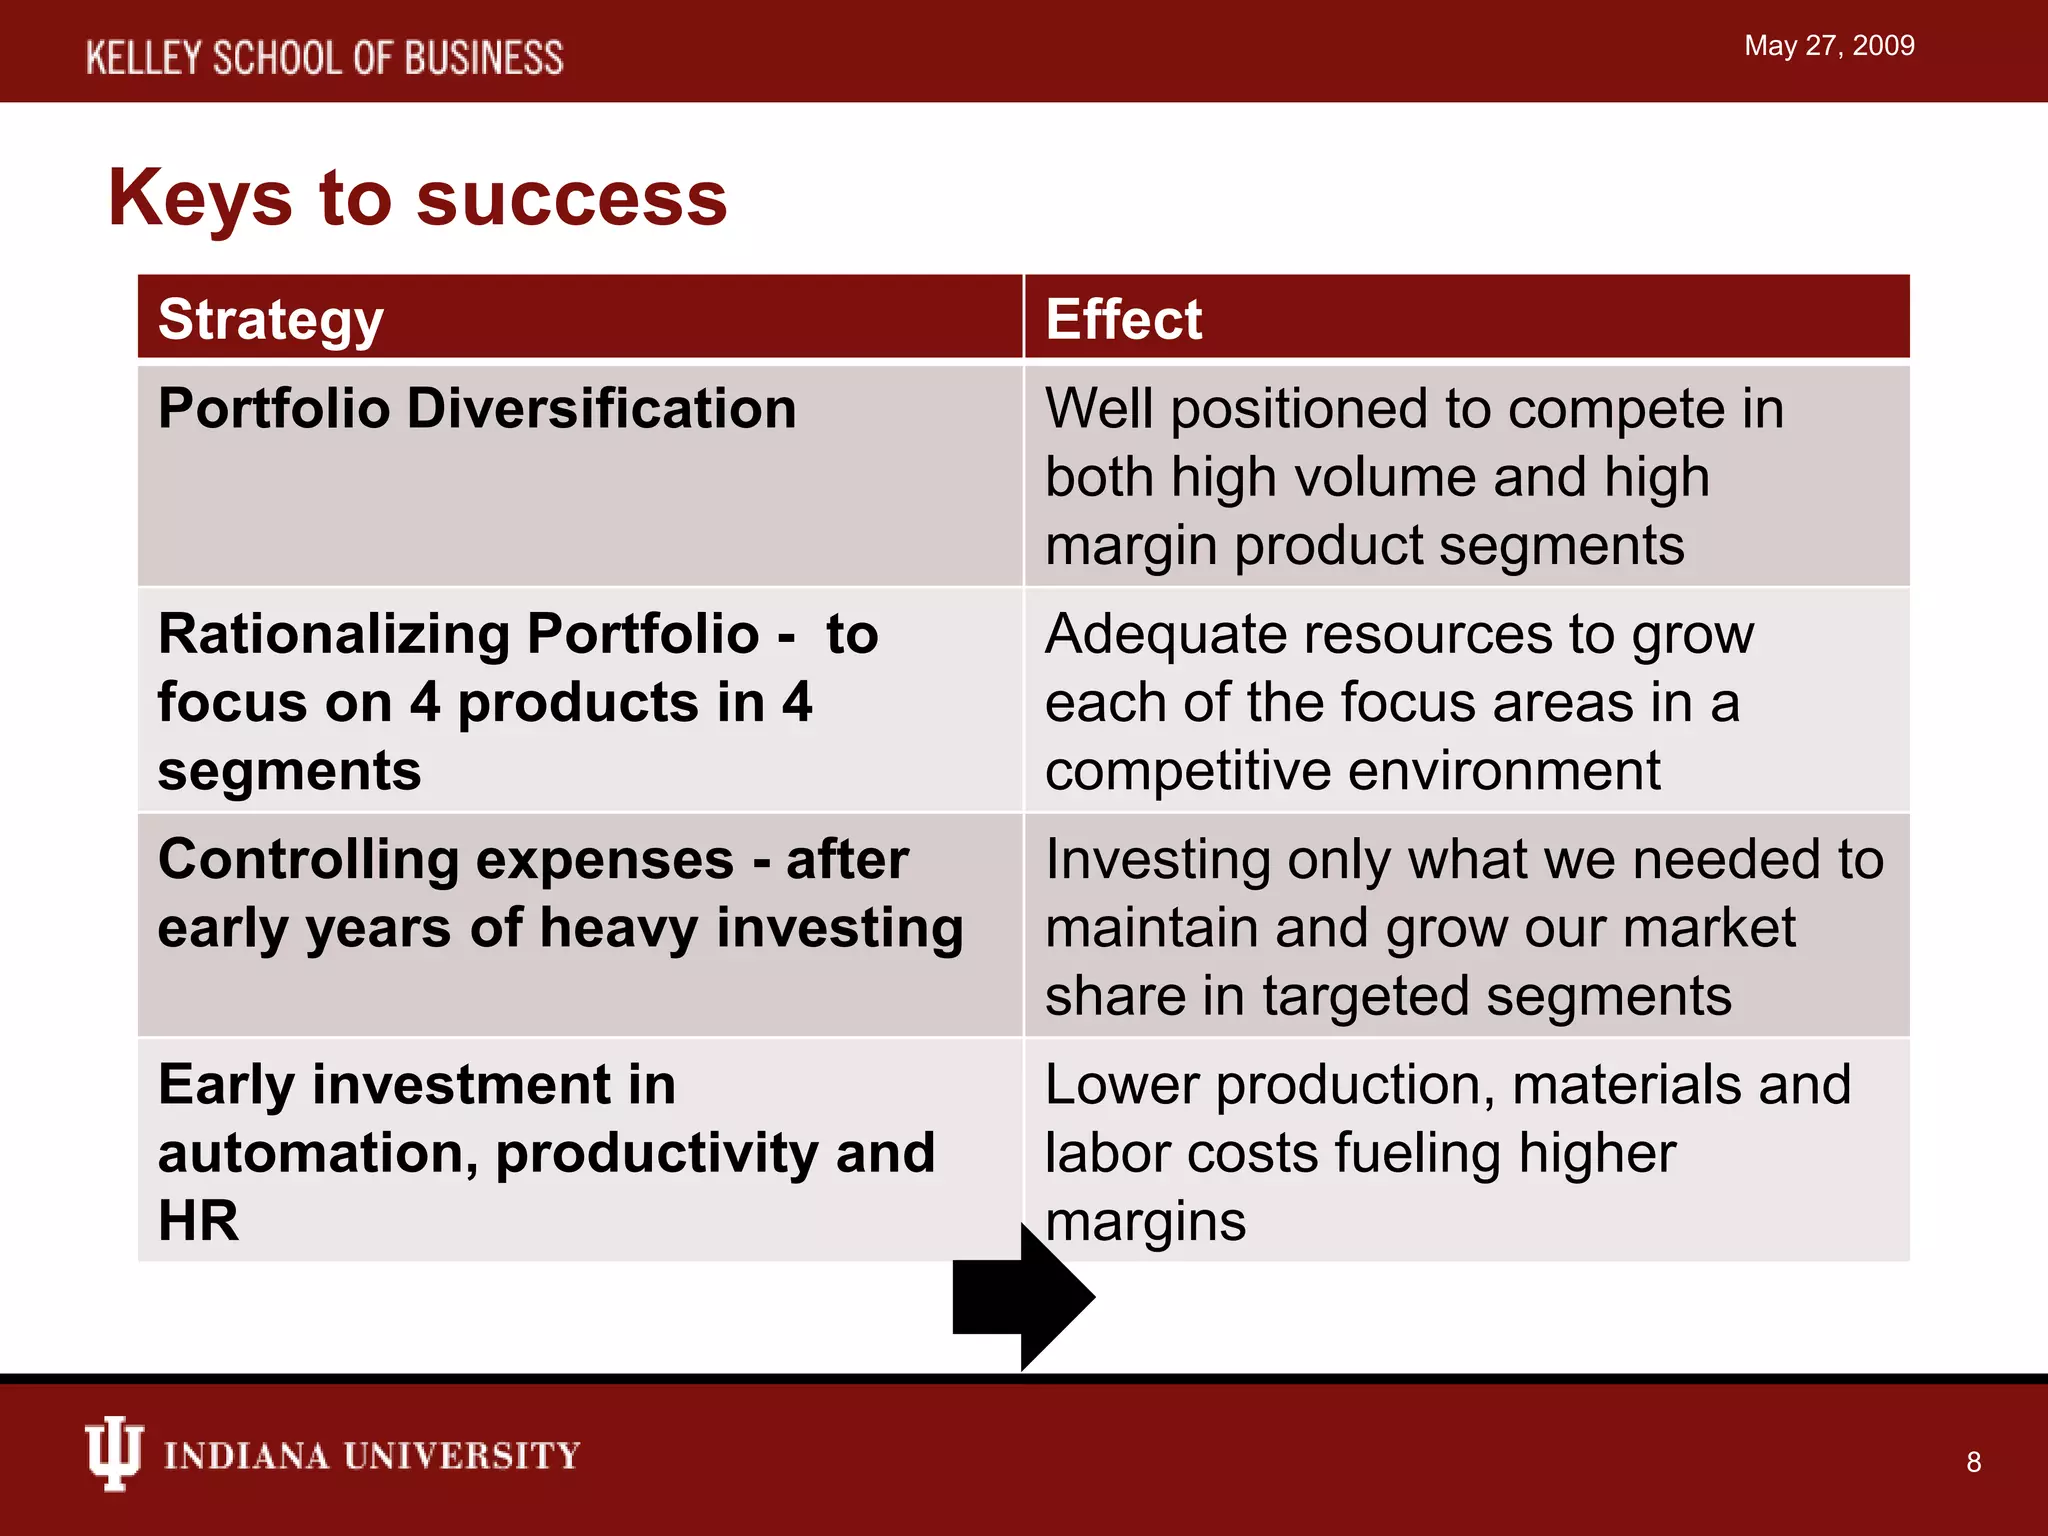
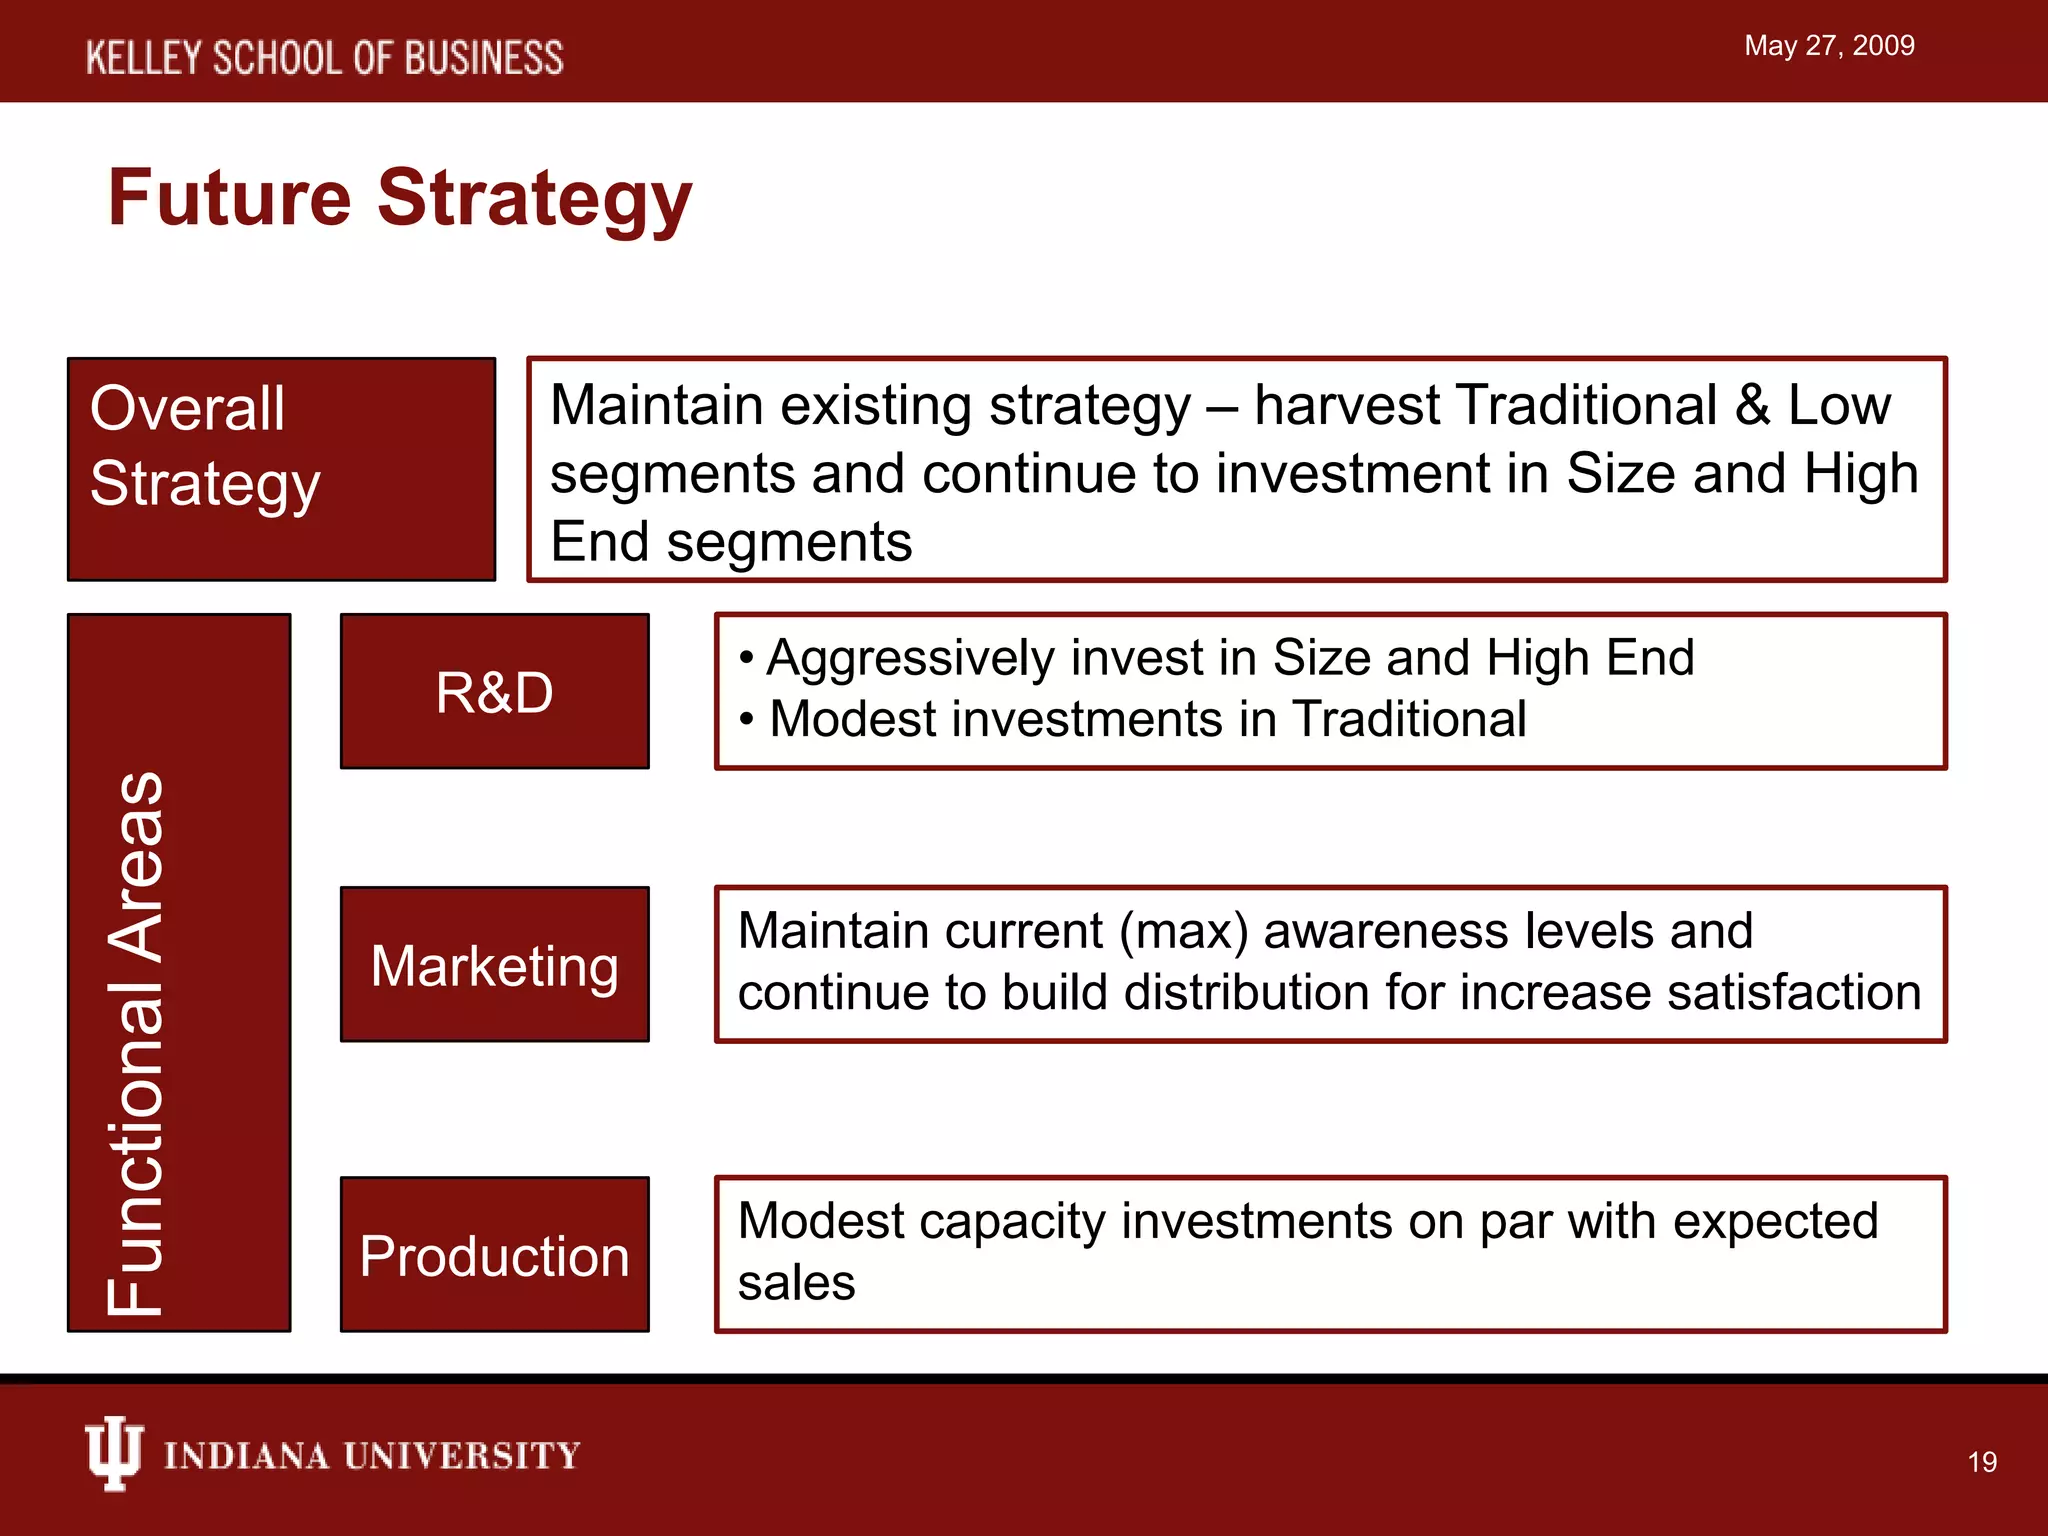
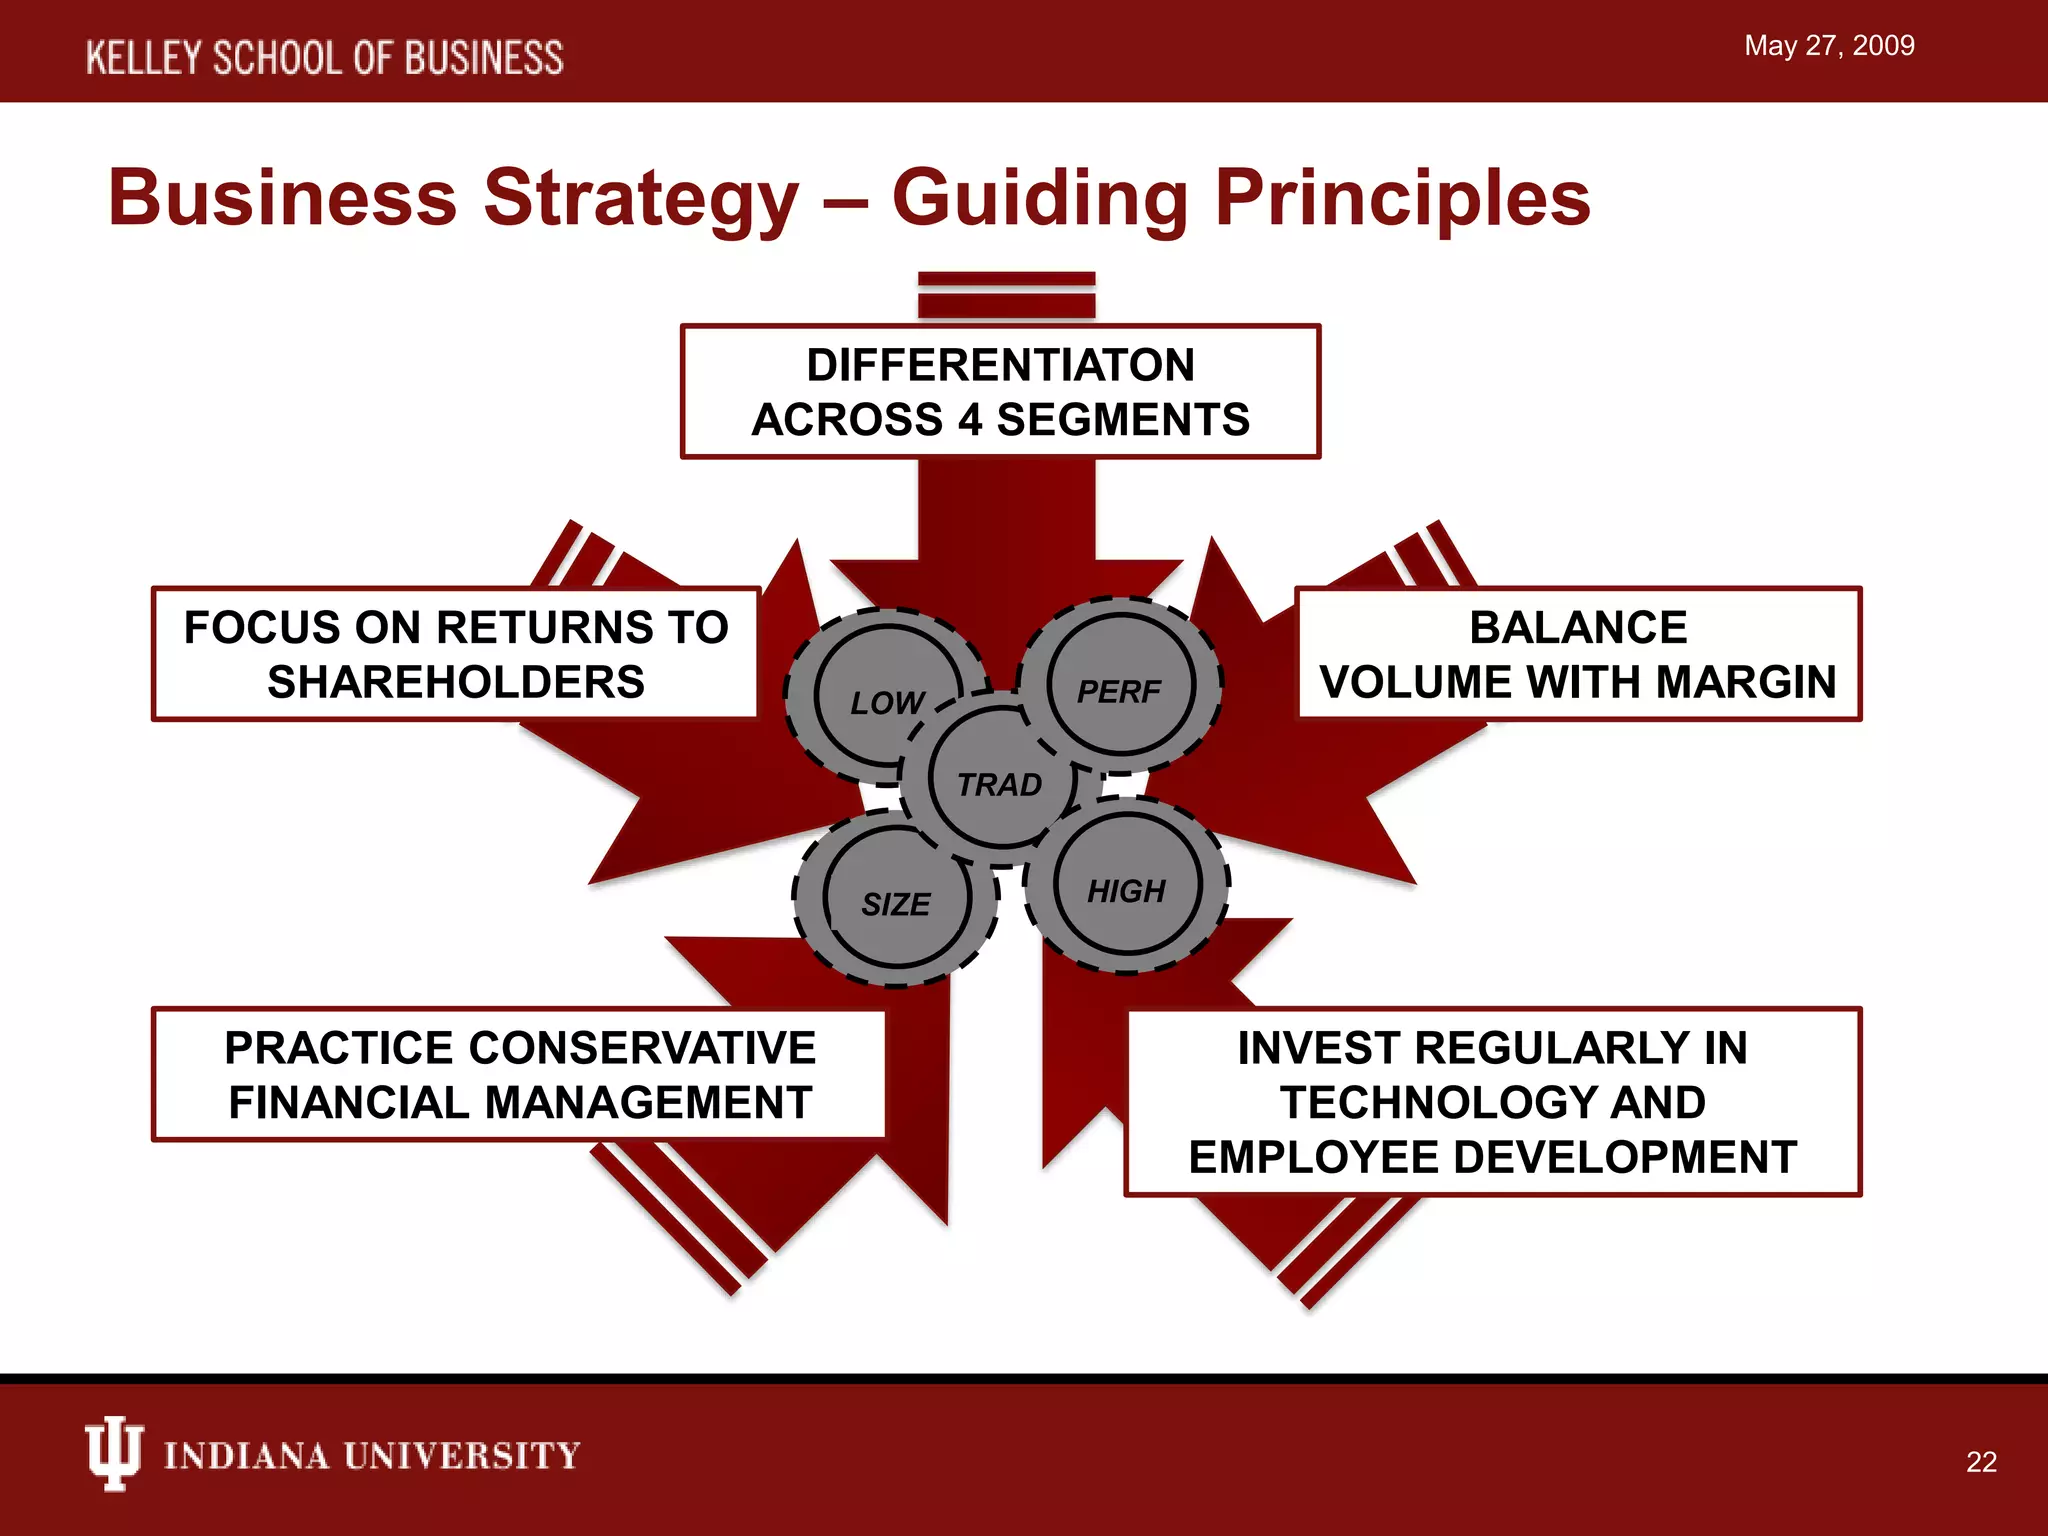
This is the presentation from the capstone simulation competition conducted at Kelley School of Business towards the completion of our MBA. The simulation involved decision on various business functions including Marketing, Operations, Finance and Investor relations. We worked in a team of 5-6 students to run a company making decisions on these functions as a team.
Capsim "stockholders' meeting" presentation, CSULBA FEMBA 11, August 2011Will Woods
Â
Final presentation for CSULB FEMBA capstone course competition
August 2011
Team Erie: Industry C43894
Jessica Archer
Meredith Curry
Muhammad Soomar
Veronica Mimi Ta
William James Woods
Capsim Strategic Management Simulation: First Place. We simulated developing silicon wafers for 6 rounds representing 6 years. We chose broad differentiation as a a strategy. Even though I was CEO for round 5 & 6, I drove the strategy starting round 1
Putting the SPARK into Virtual Training.pptxCynthia Clay
Â
This 60-minute webinar, sponsored by Adobe, was delivered for the Training Mag Network. It explored the five elements of SPARK: Storytelling, Purpose, Action, Relationships, and Kudos. Knowing how to tell a well-structured story is key to building long-term memory. Stating a clear purpose that doesn't take away from the discovery learning process is critical. Ensuring that people move from theory to practical application is imperative. Creating strong social learning is the key to commitment and engagement. Validating and affirming participants' comments is the way to create a positive learning environment.
Remote sensing and monitoring are changing the mining industry for the better. These are providing innovative solutions to long-standing challenges. Those related to exploration, extraction, and overall environmental management by mining technology companies Odisha. These technologies make use of satellite imaging, aerial photography and sensors to collect data that might be inaccessible or from hazardous locations. With the use of this technology, mining operations are becoming increasingly efficient. Let us gain more insight into the key aspects associated with remote sensing and monitoring when it comes to mining.
Buy Verified PayPal Account | Buy Google 5 Star Reviewsusawebmarket
Â
Buy Verified PayPal Account
Looking to buy verified PayPal accounts? Discover 7 expert tips for safely purchasing a verified PayPal account in 2024. Ensure security and reliability for your transactions.
PayPal Services Features-
🟢 Email Access
🟢 Bank Added
🟢 Card Verified
🟢 Full SSN Provided
🟢 Phone Number Access
🟢 Driving License Copy
🟢 Fasted Delivery
Client Satisfaction is Our First priority. Our services is very appropriate to buy. We assume that the first-rate way to purchase our offerings is to order on the website. If you have any worry in our cooperation usually You can order us on Skype or Telegram.
24/7 Hours Reply/Please Contact
usawebmarketEmail: support@usawebmarket.com
Skype: usawebmarket
Telegram: @usawebmarket
WhatsApp: +1‪(218) 203-5951‬
USA WEB MARKET is the Best Verified PayPal, Payoneer, Cash App, Skrill, Neteller, Stripe Account and SEO, SMM Service provider.100%Satisfection granted.100% replacement Granted.
RMD24 | Debunking the non-endemic revenue myth Marvin Vacquier Droop | First ...BBPMedia1
Â
Marvin neemt je in deze presentatie mee in de voordelen van non-endemic advertising op retail media netwerken. Hij brengt ook de uitdagingen in beeld die de markt op dit moment heeft op het gebied van retail media voor niet-leveranciers.
Retail media wordt gezien als het nieuwe advertising-medium en ook mediabureaus richten massaal retail media-afdelingen op. Merken die niet in de betreffende winkel liggen staan ook nog niet in de rij om op de retail media netwerken te adverteren. Marvin belicht de uitdagingen die er zijn om echt aansluiting te vinden op die markt van non-endemic advertising.
What is the TDS Return Filing Due Date for FY 2024-25.pdfseoforlegalpillers
Â
It is crucial for the taxpayers to understand about the TDS Return Filing Due Date, so that they can fulfill your TDS obligations efficiently. Taxpayers can avoid penalties by sticking to the deadlines and by accurate filing of TDS. Timely filing of TDS will make sure about the availability of tax credits. You can also seek the professional guidance of experts like Legal Pillers for timely filing of the TDS Return.
Explore our most comprehensive guide on lookback analysis at SafePaaS, covering access governance and how it can transform modern ERP audits. Browse now!
Discover the innovative and creative projects that highlight my journey throu...dylandmeas
Â
Discover the innovative and creative projects that highlight my journey through Full Sail University. Below, you’ll find a collection of my work showcasing my skills and expertise in digital marketing, event planning, and media production.
Taurus Zodiac Sign_ Personality Traits and Sign Dates.pptxmy Pandit
Â
Explore the world of the Taurus zodiac sign. Learn about their stability, determination, and appreciation for beauty. Discover how Taureans' grounded nature and hardworking mindset define their unique personality.
Falcon stands out as a top-tier P2P Invoice Discounting platform in India, bridging esteemed blue-chip companies and eager investors. Our goal is to transform the investment landscape in India by establishing a comprehensive destination for borrowers and investors with diverse profiles and needs, all while minimizing risk. What sets Falcon apart is the elimination of intermediaries such as commercial banks and depository institutions, allowing investors to enjoy higher yields.
1. Board of Directors Meeting
Team Baldwin
World 4
Ben Pileggi
Dev Anumolu
Tom Qi
Mickey Lee
Colleen Powers
March 6, 2009
I have neither given or received unauthorized aid on this deliverable.
2. May 27, 2009
Agenda
1. Review of Business Strategy
2. Overall Performance Snapshot
3. Functional Performance Assessment
• Product Market
• Volume Products
• Margin Products
• Productivity and Operations
• Financial Management
4. Pro-forma Projections
2
3. May 27, 2009
Business Strategy - Key Decision Points
Round 1 Round 2 Round 3 Round 4 Round 5 Round 6 Round 7 Round 8 Next 3
Differentiation –
Product Lifecycle
Product Portfolio
(3 segments)
Introduce New
Product in High
End
Differentiation in 4
segments
Portfolio
Rationalization
(Cut 2 products)
Focus on Market
Metrics
Share
Focus on Margin
3
4. May 27, 2009
Performance Snapshot – Return on Equity
Baldwin ROE
30%
Growing ROE since year 4
28%
20% 18%
10% 9% 9% 11%
10%
6% 2%
0%
-4%
R0 R1 R2 R3 R4 R5 R6 R7 R8 ROE for Industry in 2017
-10%
Ferris Andrews
11% 29%
Erie
22%
Second highest ROE in the
Industry
Digby
28% Baldwin
Chester 28%
10%
4
5. May 27, 2009
Performance Snapshot – Market Share
Market Share Comparison
120%
100%
80%
60%
40%
20%
16.7% 18.1% 17.6% 19.3% 14.6% 15.9% 14.5% 14.8% 15.3%
0%
R0 R1 R2 R3 R4 R5 R6 R7 R8
Baldwin Andrews Chester Digby Erie Ferris
After growing for the first 4 years, market share leveled off near
15% in latter years as focus shifted to profit margins
5
6. May 27, 2009
Performance Snapshot – Market Capitalization
Market Capitalization
(in millions)
450
400
350
300 Baldwin
221 Andrews
250
186
Chester
200 120
81 Digby
150
69 75 79 64 Erie
100 71
Ferris
50
0
R0 R1 R2 R3 R4 R5 R6 R7 R8
Market capitalization ranked second among all competitors due
to increasing stock price and capital structure
6
7. May 27, 2009
Balanced Scorecard
Weighted Average Market Cap 13.6/20
Customer Survey Sales 18.3/20
Score 20 /20 Customer Financial Emergency Loan 0/20
Perspective
Market Share 23.2 /40 Subtotal 31.9/60
Subtotal 43.2 /60
Balanced
Scorecard
Learning Internal
and Growth Business
Sales/Employee 10.4 20 Process
Assets/Employee 8.2 20 Operating Profit 32.660
Profits/Employee 7 20 TOTAL 133 240
Subtotal 25.6 60
Score
55% of metrics
7
8. May 27, 2009
Keys to success
Strategy Effect
Portfolio Diversification Well positioned to compete in
both high volume and high
margin product segments
Rationalizing Portfolio - to Adequate resources to grow
focus on 4 products in 4 each of the focus areas in a
segments competitive environment
Controlling expenses - after Investing only what we needed to
early years of heavy investing maintain and grow our market
share in targeted segments
Early investment in Lower production, materials and
automation, productivity and labor costs fueling higher
HR margins
8
9. May 27, 2009
Diagnosis of failures
Issue Effect
Reacted too much to Changed strategy after the first
competitors round.
Spread resources to thin in early
rounds
Over looked cost control in Lower profitability in middle years
rounds 3 and 4 resulting in due to high interest costs, large
back-to-back emergency loans inventory expenses
Delayed in devising plan for Failed to meet sales projections
optimal production and
capacity mix in the early years
Risk averse in later years and Slower growth in competition and
underestimated the potential of large amounts of cash on hand
the market
9
10. May 27, 2009
LOW PERF
Product market: Volume Products
TRAD
SIZE HIGH
Traditional - Baker Low End - Bead
Focus on price, keeping operating costs low
Strategy
giving the customers what they want
Deliver on customer needs Meet customer demand for
(Focus on Position, MTBF and age and ideal position (size
R&D
Age) and performance)
Tactics
Marketing
- Price at the highest - Hold price to maintain
- Maintained 100% awareness contribution margin and meet
- Increased our spending over customer needs
the years to increase - Spend in marketing and
accessibility sales to maintain leadership
10
11. May 27, 2009
Volume Products - Execution
Traditional - Baker Low End - Bead
Sales in Traditional Sales in Low
600,000 60,000
500,000 50,000
400,000 40,000
300,000 30,000
200,000 20,000
100,000
10,000
0
0
R0 R1 R2 R3 R4 R5 R6 R7 R8
Average among major players Baker Average among major players Bead
Baker performed above average Bead performed above average in
early years then dropped
CAGR: 44% CAGR: 5%
11
12. May 27, 2009
LOW PERF
Product market: Margin Products
TRAD
SIZE HIGH
High End - Brave Size - Buddy
Strategy Meet top 2 customer specifications and maintain
maximum spending on R&D and marketing
Tactics -Annual product updates to Annual product updates to
maintain ideal position and low maintain ideal position and
R&D
age MTBF
- MTBF at highest level
Marketing
- Match competitor price each - Maintain upper end price
year by lowering $.50 per year - Maintain max awareness
- Maintain max awareness - Incremental gains in sales
- Improve distribution each
year
12
13. May 27, 2009
Margin Products - Execution
High End - Brave Size - Buddy
Sales in High Segment Sales in Size Segment
60,000
300,000
50,000
250,000
40,000
200,000
30,000
150,000
20,000
100,000
10,000
50,000
0
0
R0 R1 R2 R3 R4 R5 R6 R7 R8
Average among major players Brave Average among major players Buddy
Brave performed with the Buddy performed above average
average in a competitive market in a rapidly growing market
CAGR: 38% CAGR: 48%
13
14. May 27, 2009
Production and Operations
Strategy Automate low end and invest in capacity in each round
Maintain the lowest inventory to reduce inventory
Inventory
carrying costs and avoiding emergency loans
Focus on quality for employees – higher wage rate
Labor/
Tactics and gradual investments in recruitment and training
HR Mgmt
• Invest in moderates increases in capacity
PPE/ TQM • Sell excess capacity in obsolete segments
• Invest continuously in TQM initiatives
14
15. May 27, 2009
Production and Operations - Execution
TQM Summary
16%
14%
Percentage Change
12%
10%
8%
6%
4%
2%
0%
R3 R4 R5 R6 R7 R8
Demand Increase 0.0% 3.7% 3.7% 9.2% 14.0% 14.3%
Labor Cost Reduction 0.0% 6.2% 9.1% 9.1% 12.5% 13.3%
Material Cost Reduction 0.0% 3.4% 8.1% 8.7% 9.4% 10.5%
Gradual TQM investments made significant impacts on labor and
material cost reduction
15
16. May 27, 2009
Production and Operations - Execution
Contribution Margin
60%
50%
40%
30%
20%
10%
0%
R0 R1 R2 R3 R4 R5 R6 R7 R8
Baker Bead Brave Buddy
Contribution margin remained stable and strong between 20%
and 50% during the last four years
16
17. May 27, 2009
Financial Management
Target Meeting operational need for capital while maximizing return of
value to shareholders
Tactics • Monitor and value marketing projections
Capital • Evaluate expense and optimizing cost control
Budgeting • Estimate cash flow from operations and buffer
Capital • Use leverage to avoid to financing directly from
Structure and stock market
leverage • Protect interest of current shareholders
Maintain constant dividends yield and sharing profits
Dividend
with shareholders
Policy
17
18. May 27, 2009
Financial Management - Execution
35,000,000 2.50
Dividend in Dollars Leverage
30,000,000
2.00
25,000,000
1.50
20,000,000
15,000,000 1.00
10,000,000
0.50
5,000,000
0 0.00
R1 R2 R3 R4 R5 R6 R7 R8 R1 R2 R3 R4 R5 R6 R7 R8
• Predicted the increasing demand for capital and avoided frequent use of emergency
loan as revenue stabilized
• Cash flow from operations allowed for less dependence on debt and equity from
capital markets
• Effectively used leverage and managed to balance benefit and impact from interest
expense
• Successfully maintained the increase of dividends yield
18
19. May 27, 2009
Future Strategy
Overall Maintain existing strategy – harvest Traditional & Low
Strategy segments and continue to investment in Size and High
End segments
• Aggressively invest in Size and High End
R&D • Modest investments in Traditional
Functional Areas
Maintain current (max) awareness levels and
Marketing continue to build distribution for increase satisfaction
Modest capacity investments on par with expected
Production sales
19
20. May 27, 2009
Pro Forma Statement Summary
Maturing industry still offers growth opportunities for company’s
poised well for success
Anticipate $368M Revenues by Year 11
Modest capacity investments to keep up with demand
Utilize leverage as necessary
Continue to pay dividends
See appendix for full detail
20
22. May 27, 2009
Business Strategy – Guiding Principles
DIFFERENTIATON
ACROSS 4 SEGMENTS
FOCUS ON RETURNS TO BALANCE
SHAREHOLDERS LOW PERF VOLUME WITH MARGIN
TRAD
SIZE HIGH
PRACTICE CONSERVATIVE INVEST REGULARLY IN
FINANCIAL MANAGEMENT TECHNOLOGY AND
EMPLOYEE DEVELOPMENT
22
24. May 27, 2009
Capacity Decisions
Period 0 1 2 3 4 5 6 7 8
8960 10008.32 11179.29 12487.27 13948.28 15580.23 17403.12 19439.28 21713.68
growth 0.117
price 21 19 18.5 18 17.5 17 16.5 16 15.5
Mkt share 0.17 0.17 0.17 0.17 0.17 0.17 0.17 0.17 0.17
Volume 1523.2 1701.414 1900.48 1027 1214.941 1357.089 1515.869 1693.225 1891.332
1st shift Production 500 500 500 500 500 500 500 500 500
2nd shift 500 500 500 500 500 500 500 500 500
2nd shift extra cost 1780 1780 1780 1780 1780 1780 1780 1780 1780
Total 2nd shift cost 16020
Loss of opportunity volume 523.2 701.4144 900.4799 27 214.941 357.0891 515.8685 693.2251 891.3325
Lost Margin 3175.824 2854.757 3214.713 82.89 552.3984 739.1744 809.9136 741.7509 508.0595
Total lost margin 12679.48
Cost to Increase capacity at
current auto level 13000
If the 2nd shift cost and total lost margin was more we tried
==> Increase capacity ? Yes to increase capacity
24
25. May 27, 2009
Balance Sheet - Projection
Actuals Forecasts
6 7 8 Year +1 Year +2 Year +3
ASSETS:
Cash 12,355 18,496 26,970 33,413 41,395 51,284
Accounts Receivable - Trade 14,681 16,425 19,134 21,765 24,757 28,161
Inventories 13,032 8,973 830 842 855 868
CURRENT ASSETS 40,068 43,894 46,934 56,020 67,007 80,313
Property, Plant & Equipment - at cost 183,600 168,130 168,130 181,691 191,170 191,170
Accumulated Depreciation -86,856 -90,960 -102,168 -114,281 -127,026 -139,771
TOTAL ASSETS 136,812 121,064 112,896 123,430 131,151 131,711
LIABILITIES:
Accounts Payable - Trade 9,170 10,568 12,432 13,800 15,317 17,002
Notes Payable and Short Term Debt 15,977 0 0 0 0 0
CURRENT LIABILITIES 25,147 10,568 12,432 13,800 15,317 17,002
Long Term Debt 11,895 16,895 16,895 19,749 15,296 2,391
TOTAL LIABILITIES 37,042 27,463 29,327 33,548 30,613 19,393
SHAREHOLDERS' EQUITY
Common Stock + Paid in Capital 54,360 54,360 54,360 54,360 54,360 54,360
Retained Earnings 45,410 39,241 29,209 35,521 46,178 57,958
SHAREHOLDERS' EQUITY 99,770 93,601 83,569 89,881 100,538 112,318
TOTAL LIABILITIES AND EQUITIES 136,812 121,064 112,896 123,430 131,151 131,711
25
26. May 27, 2009
Cash Flow Statement - Projection
Actuals Forecasts
IMPLIED STATEMENT OF CASH FLOWS 7 8 Year +1 Year +2 Year +3 Year +4
NET INCOME 17,312 23,488 35,014 45,312 54,562 0
Add back Depreciation Expense 4,104 11,208 12,113 12,745 12,745 -139,771
(Incr.) Decrease in Receivables - Trade -1,744 -2,709 -2,631 -2,992 -3,404 28,161
(Incr.) Decrease in Inventories 4,059 8,143 -12 -13 -13 868
Incr. (Decr.) in Acct. Payable - Trade 1,398 1,864 1,368 1,518 1,685 -17,002
NET CF FROM OPERATIONS 25,129 41,994 45,851 56,570 65,575 -127,745
(Incr.) Decrease in Prop., Plant, & Equip. at cost 15,470 0 -13,561 -9,479 0 191,170
NET CF FROM INVESTING 15,470 0 -13,561 -9,479 0 191,170
Incr. (Decr.) in ST Debt -15,977 0 0 0 0 0
Incr. (Decr.) in LT Debt 5,000 0 2,854 -4,453 -12,905 -2,391
Dividends -23,481 -33,520 -28,701 -34,656 -42,781 -57,958
NET CF FROM FINANCING -34,458 -33,520 -25,848 -39,109 -55,686 -114,709
NET CHANGE IN CASH 6,141 8,474 6,443 7,982 9,889 -51,284
26
27. May 27, 2009
Income Statement - Projection
Actuals Forecasts
Year 6 7 8 Year +1 Year +2 Year +3
INCOME STATEMENT
Revenues 178,625 199,838 232,803 271,215 315,966 368,100
Cost of Goods Sold -119,868 -133,728 -159,507 -184,427 -214,857 -250,308
Gross Profit 58,757 66,110 73,296 86,789 101,109 117,792
Selling, General and Admin. Expense -34,073 -34,500 -33,246 -27,205 -22,262 -18,217
Other Operating Expenses (1) -4,136 -3,060 -2,000 -3,800 -7,220 -13,718
Operating Profit 20,548 28,550 38,050 55,784 71,627 85,857
Interest Expense -2,891 -1,916 -1,916 -1,916 -1,916 -1,916
Income before Tax 17,657 26,634 36,134 53,868 69,711 83,941
Income Tax Expense -6,180 -9,322 -12,646 -18,854 -24,399 -29,379
NET INCOME 11,477 17,312 23,488 35,014 45,312 54,562
Other Comprehensive Income Items -252 -381 -517 -518 -517 -518
COMPREHENSIVE INCOME 11,225 16,931 22,971 34,496 44,795 54,043
27
Editor's Notes
BEN
BEN
MICKEY
MICKEY
MICKEY
MICKEY
COLLEEN
COLLEEN
COLLEEN
COLLEEN
COLLEEN
COLLEEN
DEV
DEV
DEV
TOM
TOM
BEN
BEN
 Overall strategy clearly developed and articulated and executed  Linkage of strategy to performance metrics is made clear Team showed how past own and competitive results were used to monitor strategy Team presented evidence of learning and improvement in strategy through the simulated years No evidence of end-play or lack of attention to ongoing enterprise