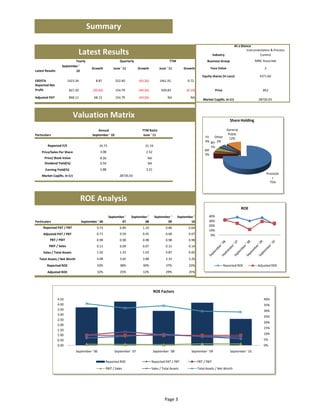
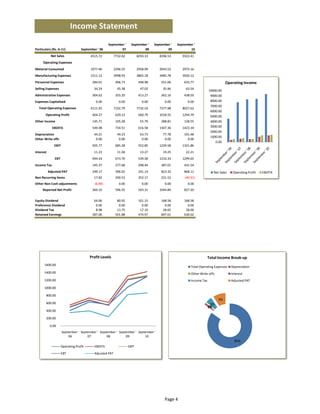
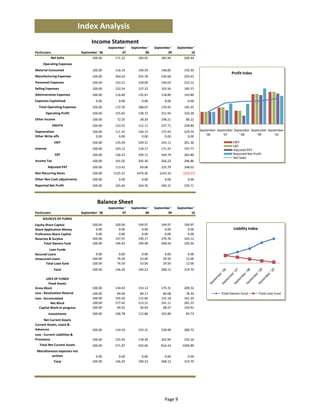
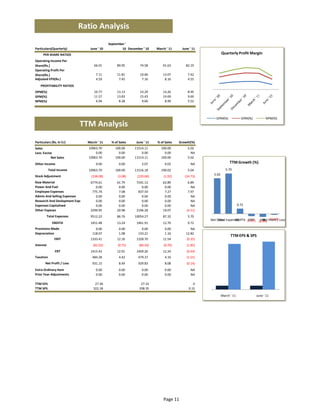
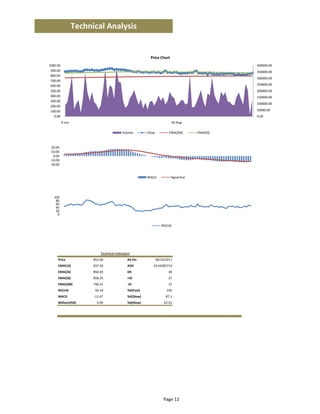
This report provides a financial analysis of Siemens Ltd for the period ending September 2010. Key highlights include:
- EBITDA grew 8.87% to Rs. 1423.34 crore while reported net profit fell 20.83% to Rs. 827.20 crore.
- The stock trades at a P/E of 34.73x with a market capitalization of Rs. 28726.03 crore.
- ROE has fluctuated between 0.45-1.1 over the past 5 years from 0.64 in FY2010.
This document provides a financial analysis of an Indian instrumentation and process control company. Key highlights include:
- In the latest fiscal year, the company reported a net profit of Rs. 827.20 crore, down 20.83%, and EBITDA of Rs. 1423.34 crore, up 8.87%.
- On a TTM basis, net profit was Rs. 929.83 crore, down 0.14%. The promoter group holds 75% shares and key ratios like ROE have declined in recent years.
- A valuation matrix shows the company traded at a P/E of 35.82x and price/sales ratio of 3.18x based on the latest annual
The document provides an exclusive financial analysis of Power Grid Corporation of India including a summary of latest results, valuation metrics, income statement, balance sheet, cashflow statement, quarterly results, growth analysis, comparative analysis, ratio analysis, and technical analysis. It was prepared by Tanay Roy, a CFA and Peu Karak, an MBA, through their company Finalytics for providing financial research and investment management. The document disclaims verification of the accuracy, completeness or correctness of the information contained within.
This report provides a financial analysis of ACC Ltd for the period ending June 2011. Key highlights include:
- EBITDA declined 31.67% yearly but grew 1% quarterly to Rs. 627.37 crore. Reported net profit fell 30.23% yearly and 4.02% quarterly.
- At current prices, the stock trades at a P/E of 22.02x and P/BV of 3.55x with a dividend yield of 2.5%.
- ROE has fluctuated between 70-80% over the past 5 years, with adjusted PAT/PBT at 70% for FY2010.
The report contains further details on
- Ranbaxy Laboratories Ltd is an Indian pharmaceutical company in the Daiichi-Sankyo business group
- For the quarter ending June 2011: Revenue was Rs. 113.35 billion (up 16.99% YoY), EBITDA was Rs. 318.22 billion (down 18.37% YoY), and net profit was Rs. 57.02 billion (down 24.26% YoY)
- As of June 2011, the stock price was Rs. 488.95 per share with a market capitalization of Rs. 18,222.53 billion and a reported P/E of 210.75
This document provides a financial analysis of HCL Technologies Ltd for the period of June 2006 to June 2011. It includes a summary of the latest results highlighting growth in EBDITA, net profit, and other metrics. A valuation matrix shows key ratios such as P/E, P/S. The document also analyzes the company's income statement, balance sheet, cash flows, quarterly results, growth, comparative analysis against peers, index analysis, ratios over time, and provides a technical analysis. Finally, it introduces the authors and their expertise in financial analysis and investment management.
- Bharti Airtel Ltd is an Indian telecommunications company with a market capitalization of Rs. 73,154 crores.
- In the latest quarter (June 2011), Bharti Airtel reported a 3.58% growth in EBITDA but a 22.07% decline in reported net profit.
- Based on the latest annual (March 2011) results, Bharti Airtel is trading at a reported P/E of 18.99 times with a price to sales ratio of 3.85.
Reliance Communications Ltd is an Indian telecommunications company. Some key highlights:
- In the latest quarter (June 2011), EBDITA was Rs. 311 crore, down 2.03% year-over-year, and net loss was Rs. 272 crore, up 147.93%.
- The company has a market capitalization of Rs. 16,765.84 crore and trades at Rs. 82 per share.
- Major shareholders include General Public (68%), FIIs (8%), and Banks/Financial Institutions (8%).
- ROE has declined over time from 0.71 in FY07 to 0.36 in FY11 as profits have fallen and losses
- The document provides a financial analysis of an Indian computer software company for the period of March 2007 to March 2011.
- Key metrics for the latest quarter (June 2011) and financial year (March 2011) are presented, including EBDITA, reported and adjusted net profit, valuation ratios, and return on equity (ROE) analysis.
- The company has a market capitalization of Rs. 1,36,713 crore as of June 2011 and its shares are held by promoters (16%), mutual funds (5%), foreign institutional investors (37%), and others (24%).
The document provides a financial analysis of Hindustan Unilever Ltd, including their latest quarterly and annual results, valuation metrics, ratio analysis, and growth comparisons. It also introduces the authors, Tanay Roy and Peu Karak, who have extensive experience in financial analysis and research. The analysis examines Hindustan Unilever's income statement, balance sheet, cash flows, ratios, and technical indicators to evaluate the company's performance and valuation.
Dr. Reddy's Laboratories Ltd is an Indian pharmaceutical company with a market capitalization of Rs. 25561.24 crore. Some key highlights from the document:
- For the year ending March 2011, EBDITA grew 5.13% to Rs. 1335 crore and adjusted PAT grew 16.12% to Rs. 891.90 crore.
- The company trades at a reported P/E of 28.84 with a price to sales ratio of 4.97 and price to book value of 4.28.
- Major shareholders include promoters (26%), FIIs (25%), MFs (7%) and general public (8%).
- NTPC Ltd is an Indian power generation company with a market capitalization of Rs. 141821.98 crores.
- In the quarter ending June 2011, NTPC reported a 9.11% decline in quarterly profit to Rs. 2075.78 crores, while year-to-date profit grew 7.15% to Rs. 9352.59 crores.
- The document provides a detailed financial analysis of NTPC including income statements, balance sheets, ratio analysis, and valuation metrics to analyze the company's performance and valuation.
- ACC Ltd is an Indian cement company headquartered in Mumbai. This document provides a financial analysis of ACC for the years 2006-2010.
- Key highlights from the latest annual results for 2010 include EBDITA of Rs. 1844 Cr (down 31.67% YoY), reported net profit of Rs. 1120 Cr (down 30.23% YoY), and adjusted PAT of Rs. 971 Cr (down 3.44% YoY).
- A valuation matrix shows the stock trading at a reported P/E of 17.48x and price/sales per share of 2.56x based on 2010 results.
This document provides a financial analysis of Bharat Petroleum Corporation Ltd, an Indian public sector oil and gas company. It includes summaries of the company's latest results and quarterly performance, valuations, return on equity analysis, and income statements, balance sheets, cashflow statements, and various financial ratios. The analysis was prepared by Tanay Roy and Peu Karak to provide investors with insights into BPCL's financials and market performance.
The document provides an exclusive financial analysis of Hindalco Industries Ltd, an Indian aluminum company. It includes a summary of the company's latest results and valuation metrics, as well as analyses of its income statement, balance sheet, cash flow statement, ratios, and technical indicators. The document was prepared by financial analysts Tanay Roy and Peu Karak to provide insights into Hindalco's financial performance and valuation.
- The document provides a financial analysis of DLF Ltd for the years 2007-2011, including income statements, balance sheets, cash flow statements, ratio analysis, and valuation metrics.
- Key highlights are that EBDITA grew 49.86% in 2011 to Rs. 2909.86 crore, while reported net profit grew 65.94% to Rs. 1269.55 crore. Return on equity declined from 65% in 2007 to 9% in 2011.
- The balance sheet shows total assets grew to Rs. 28870.04 crore in 2011, funded primarily by secured loans of Rs. 14700.70 crore and owners' equity of Rs. 13810.49 crore
- The document provides a financial analysis of GAIL (India) Ltd for the years 2007-2011, including income statements, balance sheets, cash flow statements, ratio analysis, and valuation metrics.
- Key highlights from the latest annual results for GAIL show revenues of Rs. 6032.81 crore for FY2011, with a net profit of Rs. 3561.13 crore, up 13.42% from the previous year.
- Valuation metrics for GAIL include a price/earnings ratio of 15.14 based on the latest annual results, and a price/book value of 2.80.
- Bajaj Auto Ltd is an Indian automotive company that manufactures motorcycles, commercial vehicles and auto rickshaws. The document provides a financial analysis of Bajaj Auto for the period of March 2007 to March 2011.
- Key highlights from the analysis include Bajaj Auto reporting a 96.44% growth in net profit in March 2011, an ROE of 69% in March 2011, and total assets to net worth ratio declining from 3.11 in March 2008 to 2.40 in March 2011.
- The document contains income statements, balance sheets, ratio analysis, and other financial metrics for Bajaj Auto over the period analyzed.
- The document provides a financial analysis of Bharat Heavy Electricals Ltd for the years 2007-2011 including income statements, balance sheets, cash flow statements, ratio analysis, and valuation metrics.
- Key highlights are that for FY2011, reported net profit was Rs. 6011.20 Cr (up 39.45% YoY) while adjusted PAT was Rs. 5847.61 Cr (up 29.88% YoY). Return on equity was 29% in FY2011.
- As of March 2011, the company had a market capitalization of Rs. 41277.55 Cr and traded at a price/earnings ratio of 13.73 based on F
Infrastructure development finance company ltdTanay Roy, CFA
This document provides a financial analysis of an Indian finance company called Infrastructure Development Finance Company Ltd. Key highlights from the analysis include:
- For the fiscal year ending March 2011, the company reported net profit growth of 26.09% and EBIDTA growth of 36.86%.
- Valuation metrics for the company include a TTM P/E ratio of 12.86, P/Sales per share of 3.61, and market capitalization of Rs. 12638.54 crores.
- The company's return on equity has fluctuated in recent years from a high of 1.12 in FY2010 to 0.82 in FY2011.
The document provides a detailed analysis of The Boeing Company, including its annual and quarterly financial performance, valuation, growth, ratios, and projections. Key highlights from the latest annual and quarterly results show an increase in sales, EBITDA, adjusted profit, and EPS. The company has a lower P/E than its industry average but a higher price to sales ratio. Its ROE increased in 2011 driven by growth in sales and profits.
Housing development finance corporation ltdTanay Roy, CFA
- HDFC reported a 23.85% increase in net profit for the year ending March 2011. EBITDA grew 13.3% and the quarter ending June 2011 saw a 1.13% EBITDA growth.
- HDFC trades at a reported P/E of 27.46 with a market capitalization of Rs. 16,744 crores. Return on equity has been around 21-29% in recent years.
- Major shareholders are foreign institutional investors at 73% and banks/financial institutions at 11% while the promoter group holds 0%.
The document provides an exclusive financial analysis of Ambuja Cements Ltd, including a summary of the company's latest results, valuation metrics, ROE analysis, income statement, balance sheet, cashflow statement, quarterly results, growth analysis, comparative analysis, ratio analysis, TTM analysis, and technical analysis. It was prepared by Tanay Roy, CFA and Peu Karak, MBA, and contains disclaimers about the accuracy of the information. The document also provides background on the analysts' expertise and contact information.
- The document provides an exclusive financial analysis of Sesa Goa Ltd, an Indian mining and minerals company.
- In the latest quarter (June 2011), the company reported a 44.89% decline in EBDITA and a 50.14% decline in reported net profit compared to the same quarter last year.
- Based on the current stock price of Rs. 224.05, the company has a market capitalization of Rs. 881.91 crores and trades at price to earnings and price to sales ratios of 5.37 and 2.59 respectively based on TTM results.
- The document provides a financial analysis of an Indian cigarette company for the years 2007-2011, including income statements, balance sheets, cash flow statements, ratio analysis, and valuation metrics.
- Key highlights are that revenues grew from Rs. 12,313 crores to Rs. 21,121 crores from 2007-2011, with EBIDTA growing from Rs. 4,304 crores to Rs. 7,847 crores. Reported net profit increased from Rs. 2,700 crores to Rs. 4,988 crores over this period.
- The company maintained a healthy ROE of 26-31% from 2007-2011. Valuation metrics show the stock trading
This document provides a fundamental analysis of PepsiCo Inc. prepared by SRI KRISHNA CONSULTING. It includes a business summary, latest annual and quarterly results, valuation data, income statement, balance sheet, cash flow statement, ratio analysis, and technical analysis. The analysis finds that PepsiCo had sales of $66.5 billion in 2011, earnings per share of $4.46, and return on equity between 16-18% over the past 5 years.
This report provides a fundamental analysis of The Boeing Company, including key financial metrics and valuation data:
1) Annual sales were $68.7 billion for 2011, up 6.9% from 2010. EBITDA was $7 billion for 2011, up 9% from 2010. ROE was 102.1% for 2011.
2) The company has a P/E ratio of 13.99 compared to the industry average of 25.14. The price to sales ratio is 0.73 compared to the industry average of 1.81.
3) The report contains analyses of income statements, balance sheets, cash flows, ratios, valuations and projections to evaluate the company's performance and outlook.
This report provides a fundamental analysis of Microsoft Corp for the period ending June 30, 2012. It includes a summary of the company's latest annual and quarterly results showing year-over-year growth across key metrics like sales, EBITDA, and earnings per share. The report also provides an overview of the company, its industry, stock valuation ratios, and comparisons to industry averages. Financial statements including income statements, balance sheets, and cash flow statements are analyzed along with growth, comparative, index, ratio and valuation information.
Compendium of nifty november beta (1.0.0.1) release.Tanay Roy, CFA
The document is a financial analysis report of top 50 Indian companies prepared by Tanay Roy. It provides the market capitalization, sales, and return on equity (REO) of companies along with their respective ranks. The top 3 companies by market capitalization are Reliance Industries Ltd, Oil & Natural Gas Corpn Ltd, and Tata Consultancy Services Ltd. Reliance Industries Ltd has the highest sales. Hindustan Unilever Ltd has the highest return on equity of 81.79%. The report can be downloaded from the provided URL and contains a disclaimer.
Mymoneygurukul.com is a website created by a group of finance professionals to provide information on personal finance topics like banks, mutual funds, insurance, markets, and regulations. The site contains profiles of financial institutions, articles on savings, investments, and retirement planning. It also has an FAQ section and free training presentations. Their current plans are to complete all profiles and articles by September 2012, publish technical analysis tools, and launch a retirement planning article series. The site was built using Wordpress without technical expertise to simplify financial information for users.
Compendium of Nifty 50- October Beta (1.0.0.1) ReleaseTanay Roy, CFA
Compendium of nifty 50 is a monthly publication by “TANAY ROY EXCLUSIVE”. The book presents summarized fundamental data of all nifty composites companies.
Este documento describe una colección de artefactos arqueológicos de diferentes períodos y estilos culturales de Mesoamérica. Incluye figurillas, vasijas, platos, cuencos y otros objetos de cerámica decorada de las culturas Chupícuaro, Teotihuacan, Tolteca y otros, así como artefactos líticos como puntas de flecha. La colección contiene una amplia variedad de formas cerámicas como vasijas, cuencos, platos y figurillas que ilustran diversas tradic
The document discusses trends in the mobile application business in Thailand. It notes that smartphone and tablet usage is rising dramatically, with Facebook being the top social network used on mobile. The document outlines different business models for mobile apps, including paid, freemium, and advertising models. It also discusses important factors to consider when developing a mobile app like the target audience, competitors, and focus on user experience.
Este documento resume la información sobre el ciclo formativo de grado medio de Conducción de actividades físico-deportivas en el medio natural en varios municipios de Sevilla, incluyendo las notas de corte, el número de plazas y los centros de estudios en cada localidad.
This very short document contains 3 brief statements with no clear connection. It opens with the greeting "hello" and then states "This is cool" followed by two blank lines and ending with "Last slide".
Luxury family holidays have many advantages, particularly when you bring family holidays abroad. Enjoy family fun, sharing, bonding and opportunities to see and show your family adventures, sights and experiences that cannot be repeat at home. For more details contact us today.
Una impresora es un periférico que permite imprimir documentos electrónicos en formato físico como papel o transparencias utilizando tinta o tecnología láser. Existen diferentes tipos de impresoras como de matriz de puntos, chorro de tinta, láser y plotters para gráficos.
This document provides an overview of a health and wellness coach meeting. It discusses why people become coaches, the growth of the wellness industry, obesity trends, and problems obesity creates. It then outlines the company's 5 core solutions: health and wellness clubs, coaches, education/training, fun activities, and nutritional products. The company discussed has over 80,000 clubs worldwide, $10 million in daily revenue, and provides weight loss, fitness and health results for customers. The compensation plan allows coaches to earn income through part-time flexible work talking to people and running wellness challenges.
This document outlines a scheme of work for a Year 7 art and design class focusing on character masks for performance from Mexican and African cultures. Students will visit the British Museum to draw masks and cultural objects from the Africa collection, developing initial ideas. They will then create a final mask piece relating to emotions or situations. Students will learn about mask purposes and research techniques to inform their designs. Some students may independently research other galleries or create masks at home. Performance masks will be presented and assessed in plastic folders.
The destination of the speed and the unique experience. Unique-holidays offers you very beneficial facilities for comfort stay in
Unique hotels, travelling facility for the beautiful locations. Other features like Shopping, visiting adventure places etc.. For more details contact us on our web: http://goo.gl/8lDagH .
Amit Kumar Nand is seeking a challenging technical position and has over 1.7 years of experience in project and operations management for companies like Wipro, Airtel, MTS, and Tata Teleservices, leading various projects involving installation, integration, and dismantling of telecom infrastructure and handling teams across multiple locations. He holds a Bachelor's degree in Computer Science and has experience managing projects, resolving issues, communicating with stakeholders, and leading teams.
BLAST is a novel presentation format that encourages rapid knowledge transfer through short slides of 8 words or less to avoid "death by powerpoint". It aims to efficiently convey key information in a brief format. The presentation and additional references on the BLAST format can be found at blast.emcrit.org.
This document provides sample diet plans for days 1-3 of the GM diet, which is intended to help lose 8 kg of weight in 7 days. Day 1 involves eating fruits like apples, papaya, watermelon, and oranges along with water and coconut water. Day 2 replaces breakfast with boiled potato and has meals of cabbage, tomatoes, and steamed vegetables and water. Day 3 continues with fruits like apples, melon, mango and vegetables like cucumber, lettuce, tomato and beet in strict combination with water intake.
Research cloud services for small and medium businesses (smb) marketNeel Terde
www.aarkstore.com announce a new report "|| Research|| Cloud Services for Small and Medium Businesses (SMB) Market " through its vast collection of market research report
This document provides vocabulary for discussing cause and effect relationships, with phrases to introduce reasons or causes such as "to be rooted in" and "to stem from", and phrases to introduce consequences such as "to prompt", "to trigger", "to unleash", and "to spark".
En el siguiente mapa conceptual, encontrarán una definición de la gestión de proyectos, orientada a proyectos de educación.
Resaltando el tiempo de vida de un proyecto, su ciclo, el personal a cargo y las resposabilidades de conlleva el desarrollo del proyecto. Además sus principales características y direcciones.
Reliance Industries Ltd is a diversified Indian conglomerate. Its latest yearly results show a 25.99% rise in EBITDA to Rs. 40520.69 crore and a 24.95% rise in reported net profit to Rs. 20286.30 crore. On a TTM basis, EBITDA rose 2.28% to Rs. 42118 crore. The company trades at a P/E of 13.35 with a market capitalization of Rs. 115305.82 crore. Its ROE has remained around 20% in the last few years.
This document provides a financial analysis of Cipla Ltd, an Indian pharmaceutical company, including:
- A summary of the company's latest yearly and quarterly results showing declines in EBDITA but growth in adjusted PAT.
- A valuation matrix comparing the company's stock to industry ratios like P/E and P/Book Value.
- An analysis of the company's return on equity over the past 5 years, showing an increase in reported PAT/PBT to 2.31 in March 2011.
- Sections analyzing the company's income statement, balance sheet, cashflow statement, quarterly results, and various financial ratios over time.
The document provides a financial analysis of Maruti Suzuki India Ltd, including key metrics from their income statement, balance sheet, cash flow statement and ratios. It analyzes their quarterly and yearly results, growth, valuation, and return on equity. The analysis is prepared by Tanay Roy, CFA and Peu Karak, MBA to provide investors with information about Maruti Suzuki's financial performance and valuation.
This document provides a financial analysis of Grasim Industries Ltd for the period of March 2007 to June 2011. Key highlights include:
- For the latest fiscal year (March 2011), net profit decreased 43.52% to Rs. 1,181.71 crore while EBIDTA decreased 38.46% to Rs. 1,817.08 crore.
- As of June 2011, the company's market capitalization was Rs. 21,068.52 crore with its stock trading at Rs. 2,298.2 per share.
- Based on March 2011 financials, the company's reported and TTM P/E ratios were 17.83 and 17
- The document provides a financial analysis of Reliance Industries Ltd for the year ending March 2012, including income statements, balance sheets, ratio analysis, and growth trends.
- Key highlights are a 5.26% decline in EBDITA to Rs. 38,388 crore for FY12, and a 1.21% decline in reported net profit to Rs. 20,040 crore.
- ROE declined from 14% in FY11 to 12% in FY12 due to lower profitability, though the company maintained strong asset turnover and financial leverage.
- The document provides a financial analysis of HDFC Bank including income statements, balance sheets, cash flow statements, ratio analysis, and growth trends over several years.
- Key metrics analyzed include return on equity, earnings per share, net profit growth, and valuation ratios like price-to-earnings and price-to-book value.
- The analysis finds that HDFC Bank has shown strong and consistent growth across most financial metrics over the past 5 years, with net profit growth of over 30% annually and return on equity of 13-15%.
This report provides a financial analysis of American Express Company for the period of 2007-2011. It includes income statements, balance sheets, cash flow statements, ratio analysis, and valuation metrics. Key findings are that revenues grew 7.59% to $32.3 billion in 2011, net income grew 21.64% to $4.93 billion, and return on equity was strong at 26.26% despite a challenging macroeconomic environment. American Express maintains a robust capital structure and profitable business model focused on travel and financial services.
- The document provides a financial analysis of Axis Bank including income statements, balance sheets, ratio analysis, and growth trends over several years.
- Key highlights from the latest annual and quarterly results show revenue growth of 36.5% and 15.9% respectively, with net profits up 34.8% and 19.8%.
- Ratio analysis shows the bank's return on equity to be stable between 16-18% with strong growth in assets, deposits, and net worth over time.
The document analyzes the business and financial performance of Panasonic and Sony over the period of 2008 to 2011. It includes sections on information gathering, accounting techniques used, and an analysis of the companies' financial performance based on ratios calculated from income statements, balance sheets, and cash flow statements. Key metrics examined include profitability, asset utilization, working capital, debt levels, and changes in owners' equity. The analysis provides a comparison of the financial positions and performance trends of the two electronics companies over the three-year period.
- Ameriprise Financial reported financial results for the fourth quarter of 2007 with revenues of $2.3 billion, up 8% from the prior year. Net income was $1.1 billion, up 57% from the prior year.
- Adjusted diluted earnings per share were $1.16, up 14% from the prior year, driven by higher revenues across all segments except Advice & Wealth Management.
- Total client assets were $293.9 billion, up 8% from the prior year, reflecting strong net flows and market appreciation across segments.
This document is a statistical supplement package for Ameriprise Financial, Inc. for the fourth quarter of 2008. It provides consolidated results and key metrics for Ameriprise, including net revenue, earnings per share, client assets, and debt-to-capital ratios. It also includes segment income statements and metrics for Ameriprise's business segments: Advice & Wealth Management, Asset Management, Annuities, Protection, and Corporate & Other. Finally, it contains balance sheet information, capital and ratings details, investment portfolio breakdowns, and definitions.
Profiles of Iconic Fashion Personalities.pdfTTop Threads
The fashion industry is dynamic and ever-changing, continuously sculpted by trailblazing visionaries who challenge norms and redefine beauty. This document delves into the profiles of some of the most iconic fashion personalities whose impact has left a lasting impression on the industry. From timeless designers to modern-day influencers, each individual has uniquely woven their thread into the rich fabric of fashion history, contributing to its ongoing evolution.
[To download this presentation, visit:
https://www.oeconsulting.com.sg/training-presentations]
This presentation is a curated compilation of PowerPoint diagrams and templates designed to illustrate 20 different digital transformation frameworks and models. These frameworks are based on recent industry trends and best practices, ensuring that the content remains relevant and up-to-date.
Key highlights include Microsoft's Digital Transformation Framework, which focuses on driving innovation and efficiency, and McKinsey's Ten Guiding Principles, which provide strategic insights for successful digital transformation. Additionally, Forrester's framework emphasizes enhancing customer experiences and modernizing IT infrastructure, while IDC's MaturityScape helps assess and develop organizational digital maturity. MIT's framework explores cutting-edge strategies for achieving digital success.
These materials are perfect for enhancing your business or classroom presentations, offering visual aids to supplement your insights. Please note that while comprehensive, these slides are intended as supplementary resources and may not be complete for standalone instructional purposes.
Frameworks/Models included:
Microsoft’s Digital Transformation Framework
McKinsey’s Ten Guiding Principles of Digital Transformation
Forrester’s Digital Transformation Framework
IDC’s Digital Transformation MaturityScape
MIT’s Digital Transformation Framework
Gartner’s Digital Transformation Framework
Accenture’s Digital Strategy & Enterprise Frameworks
Deloitte’s Digital Industrial Transformation Framework
Capgemini’s Digital Transformation Framework
PwC’s Digital Transformation Framework
Cisco’s Digital Transformation Framework
Cognizant’s Digital Transformation Framework
DXC Technology’s Digital Transformation Framework
The BCG Strategy Palette
McKinsey’s Digital Transformation Framework
Digital Transformation Compass
Four Levels of Digital Maturity
Design Thinking Framework
Business Model Canvas
Customer Journey Map
Zodiac Signs and Food Preferences_ What Your Sign Says About Your Tastemy Pandit
Know what your zodiac sign says about your taste in food! Explore how the 12 zodiac signs influence your culinary preferences with insights from MyPandit. Dive into astrology and flavors!
NIMA2024 | De toegevoegde waarde van DEI en ESG in campagnes | Nathalie Lam |...BBPMedia1
Nathalie zal delen hoe DEI en ESG een fundamentele rol kunnen spelen in je merkstrategie en je de juiste aansluiting kan creëren met je doelgroep. Door middel van voorbeelden en simpele handvatten toont ze hoe dit in jouw organisatie toegepast kan worden.
Part 2 Deep Dive: Navigating the 2024 Slowdownjeffkluth1
Introduction
The global retail industry has weathered numerous storms, with the financial crisis of 2008 serving as a poignant reminder of the sector's resilience and adaptability. However, as we navigate the complex landscape of 2024, retailers face a unique set of challenges that demand innovative strategies and a fundamental shift in mindset. This white paper contrasts the impact of the 2008 recession on the retail sector with the current headwinds retailers are grappling with, while offering a comprehensive roadmap for success in this new paradigm.
❼❷⓿❺❻❷❽❷❼❽ Dpboss Matka Result Satta Matka Guessing Satta Fix jodi Kalyan Final ank Satta Matka Dpbos Final ank Satta Matta Matka 143 Kalyan Matka Guessing Final Matka Final ank Today Matka 420 Satta Batta Satta 143 Kalyan Chart Main Bazar Chart vip Matka Guessing Dpboss 143 Guessing Kalyan night
Anny Serafina Love - Letter of Recommendation by Kellen Harkins, MS.AnnySerafinaLove
This letter, written by Kellen Harkins, Course Director at Full Sail University, commends Anny Love's exemplary performance in the Video Sharing Platforms class. It highlights her dedication, willingness to challenge herself, and exceptional skills in production, editing, and marketing across various video platforms like YouTube, TikTok, and Instagram.
Dive into this presentation and learn about the ways in which you can buy an engagement ring. This guide will help you choose the perfect engagement rings for women.
HR search is critical to a company's success because it ensures the correct people are in place. HR search integrates workforce capabilities with company goals by painstakingly identifying, screening, and employing qualified candidates, supporting innovation, productivity, and growth. Efficient talent acquisition improves teamwork while encouraging collaboration. Also, it reduces turnover, saves money, and ensures consistency. Furthermore, HR search discovers and develops leadership potential, resulting in a strong pipeline of future leaders. Finally, this strategic approach to recruitment enables businesses to respond to market changes, beat competitors, and achieve long-term success.
Digital Marketing with a Focus on Sustainabilitysssourabhsharma
Digital Marketing best practices including influencer marketing, content creators, and omnichannel marketing for Sustainable Brands at the Sustainable Cosmetics Summit 2024 in New York
Presentation by Herman Kienhuis (Curiosity VC) on Investing in AI for ABS Alu...Herman Kienhuis
Presentation by Herman Kienhuis (Curiosity VC) on developments in AI, the venture capital investment landscape and Curiosity VC's approach to investing, at the alumni event of Amsterdam Business School (University of Amsterdam) on June 13, 2024 in Amsterdam.
Unveiling the Dynamic Personalities, Key Dates, and Horoscope Insights: Gemin...my Pandit
Explore the fascinating world of the Gemini Zodiac Sign. Discover the unique personality traits, key dates, and horoscope insights of Gemini individuals. Learn how their sociable, communicative nature and boundless curiosity make them the dynamic explorers of the zodiac. Dive into the duality of the Gemini sign and understand their intellectual and adventurous spirit.
Storytelling is an incredibly valuable tool to share data and information. To get the most impact from stories there are a number of key ingredients. These are based on science and human nature. Using these elements in a story you can deliver information impactfully, ensure action and drive change.
Industrial Tech SW: Category Renewal and CreationChristian Dahlen
Every industrial revolution has created a new set of categories and a new set of players.
Multiple new technologies have emerged, but Samsara and C3.ai are only two companies which have gone public so far.
Manufacturing startups constitute the largest pipeline share of unicorns and IPO candidates in the SF Bay Area, and software startups dominate in Germany.
IMPACT Silver is a pure silver zinc producer with over $260 million in revenue since 2008 and a large 100% owned 210km Mexico land package - 2024 catalysts includes new 14% grade zinc Plomosas mine and 20,000m of fully funded exploration drilling.
1. gtÇtç eÉç XåvÄâá|äx
COMPANY FINALYTICS
Siemens Ltd
Exclusive Financial Analysis of Indian Companies
Prepared and Edited By‐
Tanay Roy, CFA
Peu Karak, MBA
Download this report from http://www.tanayroyexclusive.blogspot.com/
Disclaimer
The information, opinions, estimates and forecasts contained in this document have been arrived at or obtained from public sources believed
to be reliable and in good faith which has not been independently verified and no warranty, express or implied, is made as to their accuracy,
completeness or correctness.
For more information about this sample and our other services, please write to tanay.roy2008@gmail.com
Tuesday, November 01, 2011
2. Description Page
Summary 3
Latest Result 3
Valuation Matrix 3
ROE Analysis 3
Income Statement 4
Balance Sheet 5
Cash flow Statement 6
Quarterly Result 6
Growth Analysis 7
Comparative Analysis 8
Income Statement 8
Balance Sheet 8
Index Analysis 9
Income Statement 9
Balance Sheet 9
Ratio Analysis 10
Annual 10
Quarterly 11
TTM Analysis 11
Technical Analysis 12
CONTENT
About Tanay & Peu
Our passion lies in the field of financial research & Investment management and we intend to apply
our knowledge gained over a period of years through intense study and keen observation of the
nuances of financial markets and instruments to real life scenarios. We possess expert knowledge of
financial products and markets as evidenced by top notch qualifications earned by us , all in the first
attempt and keep ourselves abreast with the latest happenings and innovations taking place in
financial landscape.
1. Expertise in Portfolio Management, Product optimization, Product performance Analysis, Financial
Reporting/ Planning, Cash Flow Analysis, Ratio Analysis, Budgeting, Forecasting, Mergers &
Acquisition and knowledge of GAAP/ IFRS
2. Possess Strong Financial Modeling skills including DCF, LBO and other techniques. Possess ability to
research all asset classes in a broad range of industries and geographies.
3. Strong equity research, finance, accounting and advisory and assurance experience
4. Expertise in Technical analysis, fundamental analysis, developing trading systems.
5. Conduct in‐depth financial analysis of company financials.
6. Write analytical or trend based reports on companies, sectors or markets.
7. Expert level application in Bloomberg, Thomson Banker, Factset, DataStream, Stock Val, Merger
markets, Reuters Knowledge, Haver Analytics, Factiva, Pack Hedge,
8. Building Excel/VBA based customized tools to perform detailed analysis.
Contact Us: tanay.roy2008@gmail.com
Page 2
3. Summary
At a Glance
Latest Results Industry
Instrumentation & Process
Control
Yearly Quarterly TTM Business Group MNC Associate
September '
Growth June ' 11 Growth June ' 11 Growth Face Value 2
Latest Results 10
Equity shares (in Lacs) 3371.60
EBDITA 1423.34 8.87 252.40 (43.26) 1461.91 0.72
Reported Net
Profit 827.20 (20.83) 154.79 (44.26) 929.83 (0.14) Price 852
Adjusted PAT 868.11 68.13 154.79 (44.26) NA NA
Market Cap(Rs. In Cr) 28726.03
Valuation Matrix Share Holding
Annual TTM Ratio General
Particulars September ' 10 June ' 11 Public
FII Other 12%
3% BFI 2%
Reported P/E 34.73 31.19 5%
3.08 2.52 MF
Price/Sales Per Share
3%
Price/ Book Value 8.26 NA
Dividend Yield(%) 0.59 NA
Earning Yield(%) 2.88 3.21
Promote
Market Cap(Rs. In Cr) 28726.03
r
75%
ROE Analysis
ROE
September ' September ' September ' September ' 40%
Particulars September ' 06 07 08 09 10 30%
20%
Reported PAT / PBT 0.73 0.89 1.10 0.86 0.64
10%
Adjusted PAT / PBT 0.71 0.59 0.45 0.68 0.67 0%
PBT / PBIT 0.98 0.98 0.98 0.98 0.98
PBIT / Sales 0.11 0.09 0.07 0.15 0.14
Sales / Total Assets 1.02 1.33 1.03 0.87 0.82
Total Assets / Net Worth 4.08 3.65 3.88 3.33 3.26
Reported ROE 33% 38% 30% 37% 23% Reported ROE Adjusted ROE
Adjusted ROE 32% 25% 12% 29% 25%
ROE Factors
4.50 40%
4.00 35%
3.50 30%
3.00
25%
2.50
20%
2.00
15%
1.50
1.00 10%
0.50 5%
0.00 0%
September ' 06 September ' 07 September ' 08 September ' 09 September ' 10
Reported ROE Reported PAT / PBT PBT / PBIT
PBIT / Sales Sales / Total Assets Total Assets / Net Worth
Page 3
4. Income Statement
September ' September ' September ' September '
Particulars (Rs. In Cr) September ' 06 07 08 09 10
Net Sales 4515.72 7732.02 8293.33 8396.53 9322.41
Operating Expenses
Material Consumed 1977.46 2296.55 2958.09 2943.52 2972.16
Manufacturing Expenses 1511.12 3998.93 3865.18 3485.78 3920.12
Personnel Expenses 284.01 406.73 448.98 551.06 633.77 Operating Income
Selling Expenses 34.24 45.38 47.02 35.46 63.54
10000.00
Adminstrative Expenses 304.62 355.20 413.27 362.16 438.03 9000.00
Expenses Capitalised 0.00 0.00 0.00 0.00 0.00 8000.00
7000.00
Total Operating Expenses 4111.45 7102.79 7732.54 7377.98 8027.62
6000.00
Operating Profit 404.27 629.23 560.79 1018.55 1294.79 5000.00
Other Income 145.71 105.28 55.79 288.81 128.55 4000.00
EBDITA 549.98 734.51 616.58 1307.36 1423.34 3000.00
2000.00
Depreciation 44.21 49.23 63.73 77.78 101.48
1000.00
Other Write offs 0.00 0.00 0.00 0.00 0.00
0.00
EBIT 505.77 685.28 552.85 1229.58 1321.86
Interest 11.23 11.58 13.27 19.25 22.21
EBT 494.54 673.70 539.58 1210.33 1299.65
Income Tax 145.37 277.68 298.44 387.01 431.54
Adjusted PAT 349.17 396.02 241.14 823.32 868.11 Net Sales Operating Profit EBDITA
Non Recurring Items 17.82 200.53 352.17 221.52 (40.91)
Other Non Cash adjustments (6.89) 0.00 0.00 0.00 0.00
Reported Net Profit 360.10 596.55 593.31 1044.84 827.20
Equity Dividend 64.06 80.92 101.15 168.58 168.58
Preference Dividend 0.00 0.00 0.00 0.00 0.00
Dividend Tax 8.98 13.75 17.19 28.65 28.00
Retained Earnings 287.06 501.88 474.97 847.61 630.62
Profit Levels Total Income Break‐up
1600.00
Total Operating Expenses Depreciation
1400.00 Other Write offs Interest
1200.00 Income Tax Adjusted PAT
1000.00
800.00
9%
600.00 5%
0%
1%
400.00
200.00
0.00
September ' September ' September ' September ' September '
06 07 08 09 10
85%
Operating Profit EBDITA EBIT
EBT Adjusted PAT
Page 4
5. Balance Sheet
September ' September ' September ' September '
Particulars (Rs. In Cr) September ' 06 07 08 09 10
SOURCES OF FUNDS
Owner's Fund
Equity Share Capital 33.72 33.72 67.43 67.43 67.43
Share Application Money 0.00 0.00 0.00 0.00 0.00
Preference Share Capital 0.00 0.00 0.00 0.00 0.00
Reserves & Surplus 1051.80 1555.68 2000.25 2847.87 3409.11
Total Owners fund 1085.52 1589.40 2067.68 2915.30 3476.54
Loan Funds
Secured Loans 0.00 0.00 0.00 0.00 0.00
Unsecured Loans 2.00 1.53 1.06 0.59 0.24
Total Loan fund 2.00 1.53 1.06 0.59 0.24
Capital Structure
Total 1087.52 1590.93 2068.74 2915.89 3476.78
4000.00
USES OF FUNDS
Fixed Assets 3500.00
Gross Block 647.29 870.12 991.10 1134.78 1354.89
3000.00
Less : Revaluation Reserve 1.57 1.49 1.40 1.32 1.23
Less : Accumulated 2500.00
Depreciation 385.18 406.38 433.93 505.28 620.90
Net Block 260.54 462.25 555.77 628.18 732.76 2000.00
Capital Work‐in‐progress 154.16 93.29 87.01 105.70 246.52
1500.00
Investments 463.97 467.59 523.65 476.97 388.46
Net Current Assets 1000.00
Current Assets, Loans &
Advances 3550.62 4775.67 6863.69 8485.34 9967.42 500.00
Less : Current Liabilities &
0.00
Provisions 3341.78 4207.89 5961.37 6780.31 7858.37
Total Net Current Assets 208.84 567.78 902.32 1705.03 2109.05
Miscellaneous expenses not
written 0.00 0.00 0.00 0.00 0.00
Total 1087.51 1590.91 2068.75 2915.88 3476.79
Note :
Total Owners fund Total Loan fund
Book Value of Unquoted
Investments 463.96 467.58 523.64 476.96 388.46
Market Value of Quoted
Investments 0.07 0.06 0.04 0.04 0.00
Contingent liabilities 122.83 157.89 147.52 162.20 272.34
Number of Equity shares
outstanding (in Lacs) 1685.80 1685.80 3371.60 3371.60 3371.60
Sources of Capital Application of capital
Total Loan
fund
0%
Net Block Capital
21% Work‐in‐
progress
7%
Total Net
Current Assets
Investments
61%
Total Owners 11%
fund
100%
Page 5
6. Cash Flow Statement
September ' September ' September ' September '
Particulars (Rs. In Cr) September ' 06 07 08 09 10
Profit Before Tax 512.11 874.22 891.77 1431.86 1258.75
Net CashFlow‐Operating
Net Cash Flow
Activity 770.63 (396.08) 491.69 346.84 1001.18
Net Cash Used In Investing
Activity (280.52) (1.74) (29.92) 214.00 (441.30)
214.00
NetCash Used in Fin. Activity
(39.95) (73.55) (97.08) (118.75) (200.71) 770.63 491.69
346.84 1001.18
Net Inc/Dec In Cash And
Equivlnt 450.17 (471.37) 364.69 442.09 359.18 (29.92) (118.75) (441.30)
(280.52) (97.08)
Cash And Equivalnt Begin of (39.95) (200.71)
Year 489.28 939.44 548.40 1002.81 1494.27 (396.08)
Cash And Equivalnt End Of
Year 939.44 463.62 913.09 1444.90 1853.44 (1.74)
(73.55)
Net CashFlow‐Operating Activity
Net Cash Used In Investing Activity
NetCash Used in Fin. Activity
Quarterly Result
September '
Particulars (Rs. In Cr) June ' 10 10 December ' 10 March ' 11 June ' 11
Sales 2,246.40 3,061.00 2,538.11 3,118.19 2,796.81
Less: Excise 0.00 0.00 0.00 0.00 0.00
Net Sales 2,246.40 3,061.00 2,538.11 3,118.19 2,796.81
Profit Levels
Other Income 0.00 0.00 0.00 0.00 2.07
Total Income 2,246.40 3,061.00 2,538.11 3,118.19 2,798.88
Stock Adjustment (302.87) 57.22 (89.61) (2.82) (185.47)
Raw Material 1,210.72 2,277.41 1,509.77 1,776.71 1,677.24
Power And Fuel 0.00 0.00 0.00 0.00 0.00
Employee Expenses 170.34 180.12 204.02 221.26 232.14
Admin And Selling Expenses 0.00 0.00 0.00 0.00 0.00
Research And Devlopment Expe 0.00 0.00 0.00 0.00 0.00
Expenses Capitalised 0.00 0.00 0.00 0.00 0.00
Other Expeses 926.24 144.34 551.20 678.17 822.57
Total Expenses 2,004.43 2,659.09 2,175.38 2,673.32 2,546.48
EBDITA 241.97 401.91 362.73 444.87 252.40
Provisions Made 0.00 0.00 0.00 0.00 0.00
Depreciation 24.95 31.64 26.56 34.92 40.09
EBIT 217.02 370.27 336.17 409.95 212.31
Interest (18.06) (21.52) (28.96) (13.48) (16.54)
EBT 235.08 391.79 365.13 423.43 228.85
Taxation 78.97 138.21 121.35 145.75 74.06
Net Profit / Loss 156.11 253.58 243.78 277.68 154.79
Extra Ordinary Item 0.00 0.00 0.00 0.00 0.00 EBDITA EBIT
Prior Year Adjustments 0.00 0.00 0.00 0.00 0.00
EBT Net Profit / Loss
Page 6