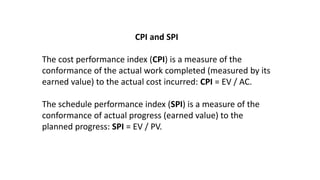
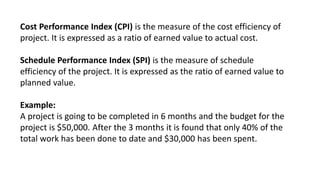
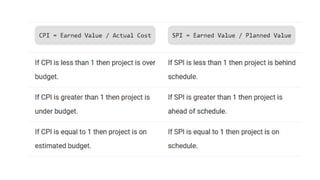
CAPM Exam Study – Session 4
Agenda
• Questions from Asynchronous Content
• Knowledge Areas & Processes
• CPI & SPI
• Critical Path Example
• Q&A
Mapping Knowledge Areas to Domains
Copyright © 2017 Techknowledgy, Inc. All Rights Reserved
CPI and SPI
The cost performance index (CPI) is a measure of the
conformance of the actual work completed (measured by its
earned value) to the actual cost incurred: CPI = EV / AC.
The schedule performance index (SPI) is a measure of the
conformance of actual progress (earned value) to the
planned progress: SPI = EV / PV.
SV = EV – PV
The variation in a project's actual schedule, as compared to its
planned schedule, is measured by its schedule variance (SV),
which measures the difference between the earned value (EV)
(the value of work actually performed) and the planned value
(PV), so SV = EV – PV.
However, SV is expressed as a monetary unit (e.g., in dollars),
which makes it difficult to understand as a variance in the
schedule, which should presumably be measured in time units,
such as days or months.
Cost Performance Index (CPI) is the measure of the cost efficiency of
project. It is expressed as a ratio of earned value to actual cost.
Schedule Performance Index (SPI) is the measure of schedule
efficiency of the project. It is expressed as the ratio of earned value to
planned value.
Example:
A project is going to be completed in 6 months and the budget for the
project is $50,000. After the 3 months it is found that only 40% of the
total work has been done to date and $30,000 has been spent.
Actual Cost = $30,000
Planned Value = 50% of $50,000 = $25,000
Earned Value = 40% of $50,000 = $20,000
Cost Performance Index = Earned Value / Actual Cost
= $20,000 / $30,000 = 0.67
Schedule Performance Index (SPI) = Earned Value / Planned Value
= $20,000 / $25,000 = 0.8
A project is going to be completed in 6 months
and the budget for the project is $50,000. After
the 3 months it is found that only 40% of the
total work has been done to date and $30,000
has been spent.
Conclusion: It can be concluded that the project is over budget and behind schedule.
Critical Path
Activities for this project are as below
(output from Define Activities process):
1. Assemble two-tier bridge (10)
2. Join winding tracks (20)
3. Assemble and add train station (5)
4. Place standalone items around (10)
5. Assemble and add construction site (2)
6. Join train engine and bogies (4)
7. Place the train on the track (2)
8. Start the engine and let it chug! (2)
Build a Network Diagram
The network path with longest total duration is the critical
path!
Critical path is the shortest duration required to complete
the project successfully.
Build a Network Diagram
The network path with longest total duration is the critical
path!
Critical path is the shortest duration required to complete
the project successfully.
In our example this is the second
path: A -> B -> C -> D -> G -> H,
which comes to 49 minutes.
CAPM study session 4

CAPM study session 4

  • 1.
    CAPM Exam Study– Session 4 Agenda • Questions from Asynchronous Content • Knowledge Areas & Processes • CPI & SPI • Critical Path Example • Q&A
  • 2.
    Mapping Knowledge Areasto Domains Copyright © 2017 Techknowledgy, Inc. All Rights Reserved
  • 3.
    CPI and SPI Thecost performance index (CPI) is a measure of the conformance of the actual work completed (measured by its earned value) to the actual cost incurred: CPI = EV / AC. The schedule performance index (SPI) is a measure of the conformance of actual progress (earned value) to the planned progress: SPI = EV / PV.
  • 4.
    SV = EV– PV The variation in a project's actual schedule, as compared to its planned schedule, is measured by its schedule variance (SV), which measures the difference between the earned value (EV) (the value of work actually performed) and the planned value (PV), so SV = EV – PV. However, SV is expressed as a monetary unit (e.g., in dollars), which makes it difficult to understand as a variance in the schedule, which should presumably be measured in time units, such as days or months.
  • 5.
    Cost Performance Index(CPI) is the measure of the cost efficiency of project. It is expressed as a ratio of earned value to actual cost. Schedule Performance Index (SPI) is the measure of schedule efficiency of the project. It is expressed as the ratio of earned value to planned value. Example: A project is going to be completed in 6 months and the budget for the project is $50,000. After the 3 months it is found that only 40% of the total work has been done to date and $30,000 has been spent.
  • 6.
    Actual Cost =$30,000 Planned Value = 50% of $50,000 = $25,000 Earned Value = 40% of $50,000 = $20,000 Cost Performance Index = Earned Value / Actual Cost = $20,000 / $30,000 = 0.67 Schedule Performance Index (SPI) = Earned Value / Planned Value = $20,000 / $25,000 = 0.8 A project is going to be completed in 6 months and the budget for the project is $50,000. After the 3 months it is found that only 40% of the total work has been done to date and $30,000 has been spent.
  • 7.
    Actual Cost =$30,000 Planned Value = 50% of $50,000 = $25,000 Earned Value = 40% of $50,000 = $20,000 Cost Performance Index = Earned Value / Actual Cost = $20,000 / $30,000 = 0.67 Schedule Performance Index (SPI) = Earned Value / Planned Value = $20,000 / $25,000 = 0.8 A project is going to be completed in 6 months and the budget for the project is $50,000. After the 3 months it is found that only 40% of the total work has been done to date and $30,000 has been spent. Conclusion: It can be concluded that the project is over budget and behind schedule.
  • 10.
    Critical Path Activities forthis project are as below (output from Define Activities process): 1. Assemble two-tier bridge (10) 2. Join winding tracks (20) 3. Assemble and add train station (5) 4. Place standalone items around (10) 5. Assemble and add construction site (2) 6. Join train engine and bogies (4) 7. Place the train on the track (2) 8. Start the engine and let it chug! (2)
  • 11.
  • 12.
  • 13.
  • 14.
  • 15.
    Build a NetworkDiagram The network path with longest total duration is the critical path! Critical path is the shortest duration required to complete the project successfully.
  • 16.
    Build a NetworkDiagram The network path with longest total duration is the critical path! Critical path is the shortest duration required to complete the project successfully. In our example this is the second path: A -> B -> C -> D -> G -> H, which comes to 49 minutes.