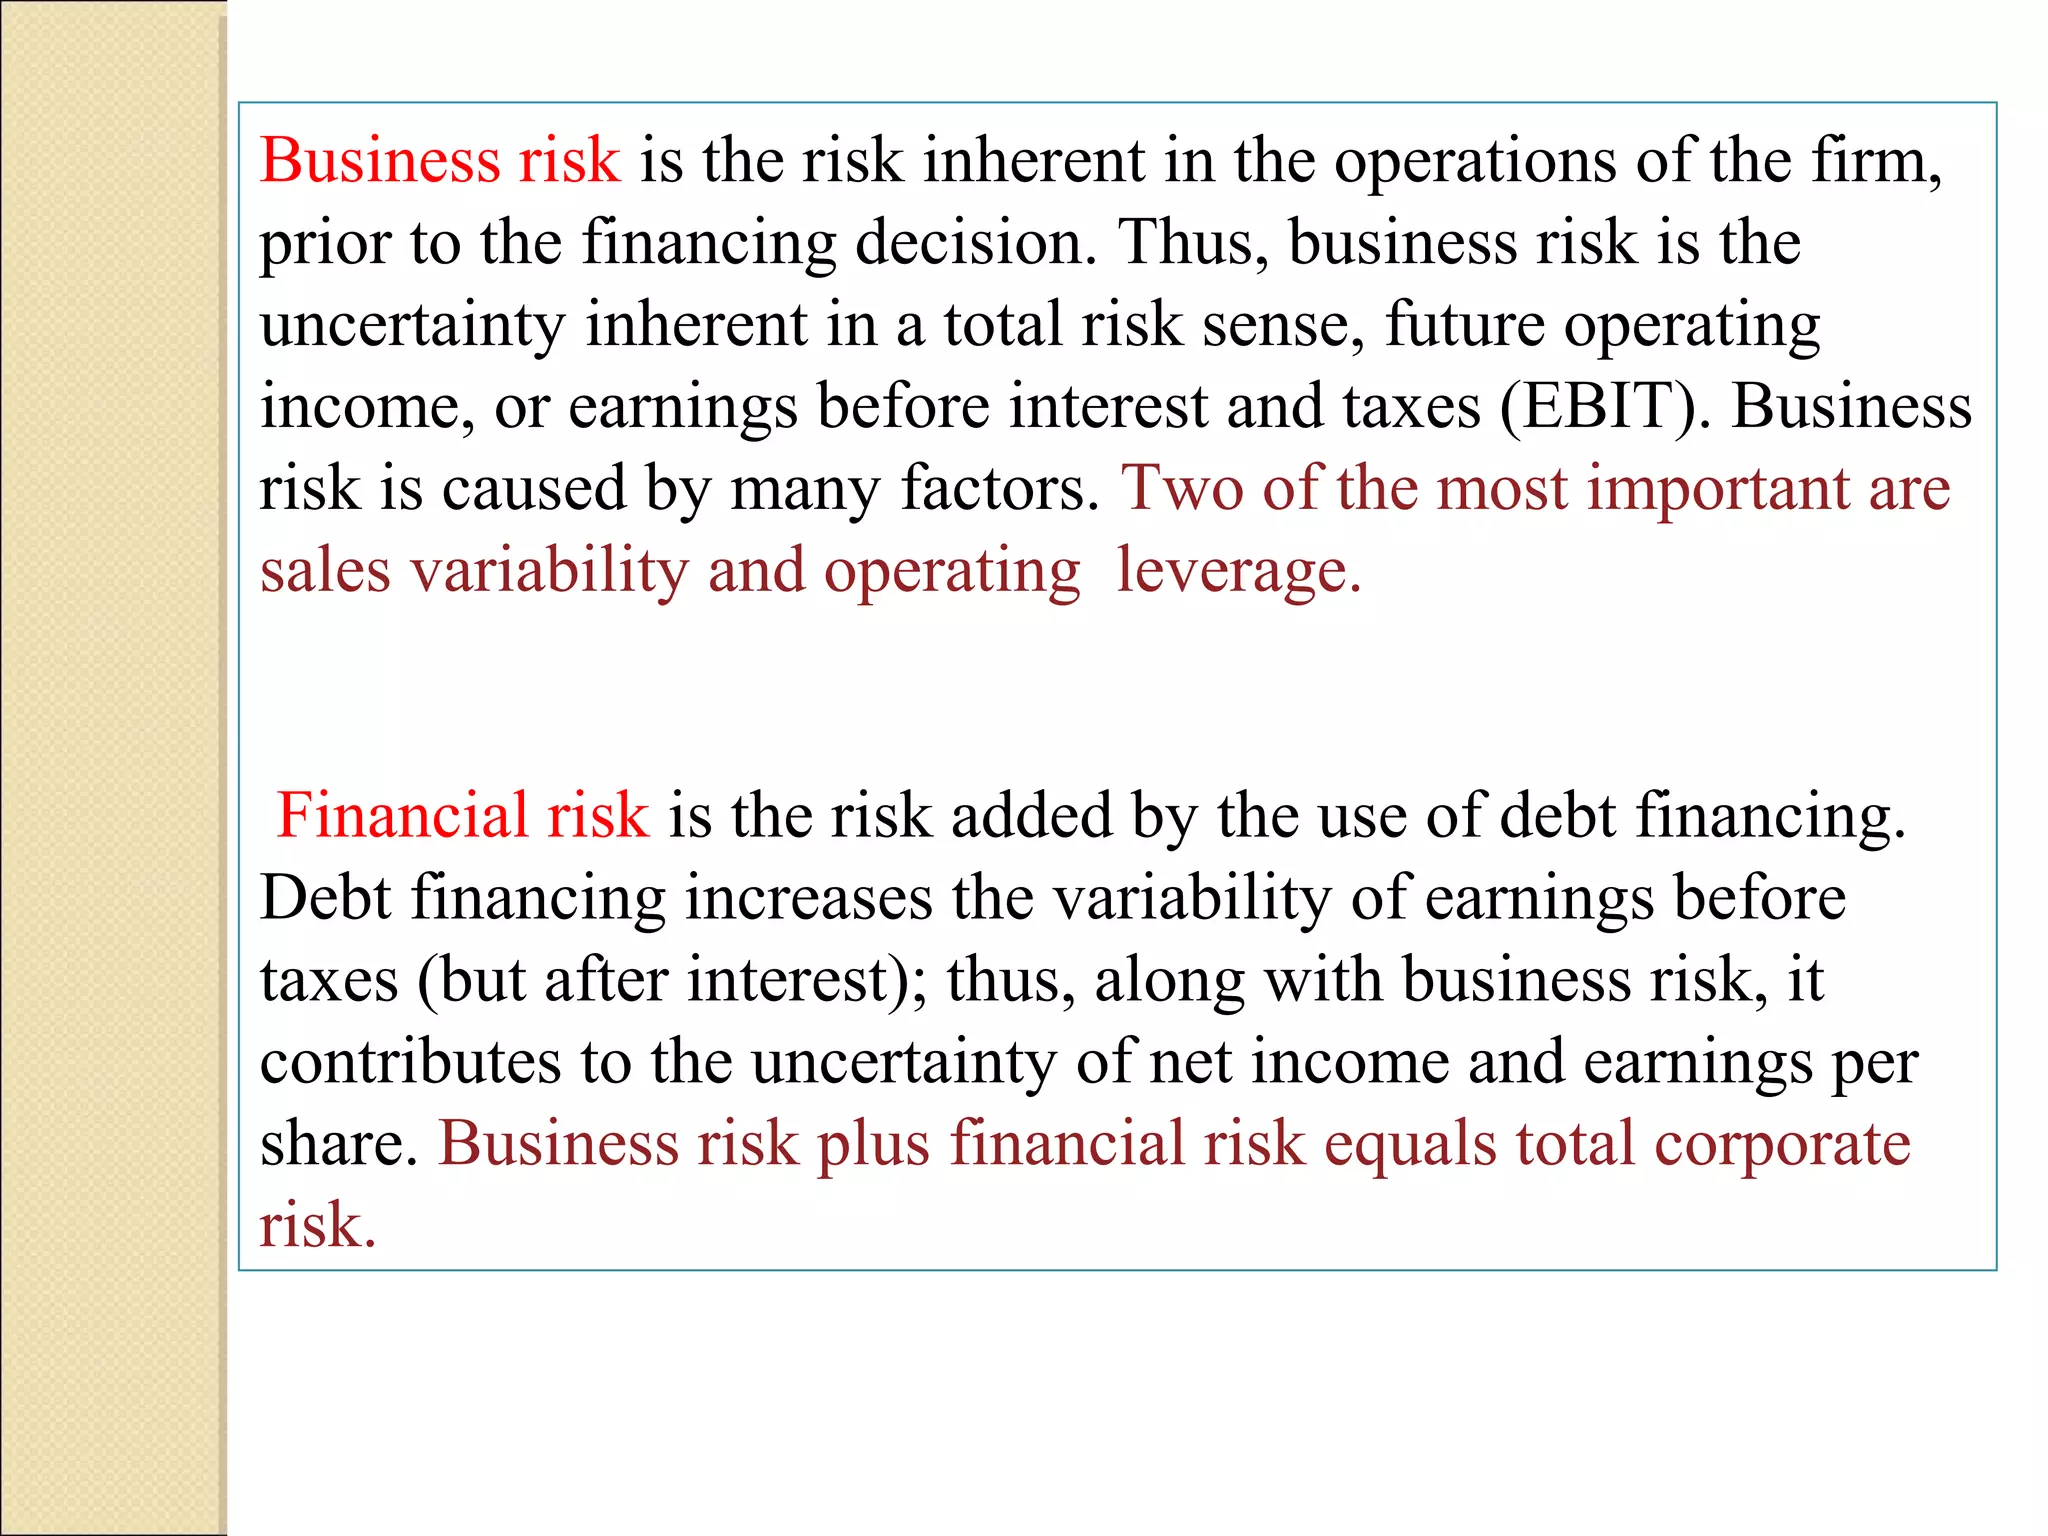
CAPITAL STRUCTURE
     DECISION
Business risk is the risk inherent in the operations of the firm,
prior to the financing decision. Thus, business risk is the
uncertainty inherent in a total risk sense, future operating
income, or earnings before interest and taxes (EBIT). Business
risk is caused by many factors. Two of the most important are
sales variability and operating leverage.


 Financial risk is the risk added by the use of debt financing.
Debt financing increases the variability of earnings before
taxes (but after interest); thus, along with business risk, it
contributes to the uncertainty of net income and earnings per
share. Business risk plus financial risk equals total corporate
risk.
OUTLINE
    ..
•
    • EBIT – EPS Analysis
    •    ROI – ROE Analysis
    •    Ratio Analysis
    •    Leverage Analysis
    •    Cash Flow Analysis
    •    Comparative Analysis
    •    Guidelines for Capital Structure Planning
    •    Capital Structure Policies in Practice
EBIT – EPS ANALYSIS


The relationship between EBIT and EPS is as follows:


                         (EBIT – I) (1 – t)
              EPS =           n
BREAK-EVEN EBIT LEVEL/POINT OF
                           INDIFFERENCE

There is a point of EBIT at which two Financing options
provide the same amount of EPS for shareholders. It can be
derived from the following equation:

(EBIT*-I1) (1-T)            =          (EBIT*-I2) (1-T)
         n1                                      n2


If the level of EBIT for the point of indifference is relatively low and managers
are fairly confident of achieving that level, then the firm may decide to use an
increased level of leverage to maximize EPS, which in turn maximises
shareholders’ wealth. Otherwise it is advisable to decide the financing structure
in favour of equity.
ROI – ROE ANALYSIS

ROE = [ROI + (ROI – r) D/E] (1 – t)

where ROE = return on equity

         ROI = return on investment

          r   = cost of debt

         D/E = debt-equity ratio

          t    = tax rate
LEVERAGE ANALYSIS


• There are two kinds of leverage, viz., operating leverage and
  financial leverage.

• Operating leverage arises from the firm’s fixed operating

  costs. Rent Expenditure, Insurance expenditure, etc.

• Financial leverage arises from the firm’s fixed financing

 costs. Interest on Debt
INCOME STATEMENT FORMAT


            Sales
Operating        Less: Variable costs
leverage         Less: Fixed operating costs
            Contribution before interest and tax
                 Less: Interest on debt             Total
            Profit before tax
                                                   leverage
Financial        Less: Tax
leverage    Profit after tax
                 Less: Preferred dividend
            Equity earnings
CERTAIN RELATIONSHIPS

PBIT     = Q (P – V) – F

PAT      = (PBIT – I) ( 1 – T)

                  (PBIT – I) (1 – T) – Dp
EPS      =
                            N

         = [Q (P – V) – F – I] (1 – T) – Dp

                            N
OPERATING LEVERAGE

The sensitivity of profit before interest and taxes (PBIT) to
changes in unit sales is referred to as the degree of operating
leverage (DOL).


             Δ PBIT/PBIT
DOL =
                  ΔQ/Q

            Q (P – V)              Contribution
       =                   =
           Q (P – V) – F       Profit before interest
                                      and tax
FINANCIAL LEVERAGE

The sensitivity of profit before tax (or profit after tax or earnings
per share) to changes in PBIT is referred to as the degree of
financial leverage.
DFL =          Δ PBT / PBT        =         PBIT
             Δ PBIT / PBIT                 PBIT – I


       = Profit before interest and tax
                  Profit before tax
TOTAL LEVERAGE/Combined Leverage

The sensitivity of profit before tax (or profit after tax or earnings
per share) to changes in unit sales is referred to as the degree of
total (or combined) leverage (DTL).

  DTL     =      Δ PBT / PBT         =        Q (P – V)

                   ΔQ/Q                       PBIT – T

                   Contribution
          =
                 Profit before tax
  DTL     = DOL x DFL
Desirability of Financial Leverage
 Summery     of Analysis of Financial Leverage

  ◦ Substitution of Equity with debt enhances earnings for equity
    shareholders, as cheaper debt replaces more expensive equity.

  ◦ As the EPS for shareholders increases, the variability of EPS too
    increases. In effect, this means that the shareholders are exposed
    to greater risk as more and more debt substitutes for equity.

  ◦ It can be concluded that if the level of EBIT is not sufficiently
    large, then it is beneficial to have less debt. The financing option
    with a lower amount of debt provides higher earnings per share.
Capital Structure of firms
 If sales tend to fluctuate widely, then cash flows and the
  ability to service fixed charges will also vary. Such a firm is
  said to have high business risk. Consequently, there is a
  relatively large risk that the firm will be unable to meet its
  fixed charges, and interest payments are fixed charges. As
  a result, firms in unstable industries tend to use less debt
  than those whose sales are subject to only moderate
  fluctuations.
 Public utilities place greater emphasis on long-term debt
  because they have more stable sales and profits as well as
  more fixed assets. Also, utilities have fixed assets which
  can be pledged as collateral.
Cont…..
 Trade   firms use retained earnings to a greater extent,
  probably because these firms are generally smaller and,
  hence, have less access to capital markets.
 Public utilities have lower retained earnings because they
  have high dividend payout ratios and a set of stockholders
  who want dividends.
 Any financial plan today involves predictions of the future
  economic outlook. If these predictions can be made with a
  high degree of confidence, the financial manager can use
  debt funds in his/her operations with greater assurance. The
  burdens of long-term debt can be assumed with greater
  confidence because sales, costs, and profits are less
  vulnerable to fluctuations. Therefore, the ability to meet
  fixed financial obligations is more assured.
RATIO ANALYSIS

• Interest Coverage Ratio
              Earnings before interest and taxes
                Interest on debt
• Cash Flow Coverage Ratio
       EBIT + Depreciation + Other non-cash charges

 Interest on debt   + loan repayment installment
                               (1 – Tax rate)
CASH FLOW ANALYSIS


The key question in assessing the debt capacity of a firm
is whether the probability of default associated with a
certain level of debt is acceptable to the management.
The cash flow analysis establishes the debt capacity by
examining the probability of default.
INVENTORY OF RESOURCES


It would be helpful to supplement cash flow analysis by
estimating potential sources of liquidity available to the firm to
meet possible cash drains. These sources, as suggested by
Gordon Donaldson, may be divided into three categories:


       • Uncommitted reserves
       • Reduction of planned outlays
       • Liquidation of assets
COMPARATIVE ANALYSIS


• A common approach to analysing the capital structure of a
firm is to compare its debt-equity ratio to the average debt-
equity ratio of the industry to which the firm belongs.


• Since the firms in an industry may differ on factors like
operating risk, profitability, and tax status it makes sense to
control for differences in these variables.
GUIDELINES FOR CAPITAL
         STRUCTURE PLANNING

• Avail of the tax advantage of debt
• Preserve flexibility

• Ensure that the total risk exposure is reasonable

• Examine the control implications of alternative financing
  plans

• Subordinate financial policy to corporate strategy

• Mitigate potential agency costs
GUIDELINES FOR CAPITAL
         STRUCTURE PLANNING

• Resort to timing judiciously

• Finance proactively not reactively

• Know the norms of lenders and credit rating agencies

• Issue innovative securities

• Widen the range of financing sources

• Communicate intelligently with investors
CAPITAL STRUCTURE POLICIES

Five common policies are:


   A. No debt should be used

   B. Debt should be employed to a very limited extent

   C. The debt-equity ratio should be maintained around 1:1

   D. The debt-equity ratio should be kept within 2:1

   E. Debt should be tapped to the extent available

Capital structure decision

  • 1.
  • 2.
    Business risk isthe risk inherent in the operations of the firm, prior to the financing decision. Thus, business risk is the uncertainty inherent in a total risk sense, future operating income, or earnings before interest and taxes (EBIT). Business risk is caused by many factors. Two of the most important are sales variability and operating leverage. Financial risk is the risk added by the use of debt financing. Debt financing increases the variability of earnings before taxes (but after interest); thus, along with business risk, it contributes to the uncertainty of net income and earnings per share. Business risk plus financial risk equals total corporate risk.
  • 3.
    OUTLINE .. • • EBIT – EPS Analysis • ROI – ROE Analysis • Ratio Analysis • Leverage Analysis • Cash Flow Analysis • Comparative Analysis • Guidelines for Capital Structure Planning • Capital Structure Policies in Practice
  • 4.
    EBIT – EPSANALYSIS The relationship between EBIT and EPS is as follows: (EBIT – I) (1 – t) EPS = n
  • 5.
    BREAK-EVEN EBIT LEVEL/POINTOF INDIFFERENCE There is a point of EBIT at which two Financing options provide the same amount of EPS for shareholders. It can be derived from the following equation: (EBIT*-I1) (1-T) = (EBIT*-I2) (1-T) n1 n2 If the level of EBIT for the point of indifference is relatively low and managers are fairly confident of achieving that level, then the firm may decide to use an increased level of leverage to maximize EPS, which in turn maximises shareholders’ wealth. Otherwise it is advisable to decide the financing structure in favour of equity.
  • 6.
    ROI – ROEANALYSIS ROE = [ROI + (ROI – r) D/E] (1 – t) where ROE = return on equity ROI = return on investment r = cost of debt D/E = debt-equity ratio t = tax rate
  • 7.
    LEVERAGE ANALYSIS • Thereare two kinds of leverage, viz., operating leverage and financial leverage. • Operating leverage arises from the firm’s fixed operating costs. Rent Expenditure, Insurance expenditure, etc. • Financial leverage arises from the firm’s fixed financing costs. Interest on Debt
  • 8.
    INCOME STATEMENT FORMAT Sales Operating Less: Variable costs leverage Less: Fixed operating costs Contribution before interest and tax Less: Interest on debt Total Profit before tax leverage Financial Less: Tax leverage Profit after tax Less: Preferred dividend Equity earnings
  • 9.
    CERTAIN RELATIONSHIPS PBIT = Q (P – V) – F PAT = (PBIT – I) ( 1 – T) (PBIT – I) (1 – T) – Dp EPS = N = [Q (P – V) – F – I] (1 – T) – Dp N
  • 10.
    OPERATING LEVERAGE The sensitivityof profit before interest and taxes (PBIT) to changes in unit sales is referred to as the degree of operating leverage (DOL). Δ PBIT/PBIT DOL = ΔQ/Q Q (P – V) Contribution = = Q (P – V) – F Profit before interest and tax
  • 11.
    FINANCIAL LEVERAGE The sensitivityof profit before tax (or profit after tax or earnings per share) to changes in PBIT is referred to as the degree of financial leverage. DFL = Δ PBT / PBT = PBIT Δ PBIT / PBIT PBIT – I = Profit before interest and tax Profit before tax
  • 12.
    TOTAL LEVERAGE/Combined Leverage Thesensitivity of profit before tax (or profit after tax or earnings per share) to changes in unit sales is referred to as the degree of total (or combined) leverage (DTL). DTL = Δ PBT / PBT = Q (P – V) ΔQ/Q PBIT – T Contribution = Profit before tax DTL = DOL x DFL
  • 13.
    Desirability of FinancialLeverage  Summery of Analysis of Financial Leverage ◦ Substitution of Equity with debt enhances earnings for equity shareholders, as cheaper debt replaces more expensive equity. ◦ As the EPS for shareholders increases, the variability of EPS too increases. In effect, this means that the shareholders are exposed to greater risk as more and more debt substitutes for equity. ◦ It can be concluded that if the level of EBIT is not sufficiently large, then it is beneficial to have less debt. The financing option with a lower amount of debt provides higher earnings per share.
  • 14.
    Capital Structure offirms  If sales tend to fluctuate widely, then cash flows and the ability to service fixed charges will also vary. Such a firm is said to have high business risk. Consequently, there is a relatively large risk that the firm will be unable to meet its fixed charges, and interest payments are fixed charges. As a result, firms in unstable industries tend to use less debt than those whose sales are subject to only moderate fluctuations.  Public utilities place greater emphasis on long-term debt because they have more stable sales and profits as well as more fixed assets. Also, utilities have fixed assets which can be pledged as collateral.
  • 15.
    Cont…..  Trade firms use retained earnings to a greater extent, probably because these firms are generally smaller and, hence, have less access to capital markets.  Public utilities have lower retained earnings because they have high dividend payout ratios and a set of stockholders who want dividends.  Any financial plan today involves predictions of the future economic outlook. If these predictions can be made with a high degree of confidence, the financial manager can use debt funds in his/her operations with greater assurance. The burdens of long-term debt can be assumed with greater confidence because sales, costs, and profits are less vulnerable to fluctuations. Therefore, the ability to meet fixed financial obligations is more assured.
  • 16.
    RATIO ANALYSIS • InterestCoverage Ratio Earnings before interest and taxes Interest on debt • Cash Flow Coverage Ratio EBIT + Depreciation + Other non-cash charges Interest on debt + loan repayment installment (1 – Tax rate)
  • 17.
    CASH FLOW ANALYSIS Thekey question in assessing the debt capacity of a firm is whether the probability of default associated with a certain level of debt is acceptable to the management. The cash flow analysis establishes the debt capacity by examining the probability of default.
  • 18.
    INVENTORY OF RESOURCES Itwould be helpful to supplement cash flow analysis by estimating potential sources of liquidity available to the firm to meet possible cash drains. These sources, as suggested by Gordon Donaldson, may be divided into three categories: • Uncommitted reserves • Reduction of planned outlays • Liquidation of assets
  • 19.
    COMPARATIVE ANALYSIS • Acommon approach to analysing the capital structure of a firm is to compare its debt-equity ratio to the average debt- equity ratio of the industry to which the firm belongs. • Since the firms in an industry may differ on factors like operating risk, profitability, and tax status it makes sense to control for differences in these variables.
  • 20.
    GUIDELINES FOR CAPITAL STRUCTURE PLANNING • Avail of the tax advantage of debt • Preserve flexibility • Ensure that the total risk exposure is reasonable • Examine the control implications of alternative financing plans • Subordinate financial policy to corporate strategy • Mitigate potential agency costs
  • 21.
    GUIDELINES FOR CAPITAL STRUCTURE PLANNING • Resort to timing judiciously • Finance proactively not reactively • Know the norms of lenders and credit rating agencies • Issue innovative securities • Widen the range of financing sources • Communicate intelligently with investors
  • 22.
    CAPITAL STRUCTURE POLICIES Fivecommon policies are: A. No debt should be used B. Debt should be employed to a very limited extent C. The debt-equity ratio should be maintained around 1:1 D. The debt-equity ratio should be kept within 2:1 E. Debt should be tapped to the extent available