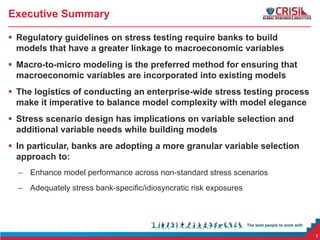
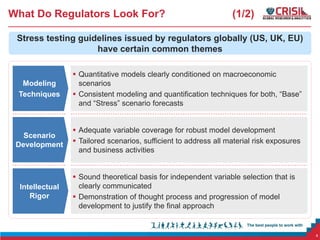
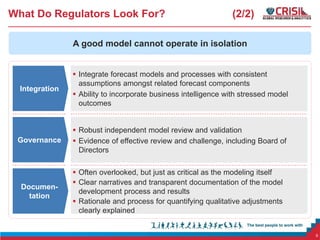
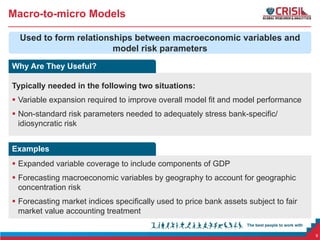
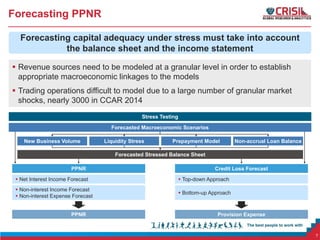
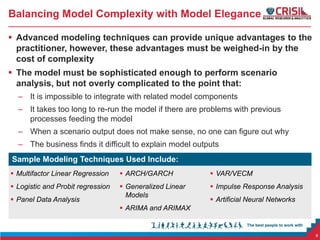
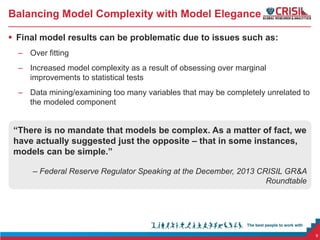
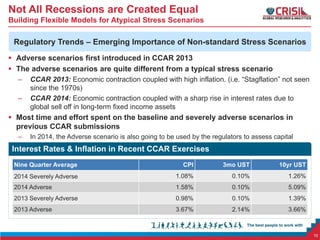
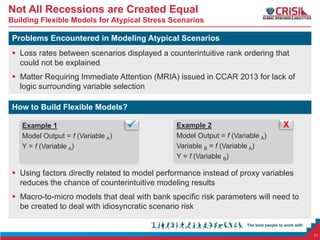
Practical Challenges in Building Effective
Models for Stress Testing

Stress Testing EMEA 2014, London
Presenter: Anshuman Prasad, Director, Risk and Analytics
February 26, 2014
Executive Summary
 Regulatory guidelines on stress testing require banks to build
models that have a greater linkage to macroeconomic variables
 Macro-to-micro modeling is the preferred method for ensuring that
macroeconomic variables are incorporated into existing models
 The logistics of conducting an enterprise-wide stress testing process
make it imperative to balance model complexity with model elegance
 Stress scenario design has implications on variable selection and
additional variable needs while building models
 In particular, banks are adopting a more granular variable selection
approach to:
– Enhance model performance across non-standard stress scenarios
– Adequately stress bank-specific/idiosyncratic risk exposures

2
Agenda
 What Do Regulators Look For?
 Macro-to-micro Models
 Forecasting PPNR
 Balancing Model Complexity with Model Elegance
 Not All Recessions Are Created Equal – Building Flexible Models for
Atypical Stress Scenarios

3
What Do Regulators Look For?

(1/2)

Stress testing guidelines issued by regulators globally (US, UK, EU)
have certain common themes

Modeling
Techniques

 Quantitative models clearly conditioned on macroeconomic
scenarios
 Consistent modeling and quantification techniques for both, “Base”
and “Stress” scenario forecasts

Scenario
Development

 Adequate variable coverage for robust model development
 Tailored scenarios, sufficient to address all material risk exposures
and business activities

Intellectual
Rigor

 Sound theoretical basis for independent variable selection that is
clearly communicated
 Demonstration of thought process and progression of model
development to justify the final approach

4
What Do Regulators Look For?

(2/2)

A good model cannot operate in isolation

Integration

 Integrate forecast models and processes with consistent
assumptions amongst related forecast components
 Ability to incorporate business intelligence with stressed model
outcomes

Governance

 Robust independent model review and validation
 Evidence of effective review and challenge, including Board of
Directors

Documentation

 Often overlooked, but just as critical as the modeling itself
 Clear narratives and transparent documentation of the model
development process and results
 Rationale and process for quantifying qualitative adjustments
clearly explained

5
Macro-to-micro Models
Used to form relationships between macroeconomic variables and
model risk parameters
Why Are They Useful?
Typically needed in the following two situations:
 Variable expansion required to improve overall model fit and model performance
 Non-standard risk parameters needed to adequately stress bank-specific/
idiosyncratic risk
Examples
 Expanded variable coverage to include components of GDP
 Forecasting macroeconomic variables by geography to account for geographic
concentration risk
 Forecasting market indices specifically used to price bank assets subject to fair
market value accounting treatment
6
Forecasting PPNR
Forecasting capital adequacy under stress must take into account
the balance sheet and the income statement
 Revenue sources need to be modeled at a granular level in order to establish
appropriate macroeconomic linkages to the models
 Trading operations difficult to model due to a large number of granular market
shocks, nearly 3000 in CCAR 2014
Stress Testing
Forecasted Macroeconomic Scenarios
New Business Volume

Liquidity Stress

Prepayment Model

Non-accrual Loan Balance

Forecasted Stressed Balance Sheet
PPNR

Credit Loss Forecast

 Net Interest Income Forecast

 Top-down Approach

 Non-interest Income Forecast
 Non-interest Expense Forecast

 Bottom-up Approach

PPNR

Provision Expense

7
Balancing Model Complexity with Model Elegance
 Advanced modeling techniques can provide unique advantages to the
practitioner, however, these advantages must be weighed-in by the
cost of complexity
 The model must be sophisticated enough to perform scenario
analysis, but not overly complicated to the point that:
– It is impossible to integrate with related model components
– It takes too long to re-run the model if there are problems with previous
processes feeding the model
– When a scenario output does not make sense, no one can figure out why
– The business finds it difficult to explain model outputs
Sample Modeling Techniques Used Include:
 Multifactor Linear Regression

 ARCH/GARCH

 VAR/VECM

 Logistic and Probit regression

 Generalized Linear
Models

 Impulse Response Analysis

 Panel Data Analysis

 Artificial Neural Networks

 ARIMA and ARIMAX

8
Balancing Model Complexity with Model Elegance
 Final model results can be problematic due to issues such as:
– Over fitting
– Increased model complexity as a result of obsessing over marginal
improvements to statistical tests
– Data mining/examining too many variables that may be completely unrelated to
the modeled component

“There is no mandate that models be complex. As a matter of fact, we
have actually suggested just the opposite – that in some instances,
models can be simple.”
– Federal Reserve Regulator Speaking at the December, 2013 CRISIL GR&A
Roundtable

9
Not All Recessions are Created Equal
Building Flexible Models for Atypical Stress Scenarios

Regulatory Trends – Emerging Importance of Non-standard Stress Scenarios
 Adverse scenarios first introduced in CCAR 2013
 The adverse scenarios are quite different from a typical stress scenario
–
–

CCAR 2013: Economic contraction coupled with high inflation. (i.e. “Stagflation” not seen
since the 1970s)
CCAR 2014: Economic contraction coupled with a sharp rise in interest rates due to
global sell off in long-term fixed income assets

 Most time and effort spent on the baseline and severely adverse scenarios in
previous CCAR submissions
–

In 2014, the Adverse scenario is also going to be used by the regulators to assess capital

Interest Rates & Inflation in Recent CCAR Exercises
Nine Quarter Average

CPI

3mo UST

10yr UST

2014 Severely Adverse

1.08%

0.10%

1.26%

2014 Adverse

1.58%

0.10%

5.09%

2013 Severely Adverse

0.98%

0.10%

1.39%

2013 Adverse

3.67%

2.14%

3.66%

10
Not All Recessions are Created Equal
Building Flexible Models for Atypical Stress Scenarios

Problems Encountered in Modeling Atypical Scenarios
 Loss rates between scenarios displayed a counterintuitive rank ordering that
could not be explained

 Matter Requiring Immediate Attention (MRIA) issued in CCAR 2013 for lack of
logic surrounding variable selection
How to Build Flexible Models?
Example 1
Model Output = f (Variable A)
Y = f (Variable A)



Example 2
Model Output = f (Variable A)
Variable B = f (Variable A)
Y = f (Variable B)

X

 Using factors directly related to model performance instead of proxy variables
reduces the chance of counterintuitive modeling results
 Macro-to-micro models that deal with bank specific risk parameters will need to
be created to deal with idiosyncratic scenario risk

11
www.crisil.com/gra
Not All Recessions are Created Equal
Building Flexible Models for Atypical Stress Scenarios

Economic Output (Real GDP)

CCAR Scenarios at A Glance
2013 Adverse Scenario
 More severe than all but two
recessions in terms of duration
 High interest rates and inflation

2014 Adverse Scenario
 Smaller peak-to-trough decline
in GDP but still very severe
relative to historical recessions

 Atypical rise in interest rates on
the long end of the yield curve

Interest Rates & Inflation
Nine Quarter Average

CPI

3mo UST

10yr UST

2014 Severely Adverse

1.08%

0.10%

1.26%

2014 Adverse

1.58%

0.10%

5.09%

2013 Severely Adverse

0.98%

0.10%

1.39%

2013 Adverse

3.67%

2.14%

3.66%

13
Annexure: UK Versus US Stress Tests
The final shape of UK stress tests yet to be finalized, but the proposed
framework has more similarities than differences with the US CCAR & DFAST
requirements – particularly with regard to scenario design
Both Stress Testing Frameworks Require Two Sets of Scenarios
 Common baseline and stress
scenarios

1

‒ Applied across all bank participants
‒ Additional variables often required

 Internally generated scenarios

2

‒ Scenarios designed individually by
each bank
‒ Internal scenarios would typically result
in higher losses than common stress
scenarios

Risk Factors Included in Common and Internal Scenarios
Bank-specific/
Idiosyncratic Risk

Common Baseline
& Stress Scenarios

Systemic
Risk

Total Risk
Exposure
=
Systemic
Risk
+
Idiosyncratic
Risk

Internally
Generated Bespoke
Scenarios

14

CRISIL GR&A - EMEA Stress Testing

  • 1.
    Practical Challenges inBuilding Effective Models for Stress Testing Stress Testing EMEA 2014, London Presenter: Anshuman Prasad, Director, Risk and Analytics February 26, 2014
  • 2.
    Executive Summary  Regulatoryguidelines on stress testing require banks to build models that have a greater linkage to macroeconomic variables  Macro-to-micro modeling is the preferred method for ensuring that macroeconomic variables are incorporated into existing models  The logistics of conducting an enterprise-wide stress testing process make it imperative to balance model complexity with model elegance  Stress scenario design has implications on variable selection and additional variable needs while building models  In particular, banks are adopting a more granular variable selection approach to: – Enhance model performance across non-standard stress scenarios – Adequately stress bank-specific/idiosyncratic risk exposures 2
  • 3.
    Agenda  What DoRegulators Look For?  Macro-to-micro Models  Forecasting PPNR  Balancing Model Complexity with Model Elegance  Not All Recessions Are Created Equal – Building Flexible Models for Atypical Stress Scenarios 3
  • 4.
    What Do RegulatorsLook For? (1/2) Stress testing guidelines issued by regulators globally (US, UK, EU) have certain common themes Modeling Techniques  Quantitative models clearly conditioned on macroeconomic scenarios  Consistent modeling and quantification techniques for both, “Base” and “Stress” scenario forecasts Scenario Development  Adequate variable coverage for robust model development  Tailored scenarios, sufficient to address all material risk exposures and business activities Intellectual Rigor  Sound theoretical basis for independent variable selection that is clearly communicated  Demonstration of thought process and progression of model development to justify the final approach 4
  • 5.
    What Do RegulatorsLook For? (2/2) A good model cannot operate in isolation Integration  Integrate forecast models and processes with consistent assumptions amongst related forecast components  Ability to incorporate business intelligence with stressed model outcomes Governance  Robust independent model review and validation  Evidence of effective review and challenge, including Board of Directors Documentation  Often overlooked, but just as critical as the modeling itself  Clear narratives and transparent documentation of the model development process and results  Rationale and process for quantifying qualitative adjustments clearly explained 5
  • 6.
    Macro-to-micro Models Used toform relationships between macroeconomic variables and model risk parameters Why Are They Useful? Typically needed in the following two situations:  Variable expansion required to improve overall model fit and model performance  Non-standard risk parameters needed to adequately stress bank-specific/ idiosyncratic risk Examples  Expanded variable coverage to include components of GDP  Forecasting macroeconomic variables by geography to account for geographic concentration risk  Forecasting market indices specifically used to price bank assets subject to fair market value accounting treatment 6
  • 7.
    Forecasting PPNR Forecasting capitaladequacy under stress must take into account the balance sheet and the income statement  Revenue sources need to be modeled at a granular level in order to establish appropriate macroeconomic linkages to the models  Trading operations difficult to model due to a large number of granular market shocks, nearly 3000 in CCAR 2014 Stress Testing Forecasted Macroeconomic Scenarios New Business Volume Liquidity Stress Prepayment Model Non-accrual Loan Balance Forecasted Stressed Balance Sheet PPNR Credit Loss Forecast  Net Interest Income Forecast  Top-down Approach  Non-interest Income Forecast  Non-interest Expense Forecast  Bottom-up Approach PPNR Provision Expense 7
  • 8.
    Balancing Model Complexitywith Model Elegance  Advanced modeling techniques can provide unique advantages to the practitioner, however, these advantages must be weighed-in by the cost of complexity  The model must be sophisticated enough to perform scenario analysis, but not overly complicated to the point that: – It is impossible to integrate with related model components – It takes too long to re-run the model if there are problems with previous processes feeding the model – When a scenario output does not make sense, no one can figure out why – The business finds it difficult to explain model outputs Sample Modeling Techniques Used Include:  Multifactor Linear Regression  ARCH/GARCH  VAR/VECM  Logistic and Probit regression  Generalized Linear Models  Impulse Response Analysis  Panel Data Analysis  Artificial Neural Networks  ARIMA and ARIMAX 8
  • 9.
    Balancing Model Complexitywith Model Elegance  Final model results can be problematic due to issues such as: – Over fitting – Increased model complexity as a result of obsessing over marginal improvements to statistical tests – Data mining/examining too many variables that may be completely unrelated to the modeled component “There is no mandate that models be complex. As a matter of fact, we have actually suggested just the opposite – that in some instances, models can be simple.” – Federal Reserve Regulator Speaking at the December, 2013 CRISIL GR&A Roundtable 9
  • 10.
    Not All Recessionsare Created Equal Building Flexible Models for Atypical Stress Scenarios Regulatory Trends – Emerging Importance of Non-standard Stress Scenarios  Adverse scenarios first introduced in CCAR 2013  The adverse scenarios are quite different from a typical stress scenario – – CCAR 2013: Economic contraction coupled with high inflation. (i.e. “Stagflation” not seen since the 1970s) CCAR 2014: Economic contraction coupled with a sharp rise in interest rates due to global sell off in long-term fixed income assets  Most time and effort spent on the baseline and severely adverse scenarios in previous CCAR submissions – In 2014, the Adverse scenario is also going to be used by the regulators to assess capital Interest Rates & Inflation in Recent CCAR Exercises Nine Quarter Average CPI 3mo UST 10yr UST 2014 Severely Adverse 1.08% 0.10% 1.26% 2014 Adverse 1.58% 0.10% 5.09% 2013 Severely Adverse 0.98% 0.10% 1.39% 2013 Adverse 3.67% 2.14% 3.66% 10
  • 11.
    Not All Recessionsare Created Equal Building Flexible Models for Atypical Stress Scenarios Problems Encountered in Modeling Atypical Scenarios  Loss rates between scenarios displayed a counterintuitive rank ordering that could not be explained  Matter Requiring Immediate Attention (MRIA) issued in CCAR 2013 for lack of logic surrounding variable selection How to Build Flexible Models? Example 1 Model Output = f (Variable A) Y = f (Variable A)  Example 2 Model Output = f (Variable A) Variable B = f (Variable A) Y = f (Variable B) X  Using factors directly related to model performance instead of proxy variables reduces the chance of counterintuitive modeling results  Macro-to-micro models that deal with bank specific risk parameters will need to be created to deal with idiosyncratic scenario risk 11
  • 12.
  • 13.
    Not All Recessionsare Created Equal Building Flexible Models for Atypical Stress Scenarios Economic Output (Real GDP) CCAR Scenarios at A Glance 2013 Adverse Scenario  More severe than all but two recessions in terms of duration  High interest rates and inflation 2014 Adverse Scenario  Smaller peak-to-trough decline in GDP but still very severe relative to historical recessions  Atypical rise in interest rates on the long end of the yield curve Interest Rates & Inflation Nine Quarter Average CPI 3mo UST 10yr UST 2014 Severely Adverse 1.08% 0.10% 1.26% 2014 Adverse 1.58% 0.10% 5.09% 2013 Severely Adverse 0.98% 0.10% 1.39% 2013 Adverse 3.67% 2.14% 3.66% 13
  • 14.
    Annexure: UK VersusUS Stress Tests The final shape of UK stress tests yet to be finalized, but the proposed framework has more similarities than differences with the US CCAR & DFAST requirements – particularly with regard to scenario design Both Stress Testing Frameworks Require Two Sets of Scenarios  Common baseline and stress scenarios 1 ‒ Applied across all bank participants ‒ Additional variables often required  Internally generated scenarios 2 ‒ Scenarios designed individually by each bank ‒ Internal scenarios would typically result in higher losses than common stress scenarios Risk Factors Included in Common and Internal Scenarios Bank-specific/ Idiosyncratic Risk Common Baseline & Stress Scenarios Systemic Risk Total Risk Exposure = Systemic Risk + Idiosyncratic Risk Internally Generated Bespoke Scenarios 14