Download to read offline


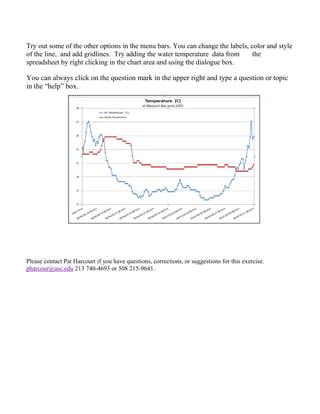

This document provides instructions for creating a line graph in Excel 2007 using temperature data from a datalogger. It describes how to format the data sheet with properly labeled columns, highlight the relevant data, insert a line graph, move and adjust the graph to fit the sheet, define the x and y axes, format axis labels and scales, add a title, and customize features like colors and styles. The full instructions allow users to generate a clear line graph visualizing the relationship between temperature measurements over time.