Downloaded 14 times
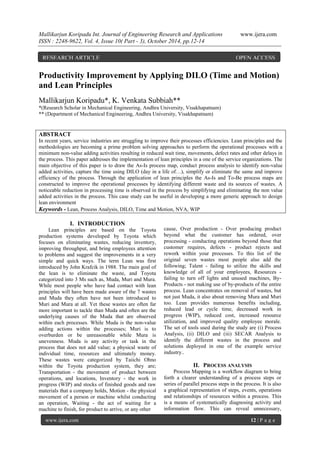
![Mallikarjun Koripadu Int. Journal of Engineering Research and Applications www.ijera.com
ISSN : 2248-9622, Vol. 4, Issue 10( Part - 3), October 2014, pp.12-14
www.ijera.com 14 | P a g e
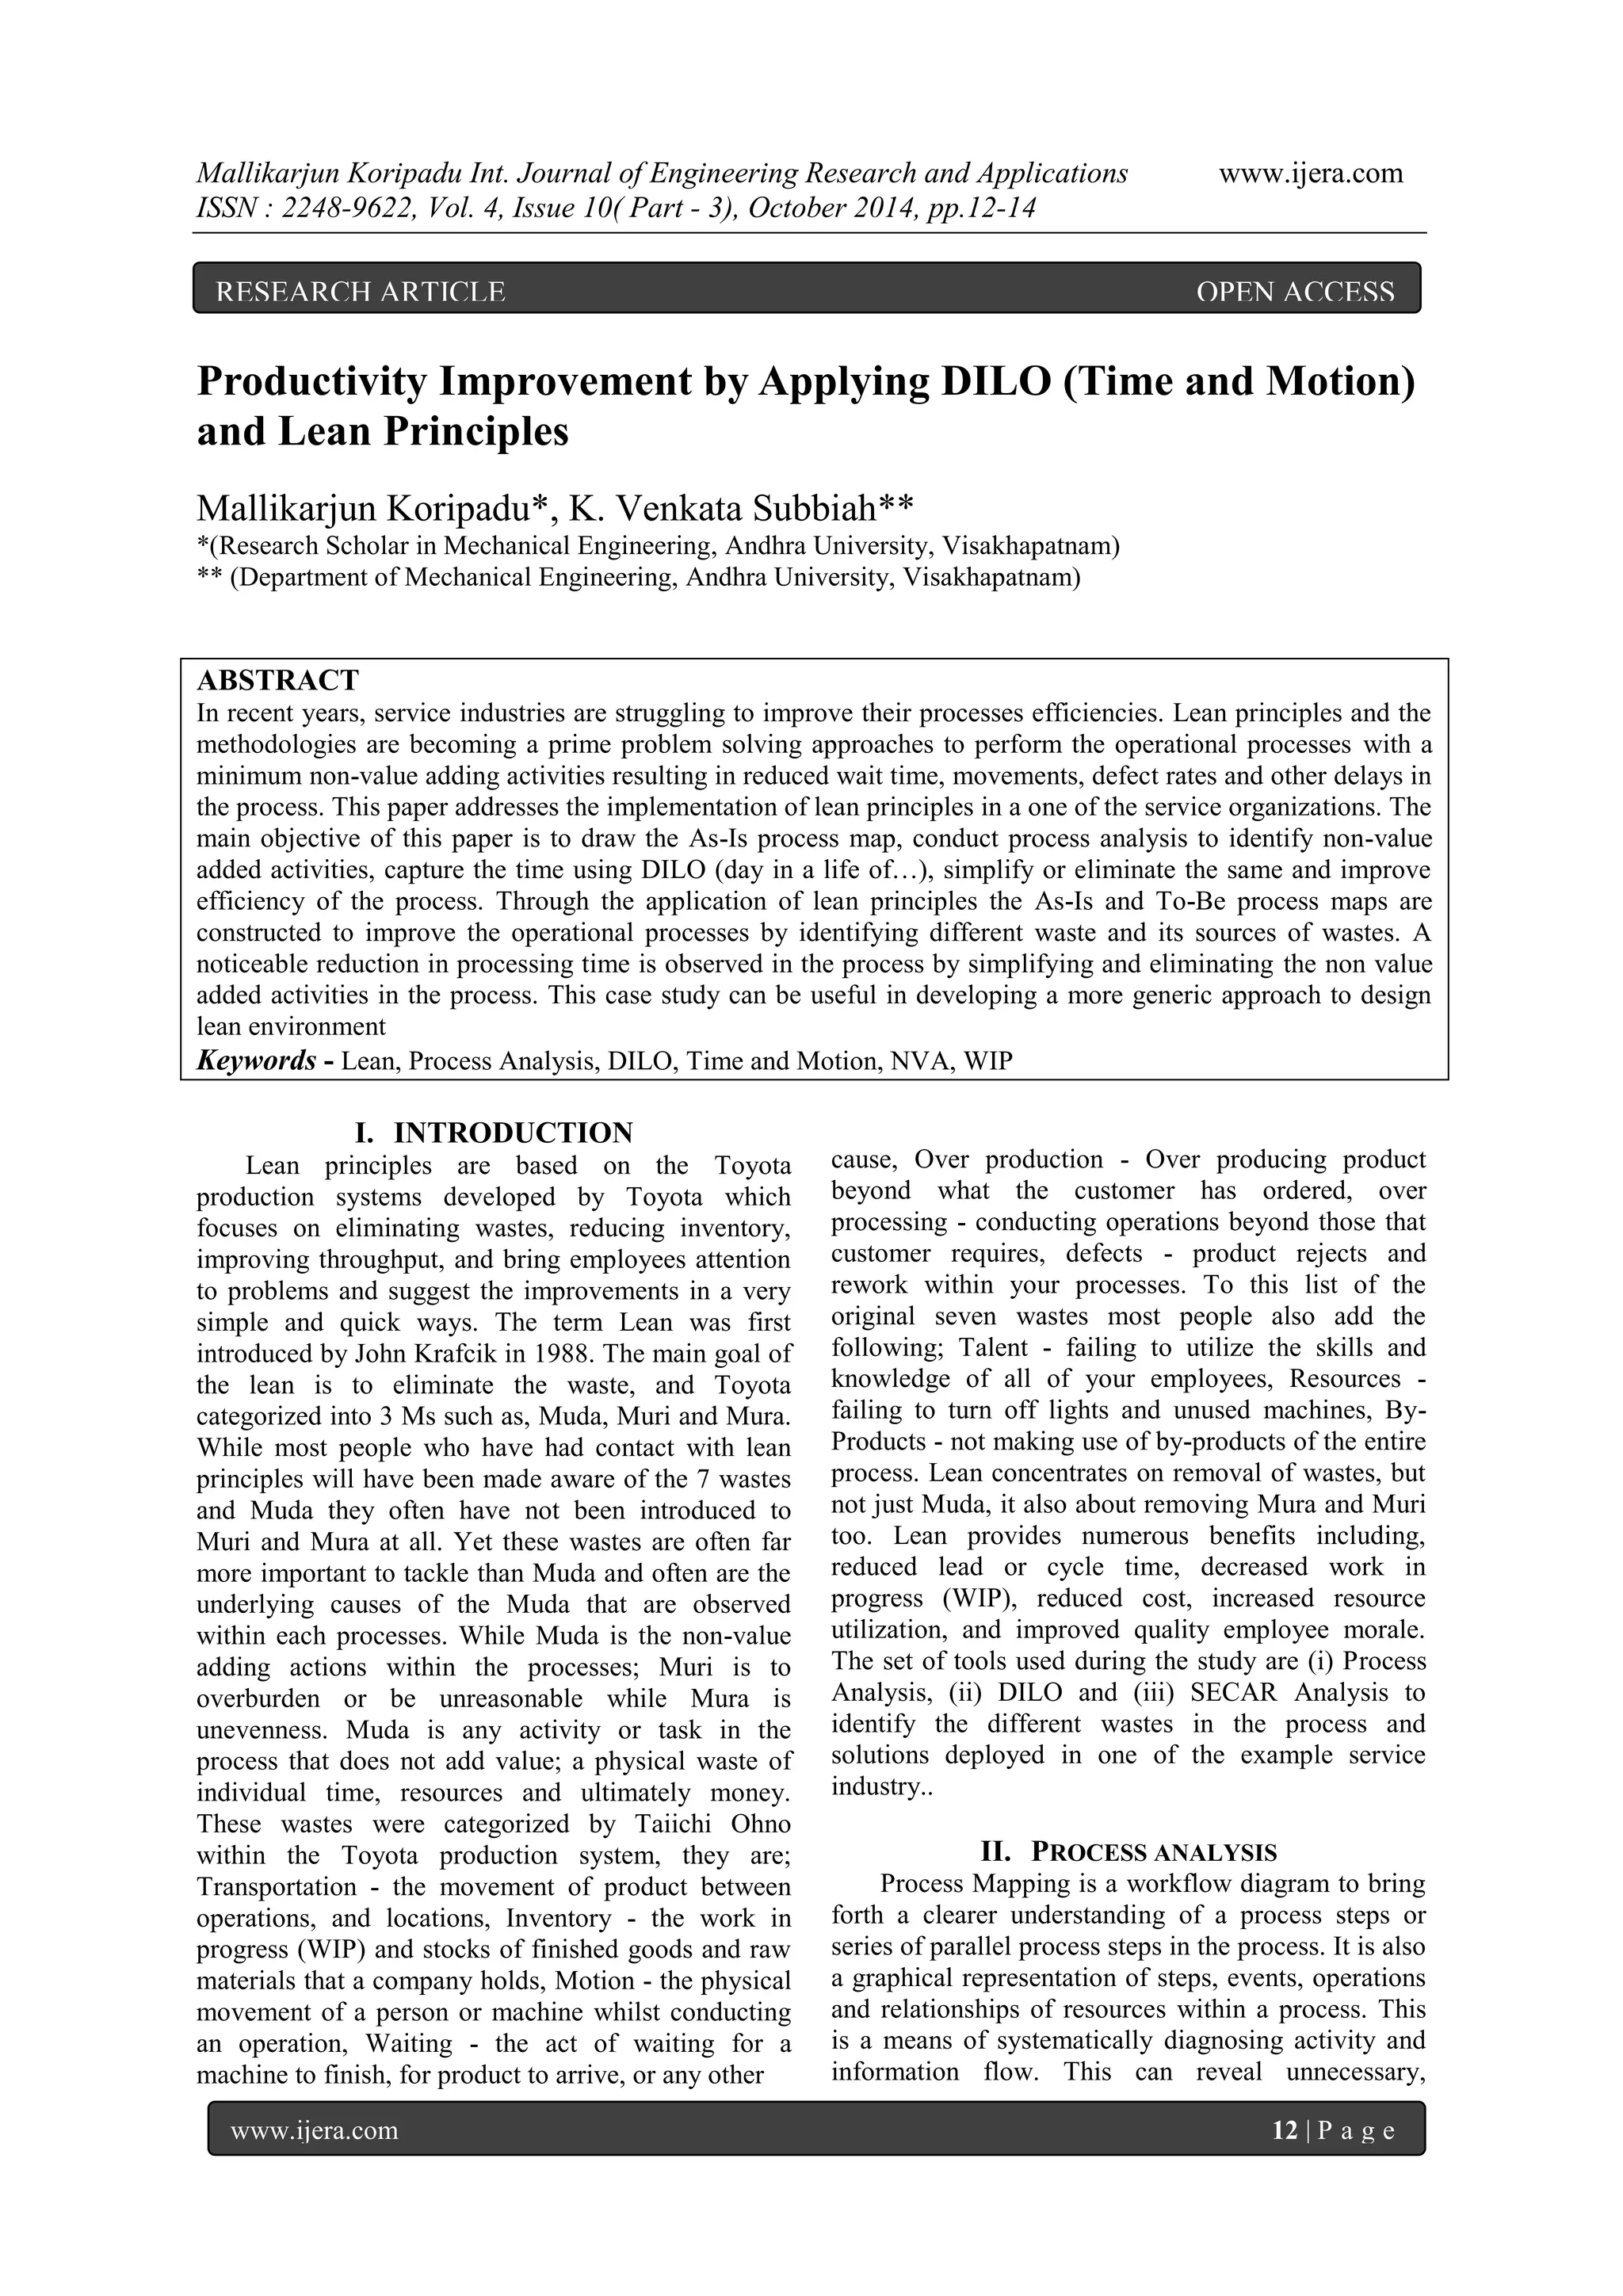
III. OPE ANALYSIS AND FINDINGS
The analysis on the time percentage is computed
as a OPE analysis.
Fig 2: OPE analysis on the value type
It is observed that ~83% of available time is spent on
processing activities, overall, ~62% of available time
is VA and additional ~16% VE and overhead is ~14%
of available time comprising of various breaks. Time
spent on NVA activities is ~5%. To overcome the
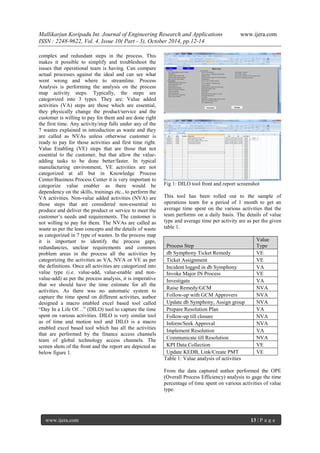
challenge of inefficiencies the improvements are
proposed using the simple SECAR concept. SECAR
is Simplify, Eliminate, Combine, Automate and
Relocate – represents a handful of potential change
levers one may engage, in order to leaner the process.
It is a structure to guide the team through a series of
questions to challenge each process step and generate
improvement ideas based on what the customer
values. Designed few improvement levers such as
wok allocation tool, single source of data collection,
standardization of approval process, introduction of
knowledge articles etc., led to the efficiency gain in
the operations team as depicted in the below process
map.
Fig 3: Process map with the improvements
IV. CONCLUSION
The application of lean principles with DILO
helped a operations team in improving the efficiency.
The present work provided is a practical application
of lean principles helped reduction of overall non
value added activities time. It focuses the
reengineering of operations process by
eliminating/simplifying non value added time and
improving the process efficiency through process
analysis. It may be concluded that the effective use
process analysis and DILO will improve efficiency.
REFERENCES
[1] Alberto Portioli-Staudacher, Marco Tantardini,
(2012) Lean implementation in non-repetitive
companies: a survey and analysis, Volume 11,
Number 4/2012 MANAGEMENT JOURNALS
ISSN 1744-2370Moore, Interval analysis
(Englewood Cliffs, NJ: Prentice-Hall, 1966).
[2] Anand Gurumurthy, Rambabu Kodali, (2009)
"Application of benchmarking for assessing the
lean manufacturing implementation",
Benchmarking: An International Journal, Vol.
16 Iss: 2, pp.274 – 308
[3] Manoj Dora , Dirk Van Goubergen , Maneesh
Kumar , Adrienn Molnar , Xavier Gellynck ,
(2014) "Application of lean practices in small
and medium-sized food enterprises", British
Food Journal, Vol. 116 Iss: 1, pp.125 – 141
[4] Niall Piercy, Nick Rich, (2009) "Lean
transformation in the pure service environment:
the case of the call service centre",
International Journal of Operations &
Production Management, Vol. 29 Iss: 1, pp.54
– 76](https://image.slidesharecdn.com/c410031214-141115041640-conversion-gate01/85/Productivity-Improvement-by-Applying-DILO-Time-and-Motion-and-Lean-Principles-3-320.jpg)

This paper discusses the application of lean principles and the 'Day in a Life Of' (DILO) tool in a service organization to improve process efficiency by identifying and eliminating non-value-adding activities. By conducting process analysis, the study categorizes activities and captures time spent on each, leading to a significant reduction in processing time and enhanced operational performance. The findings suggest that implementing lean strategies can streamline processes, improve efficiency, and ultimately provide a framework applicable to similar organizations.


