Download as PDF, PPTX
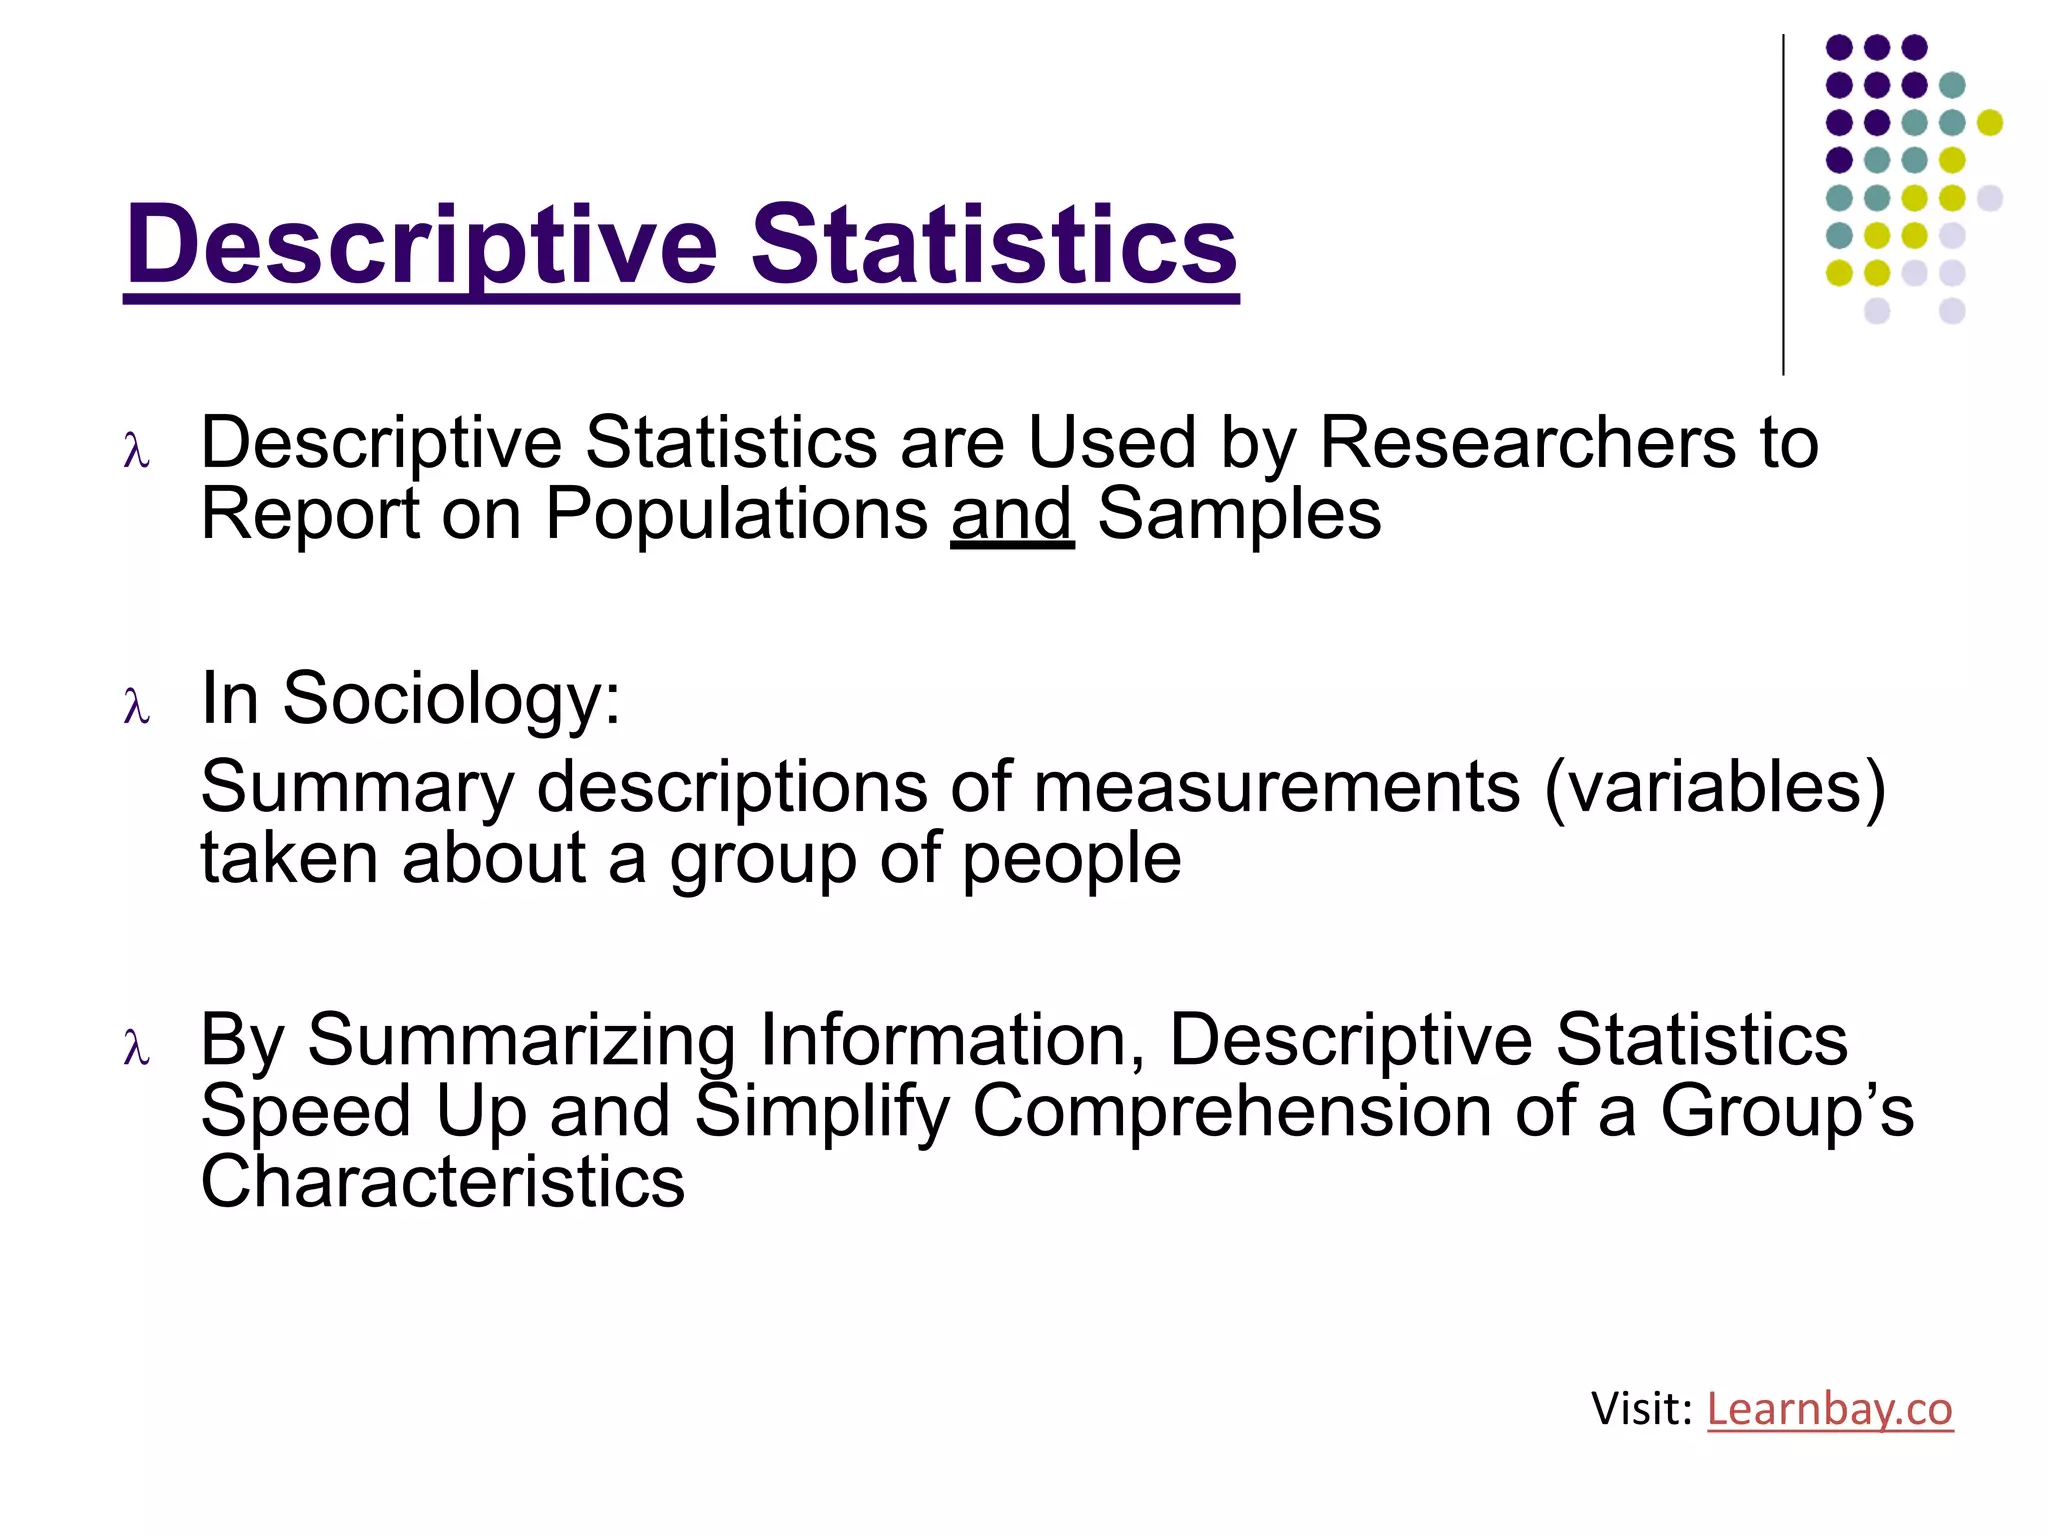
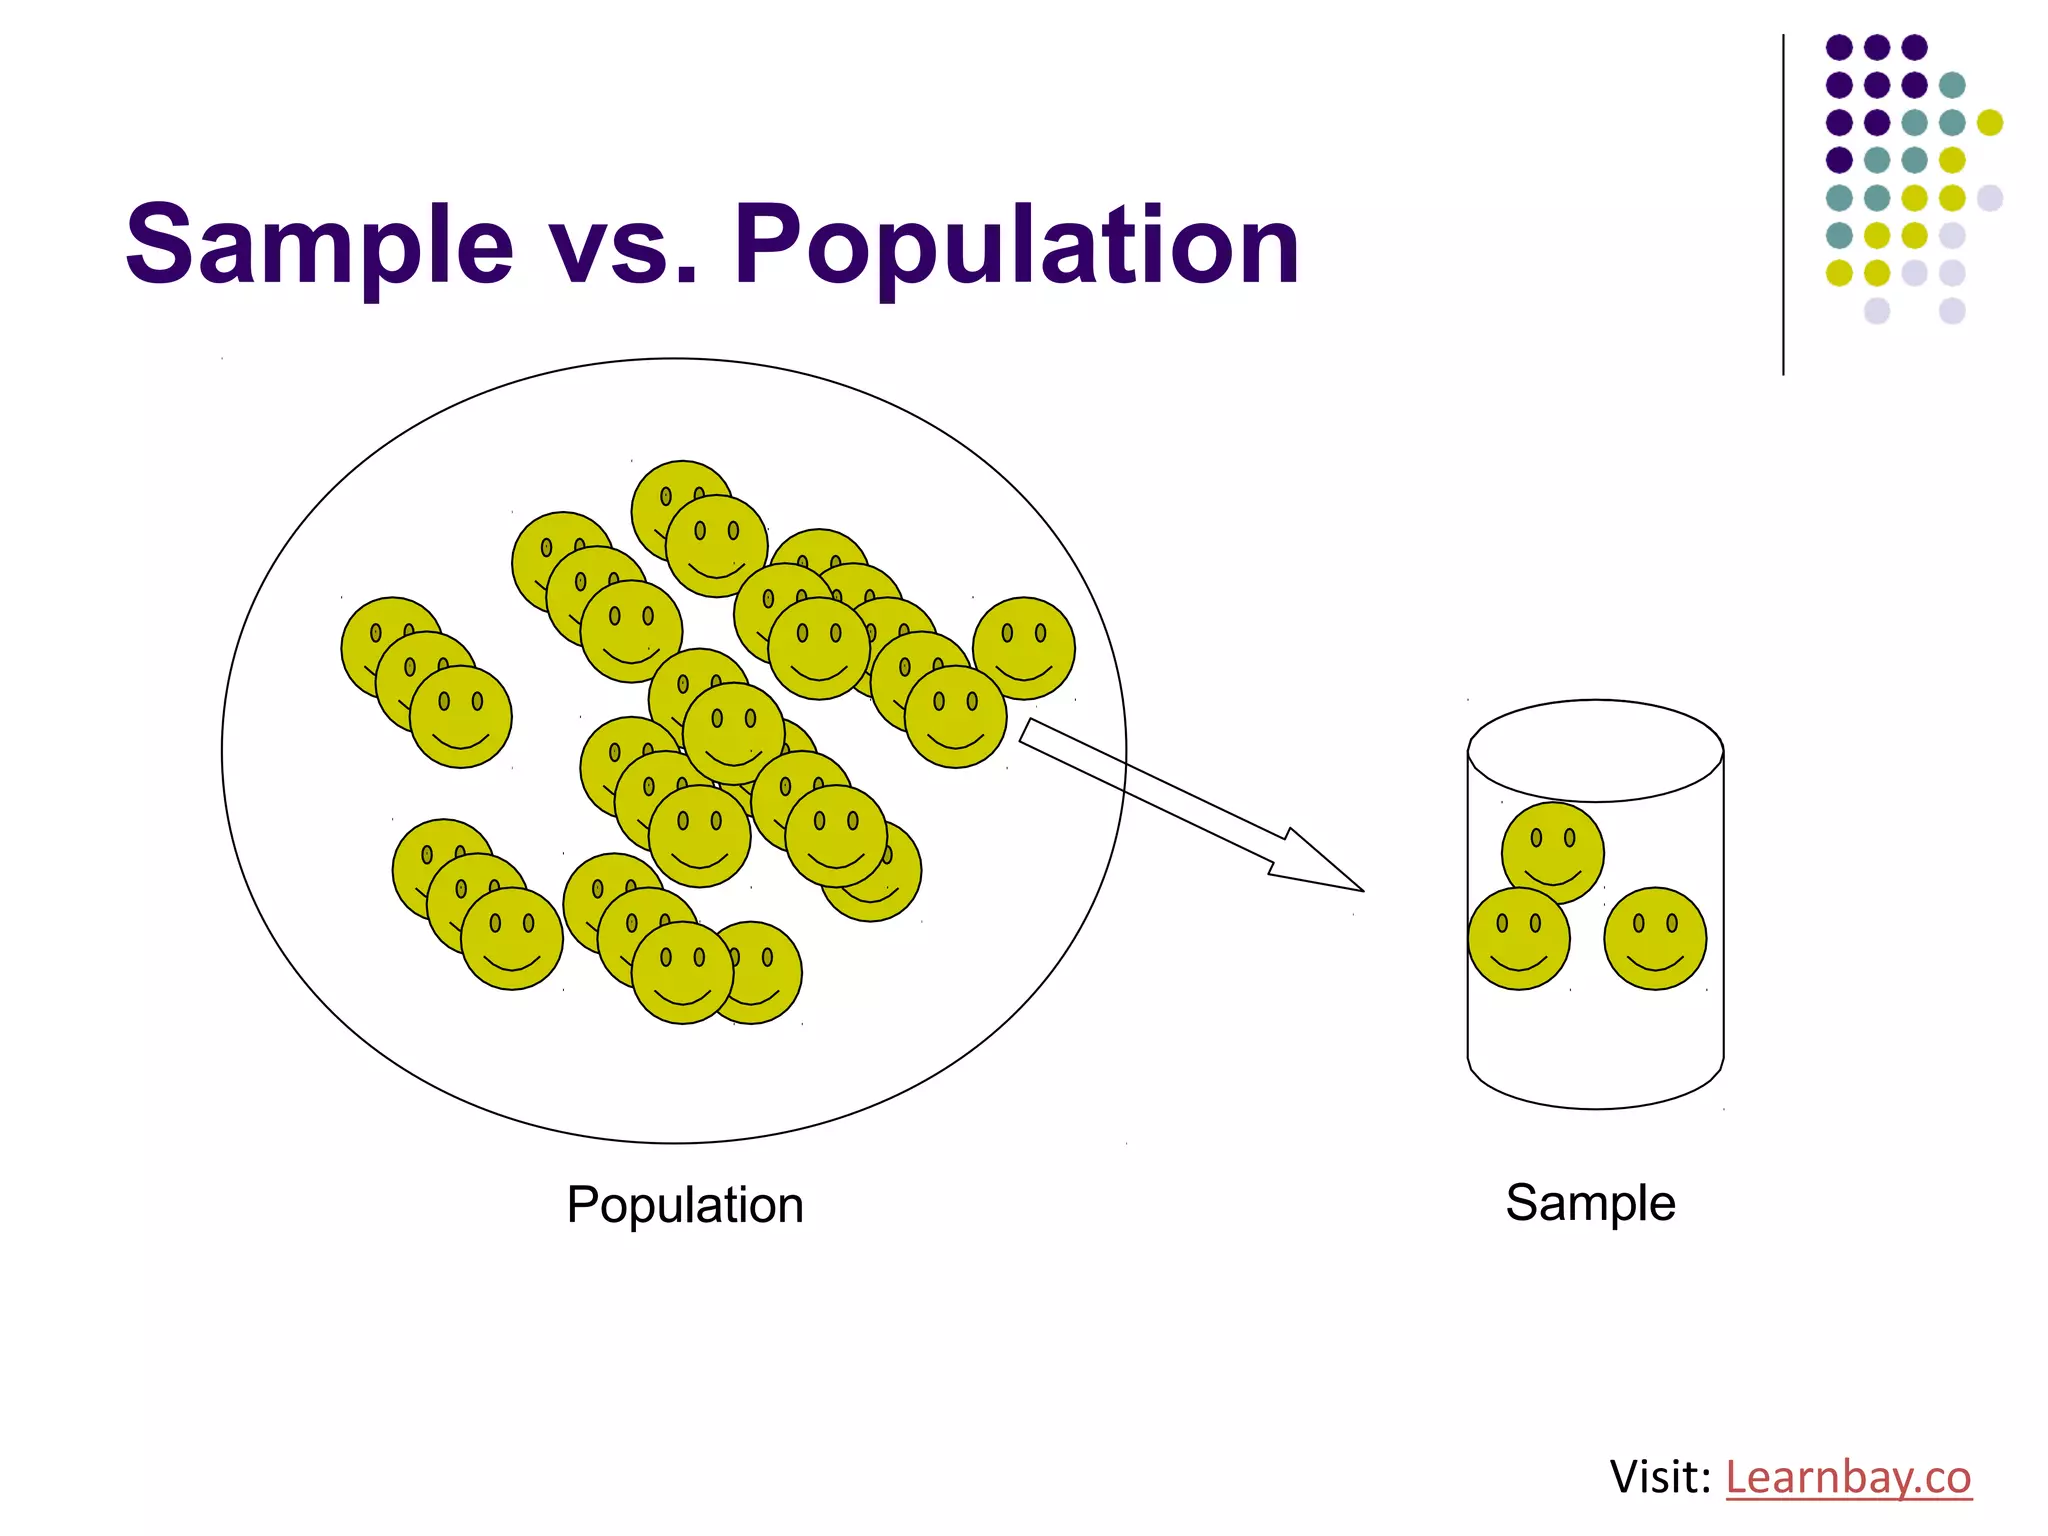
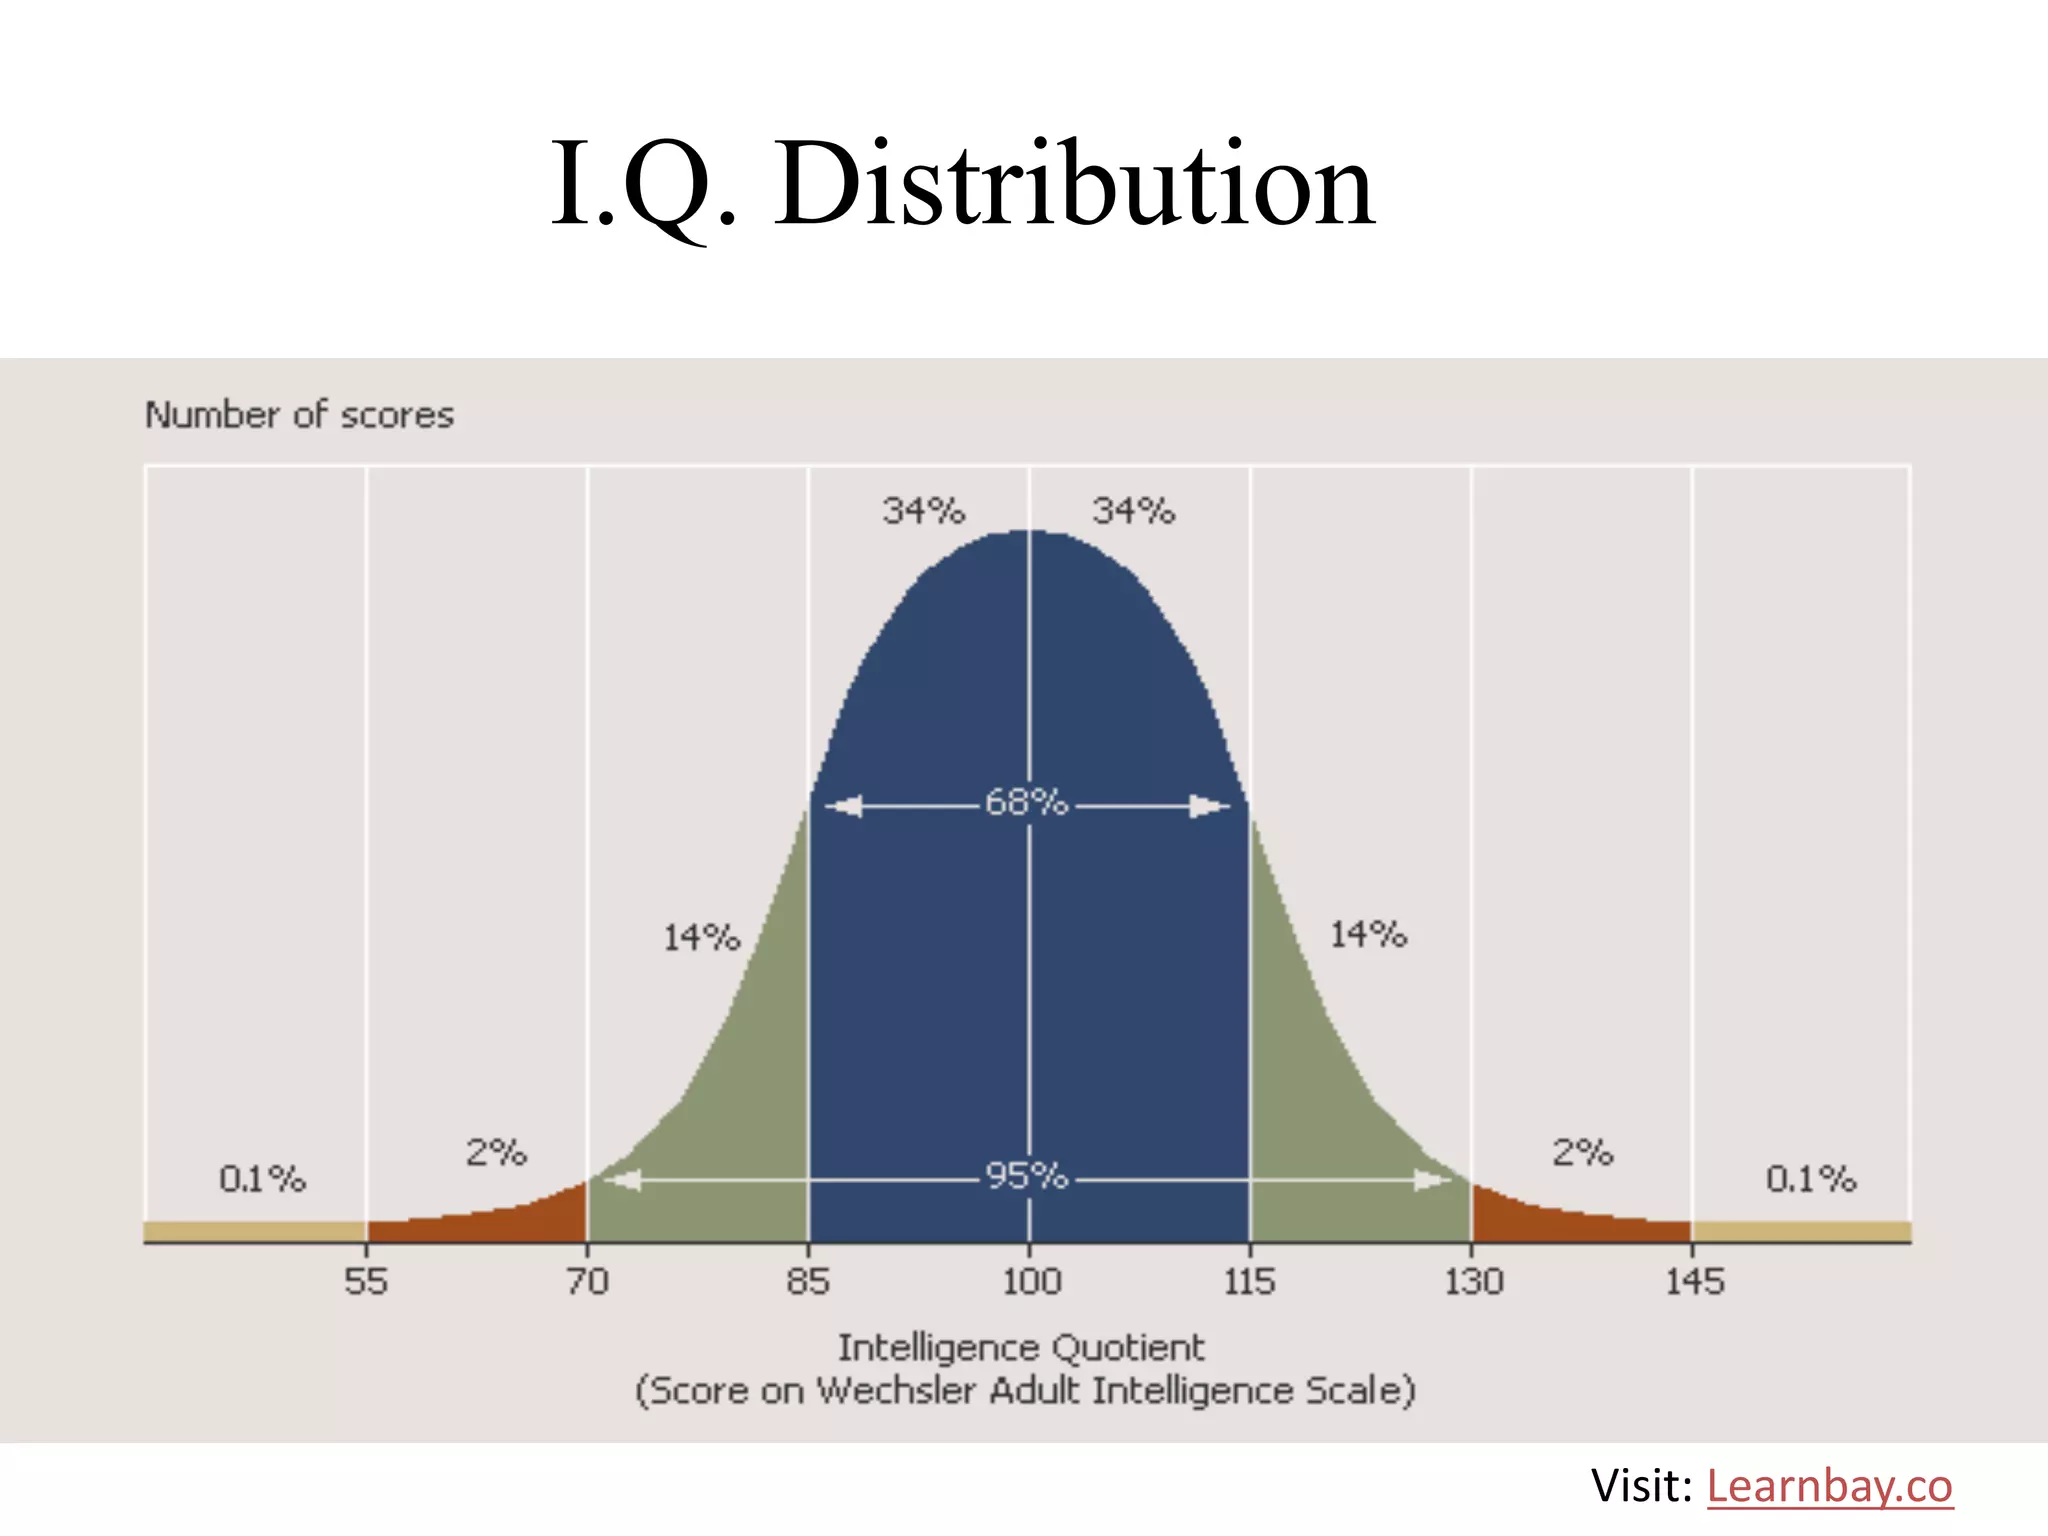
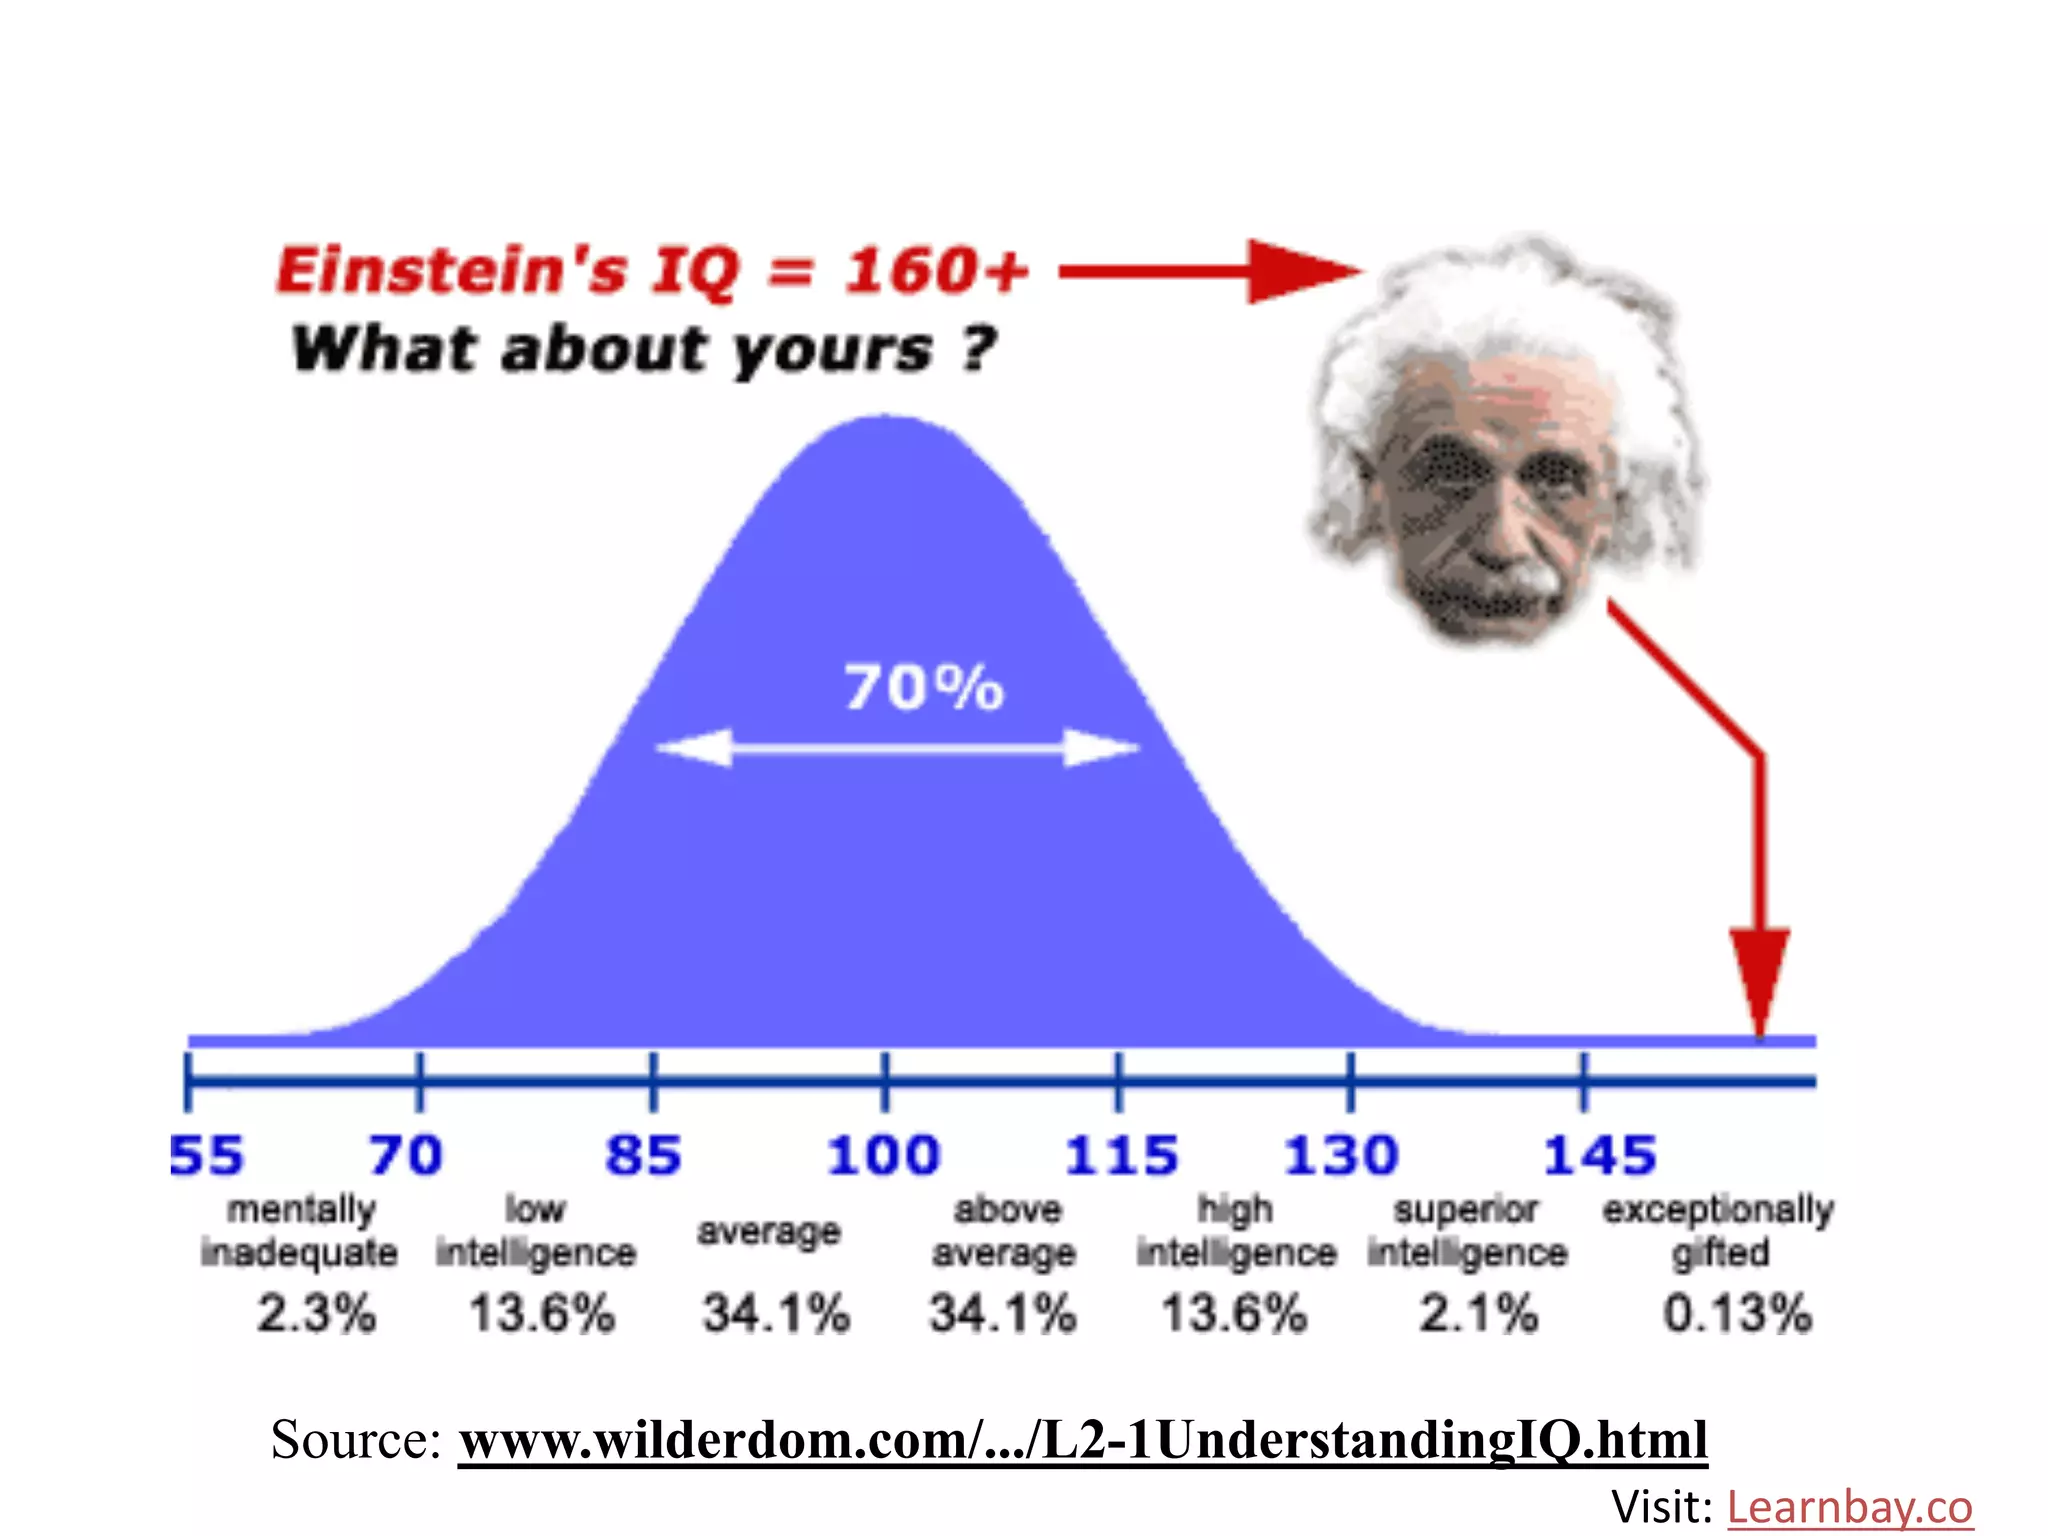
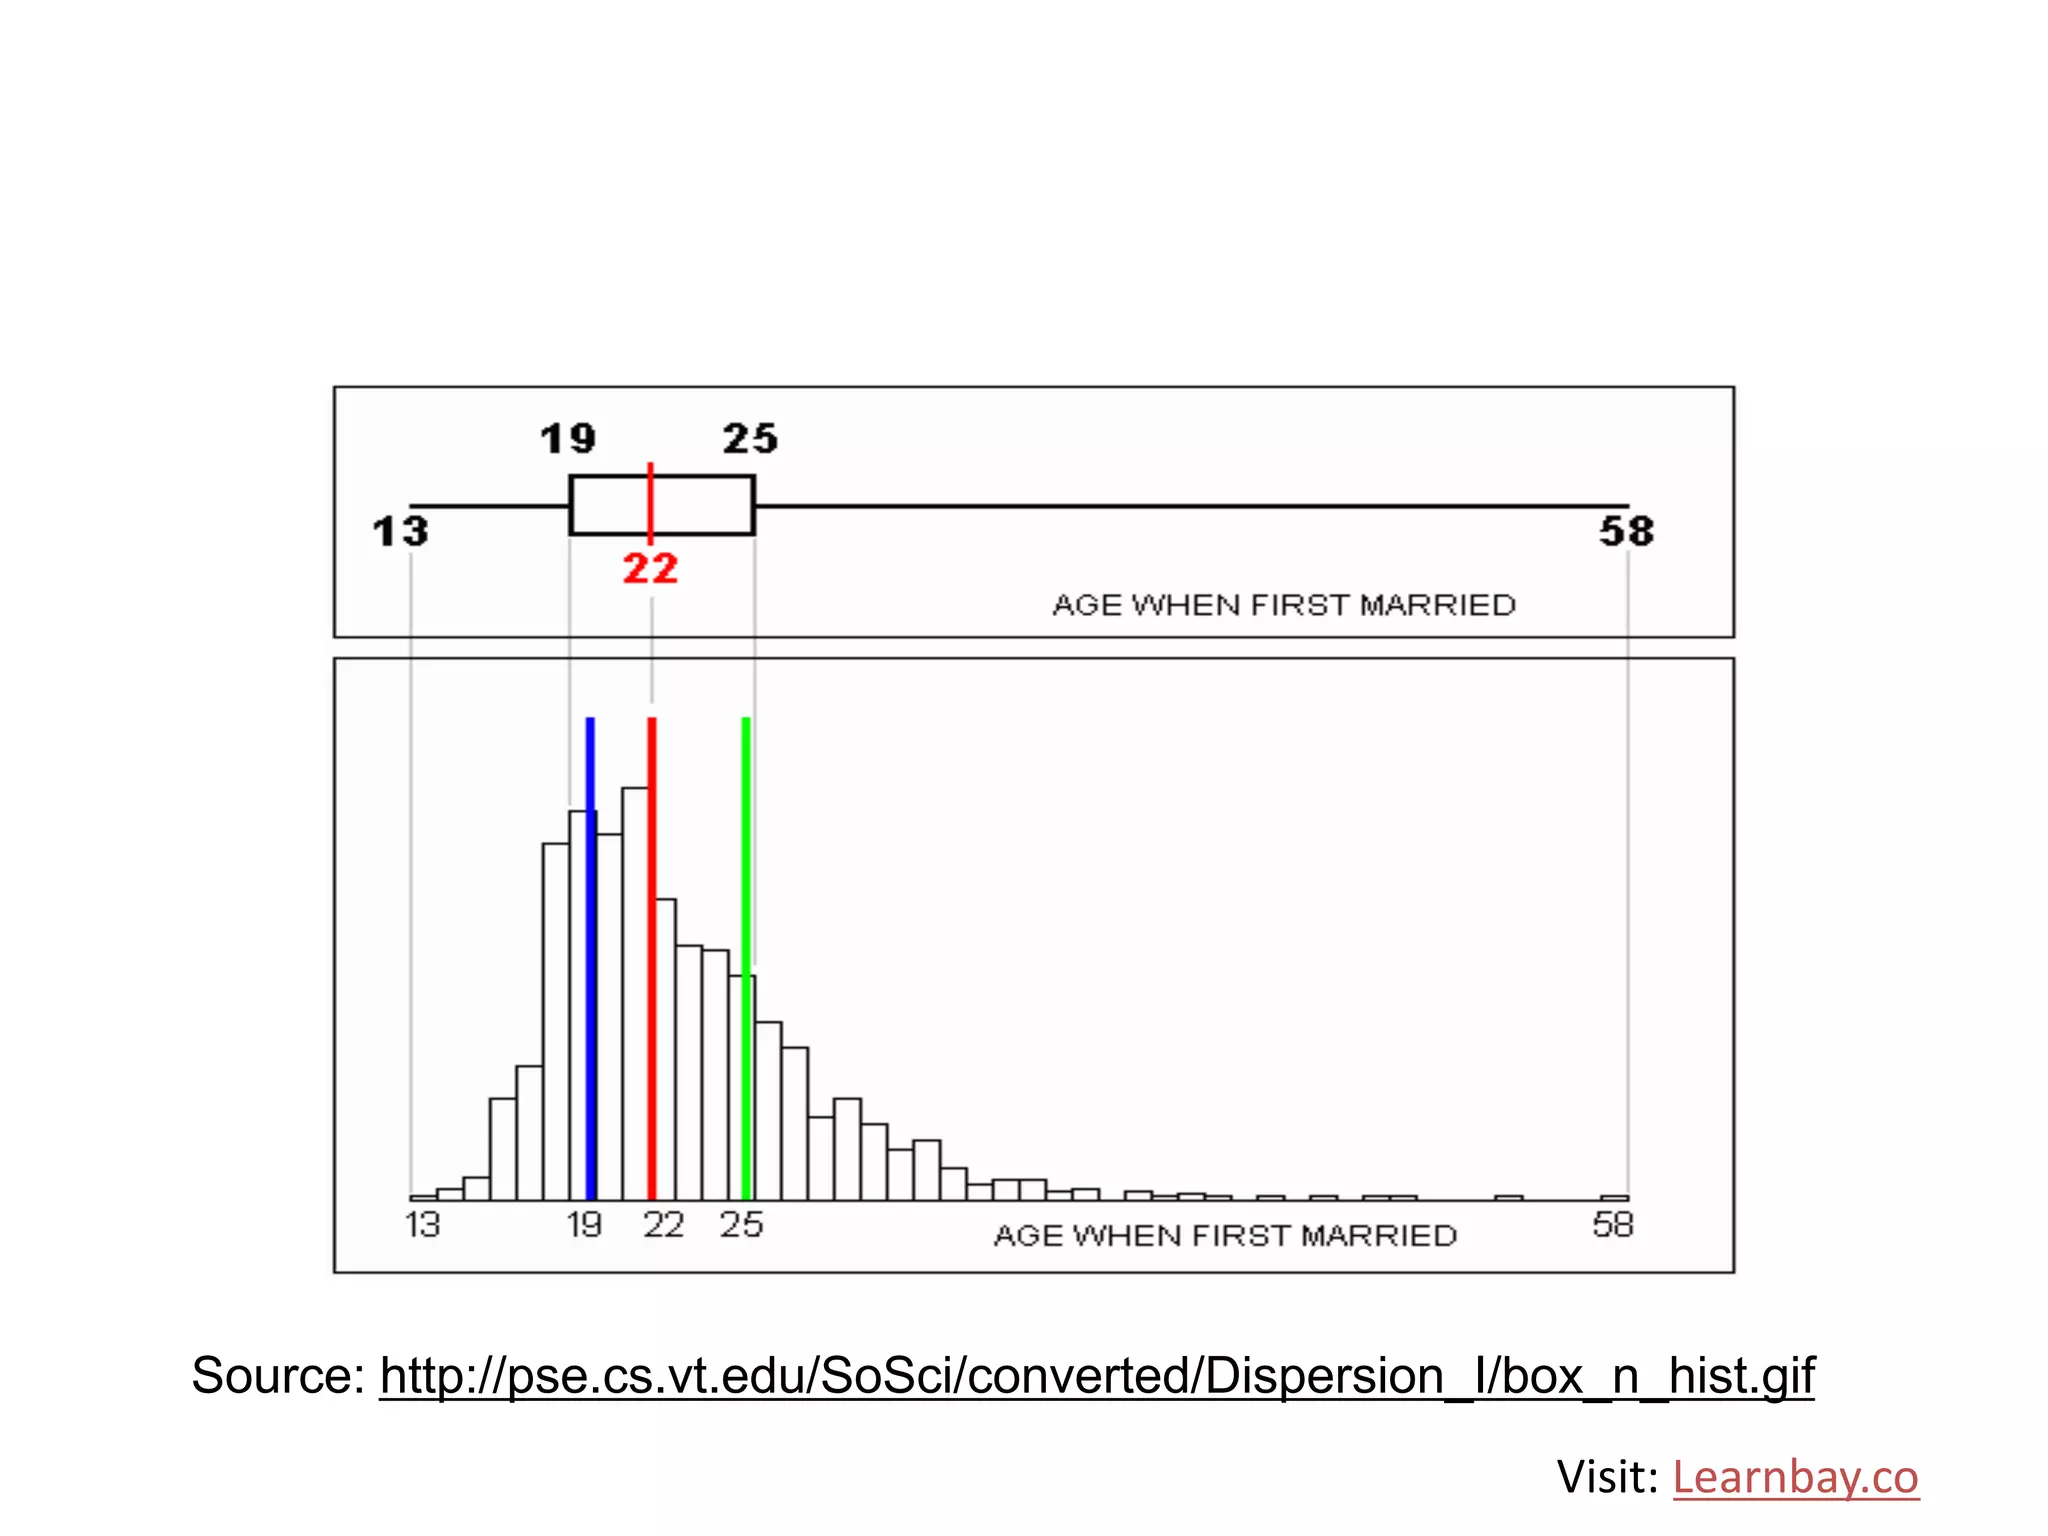
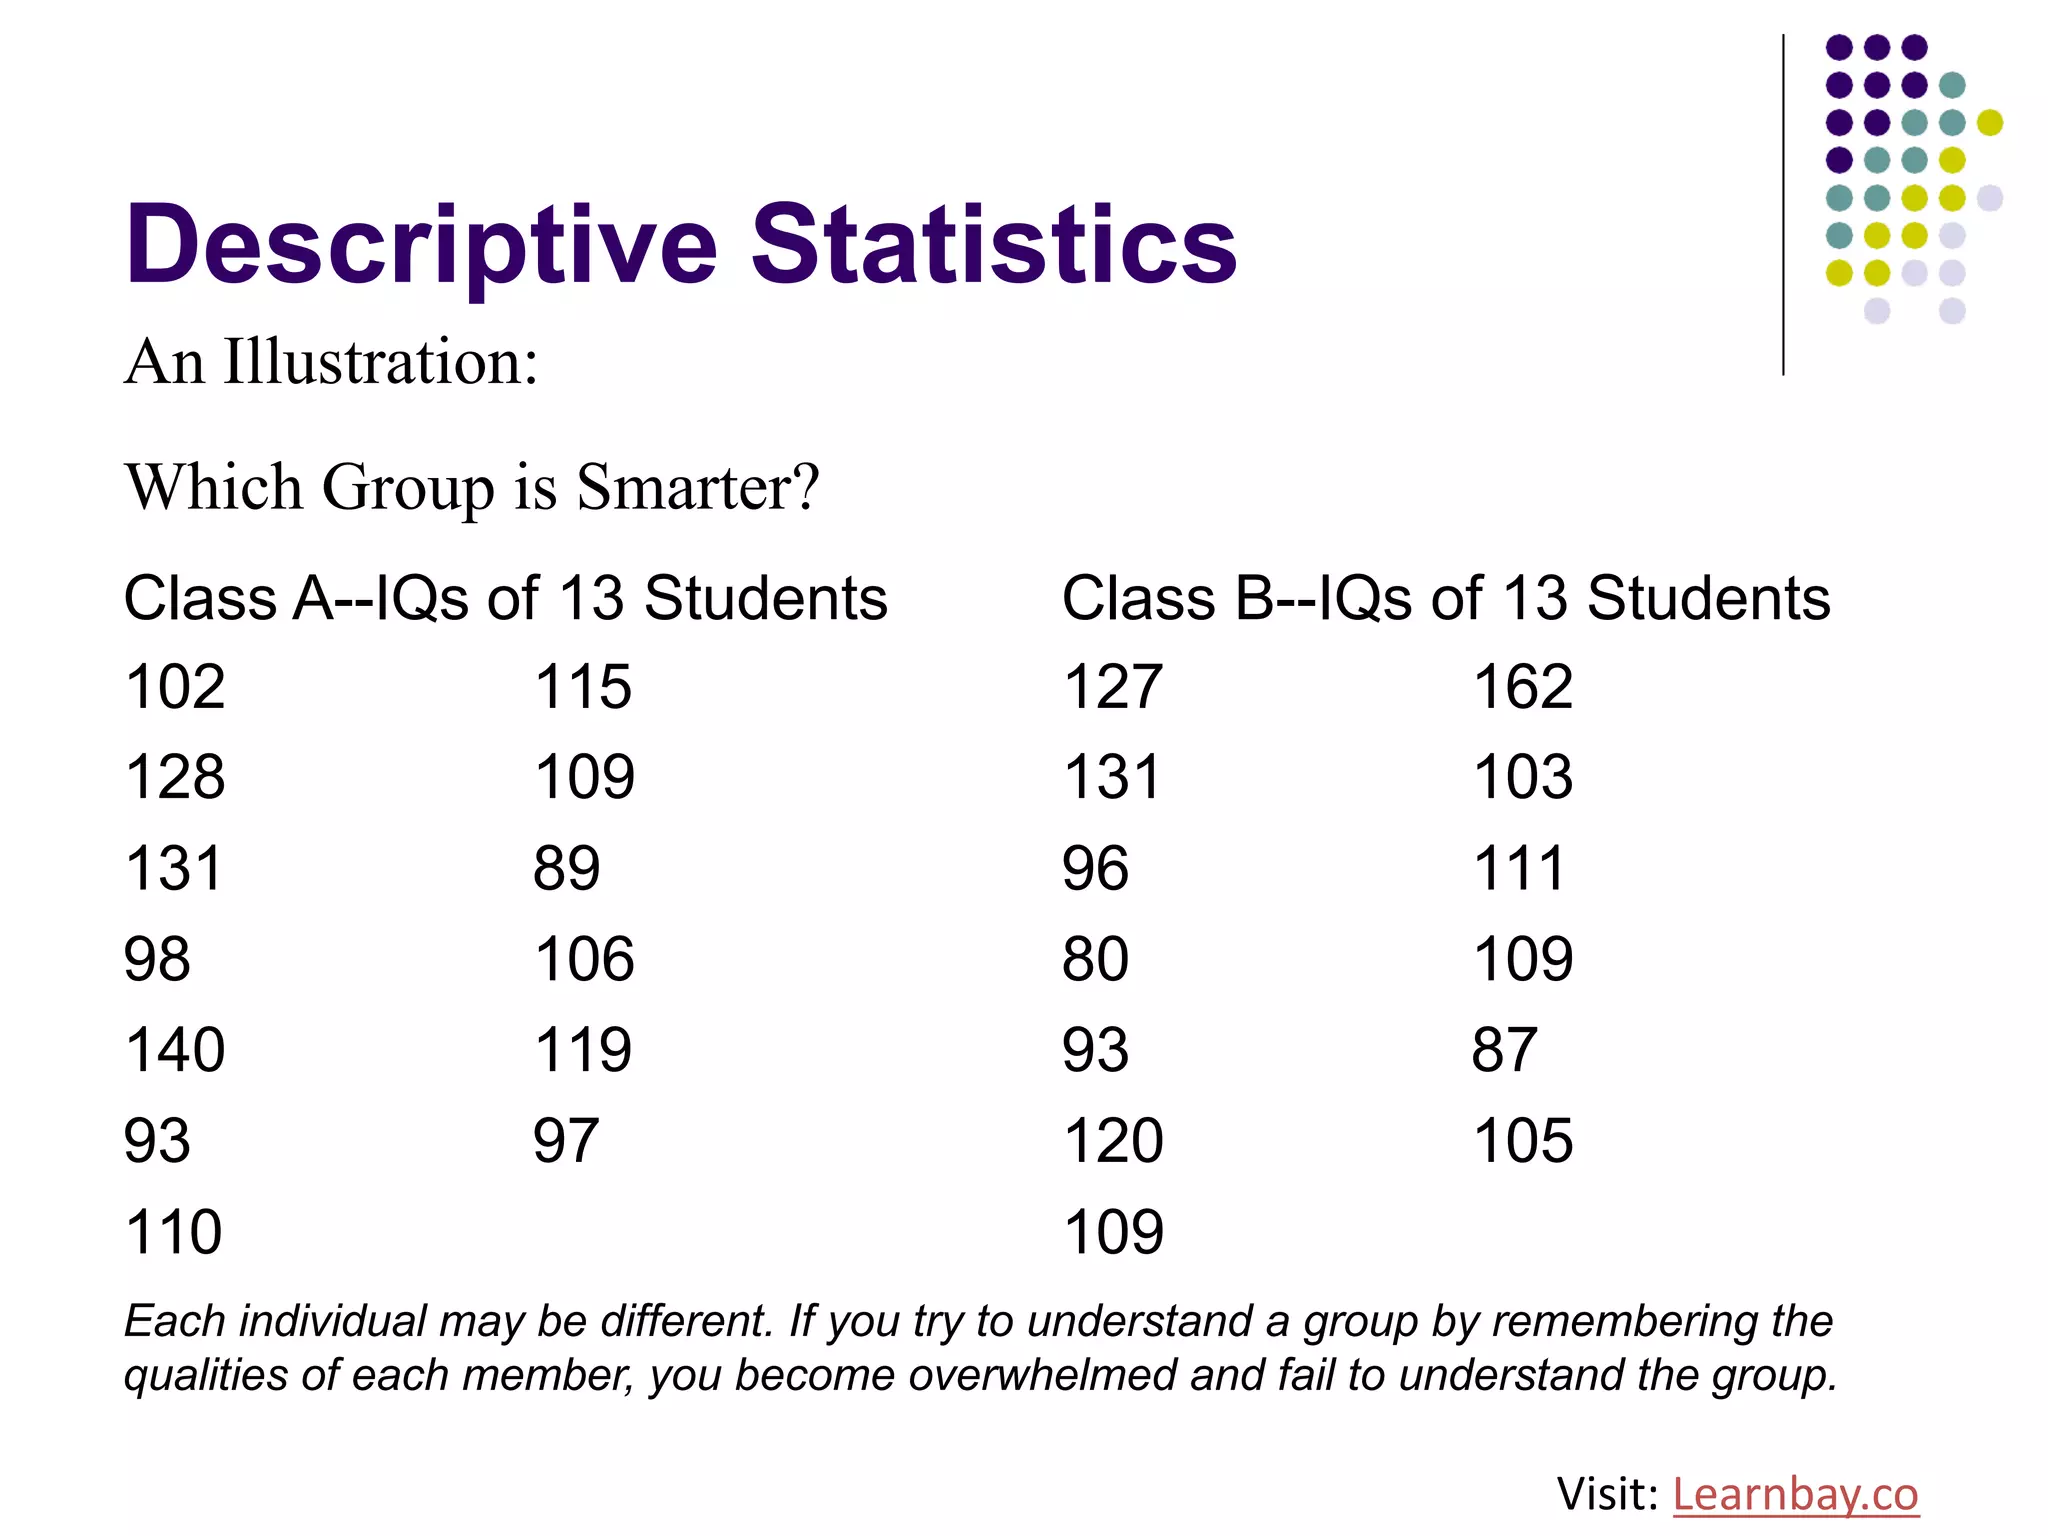
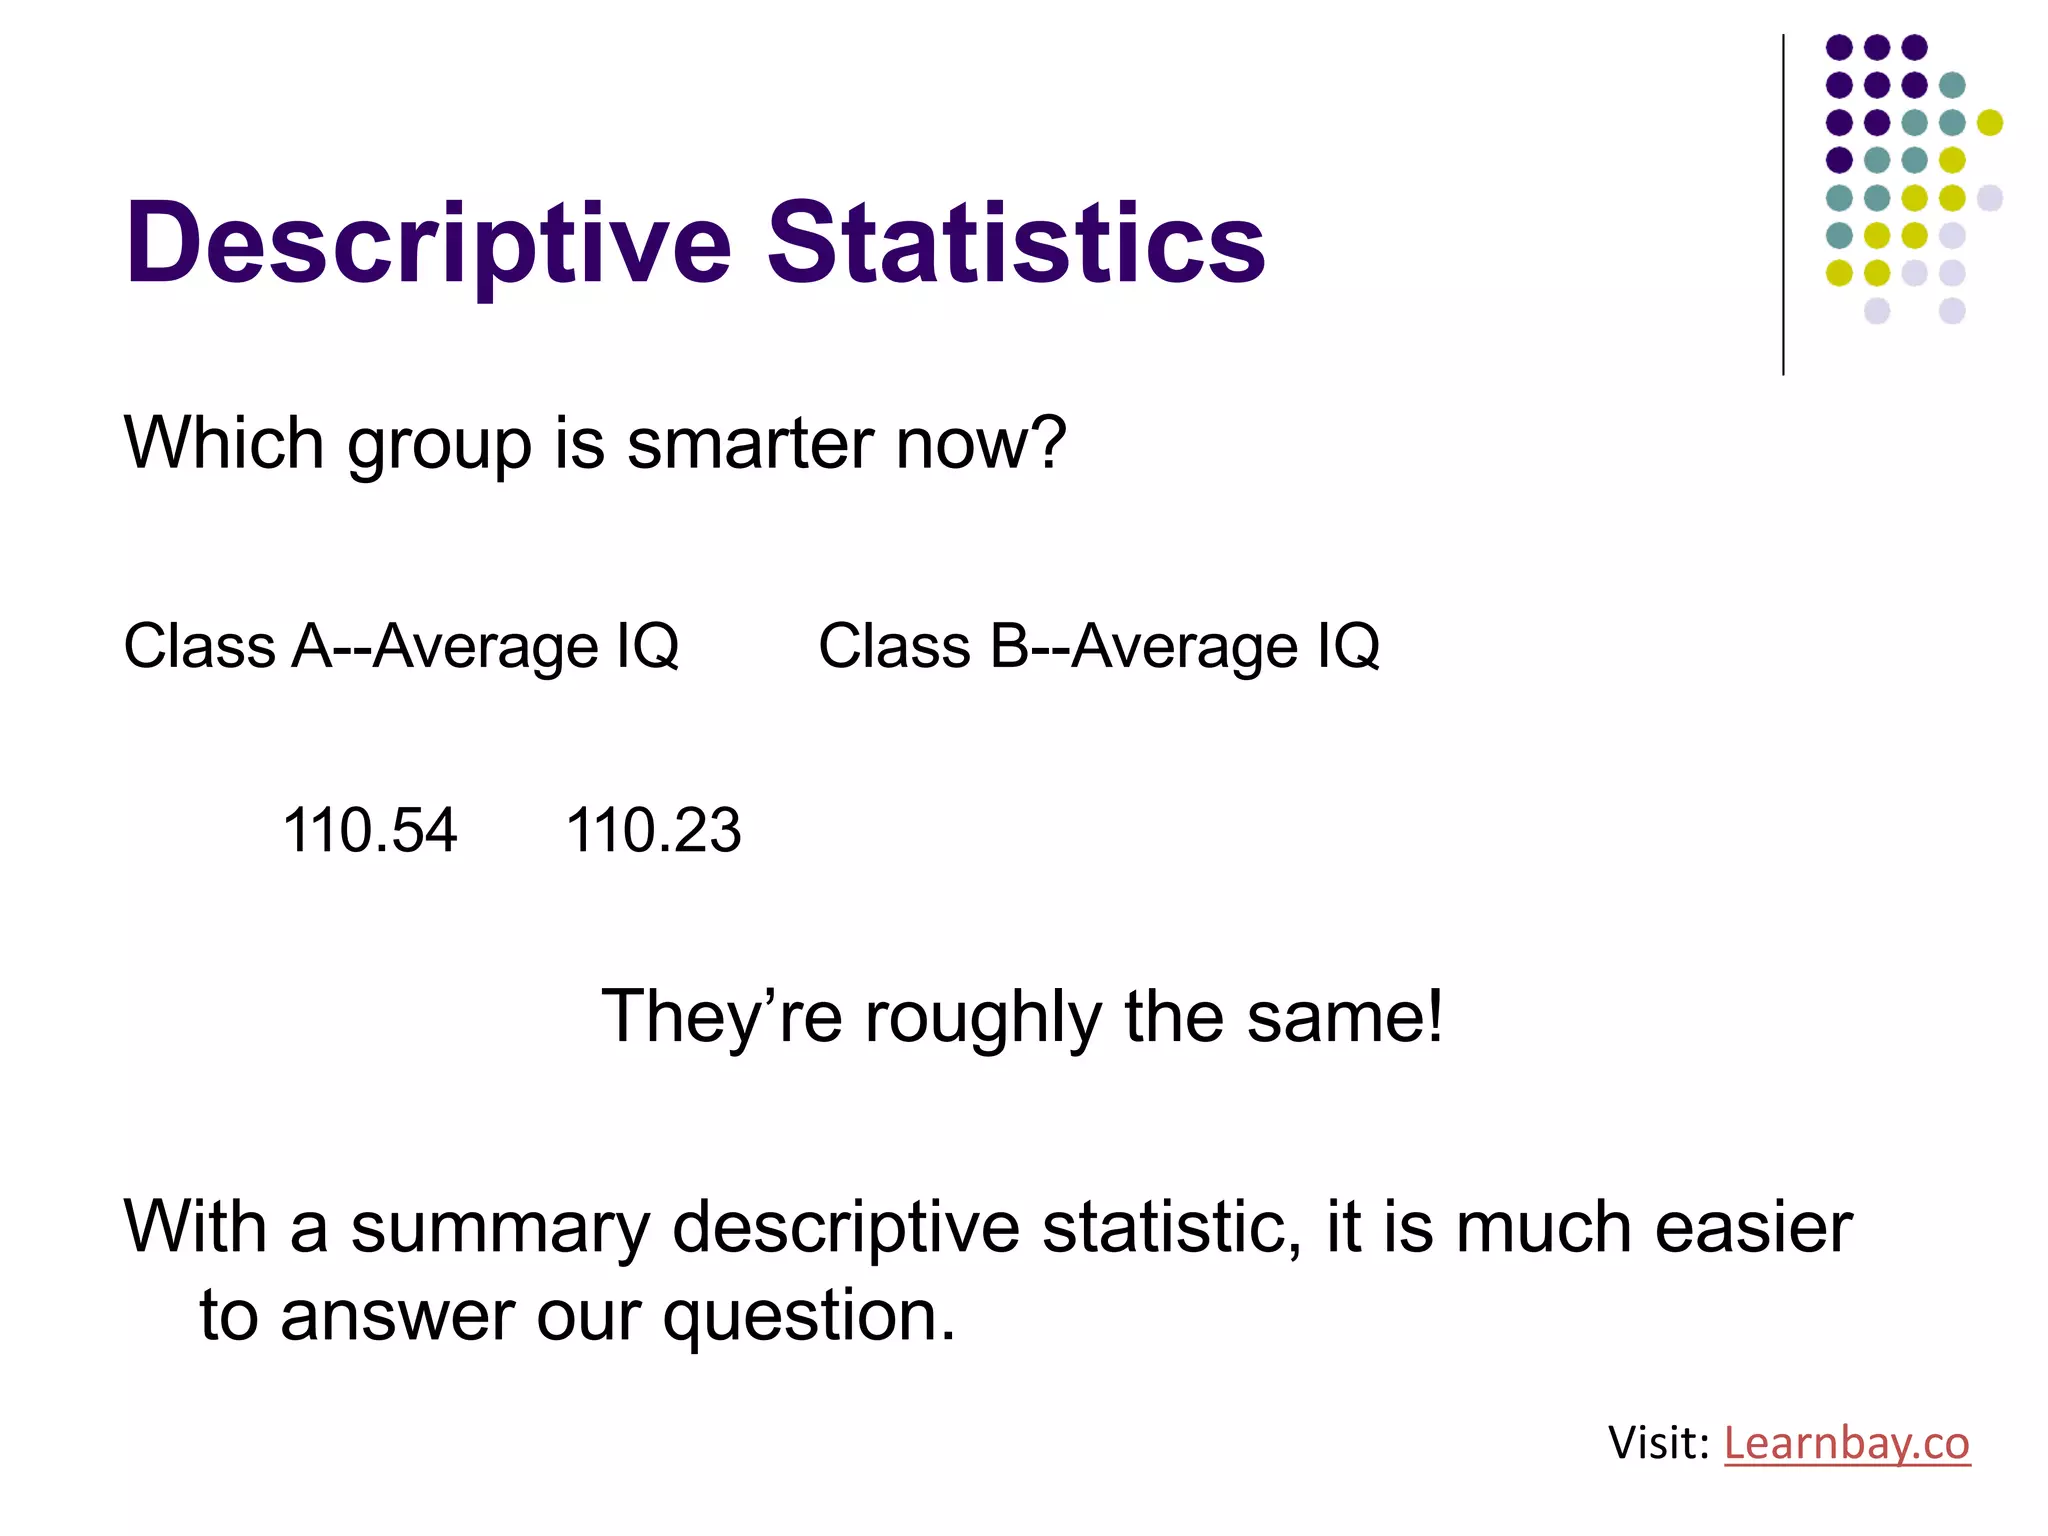
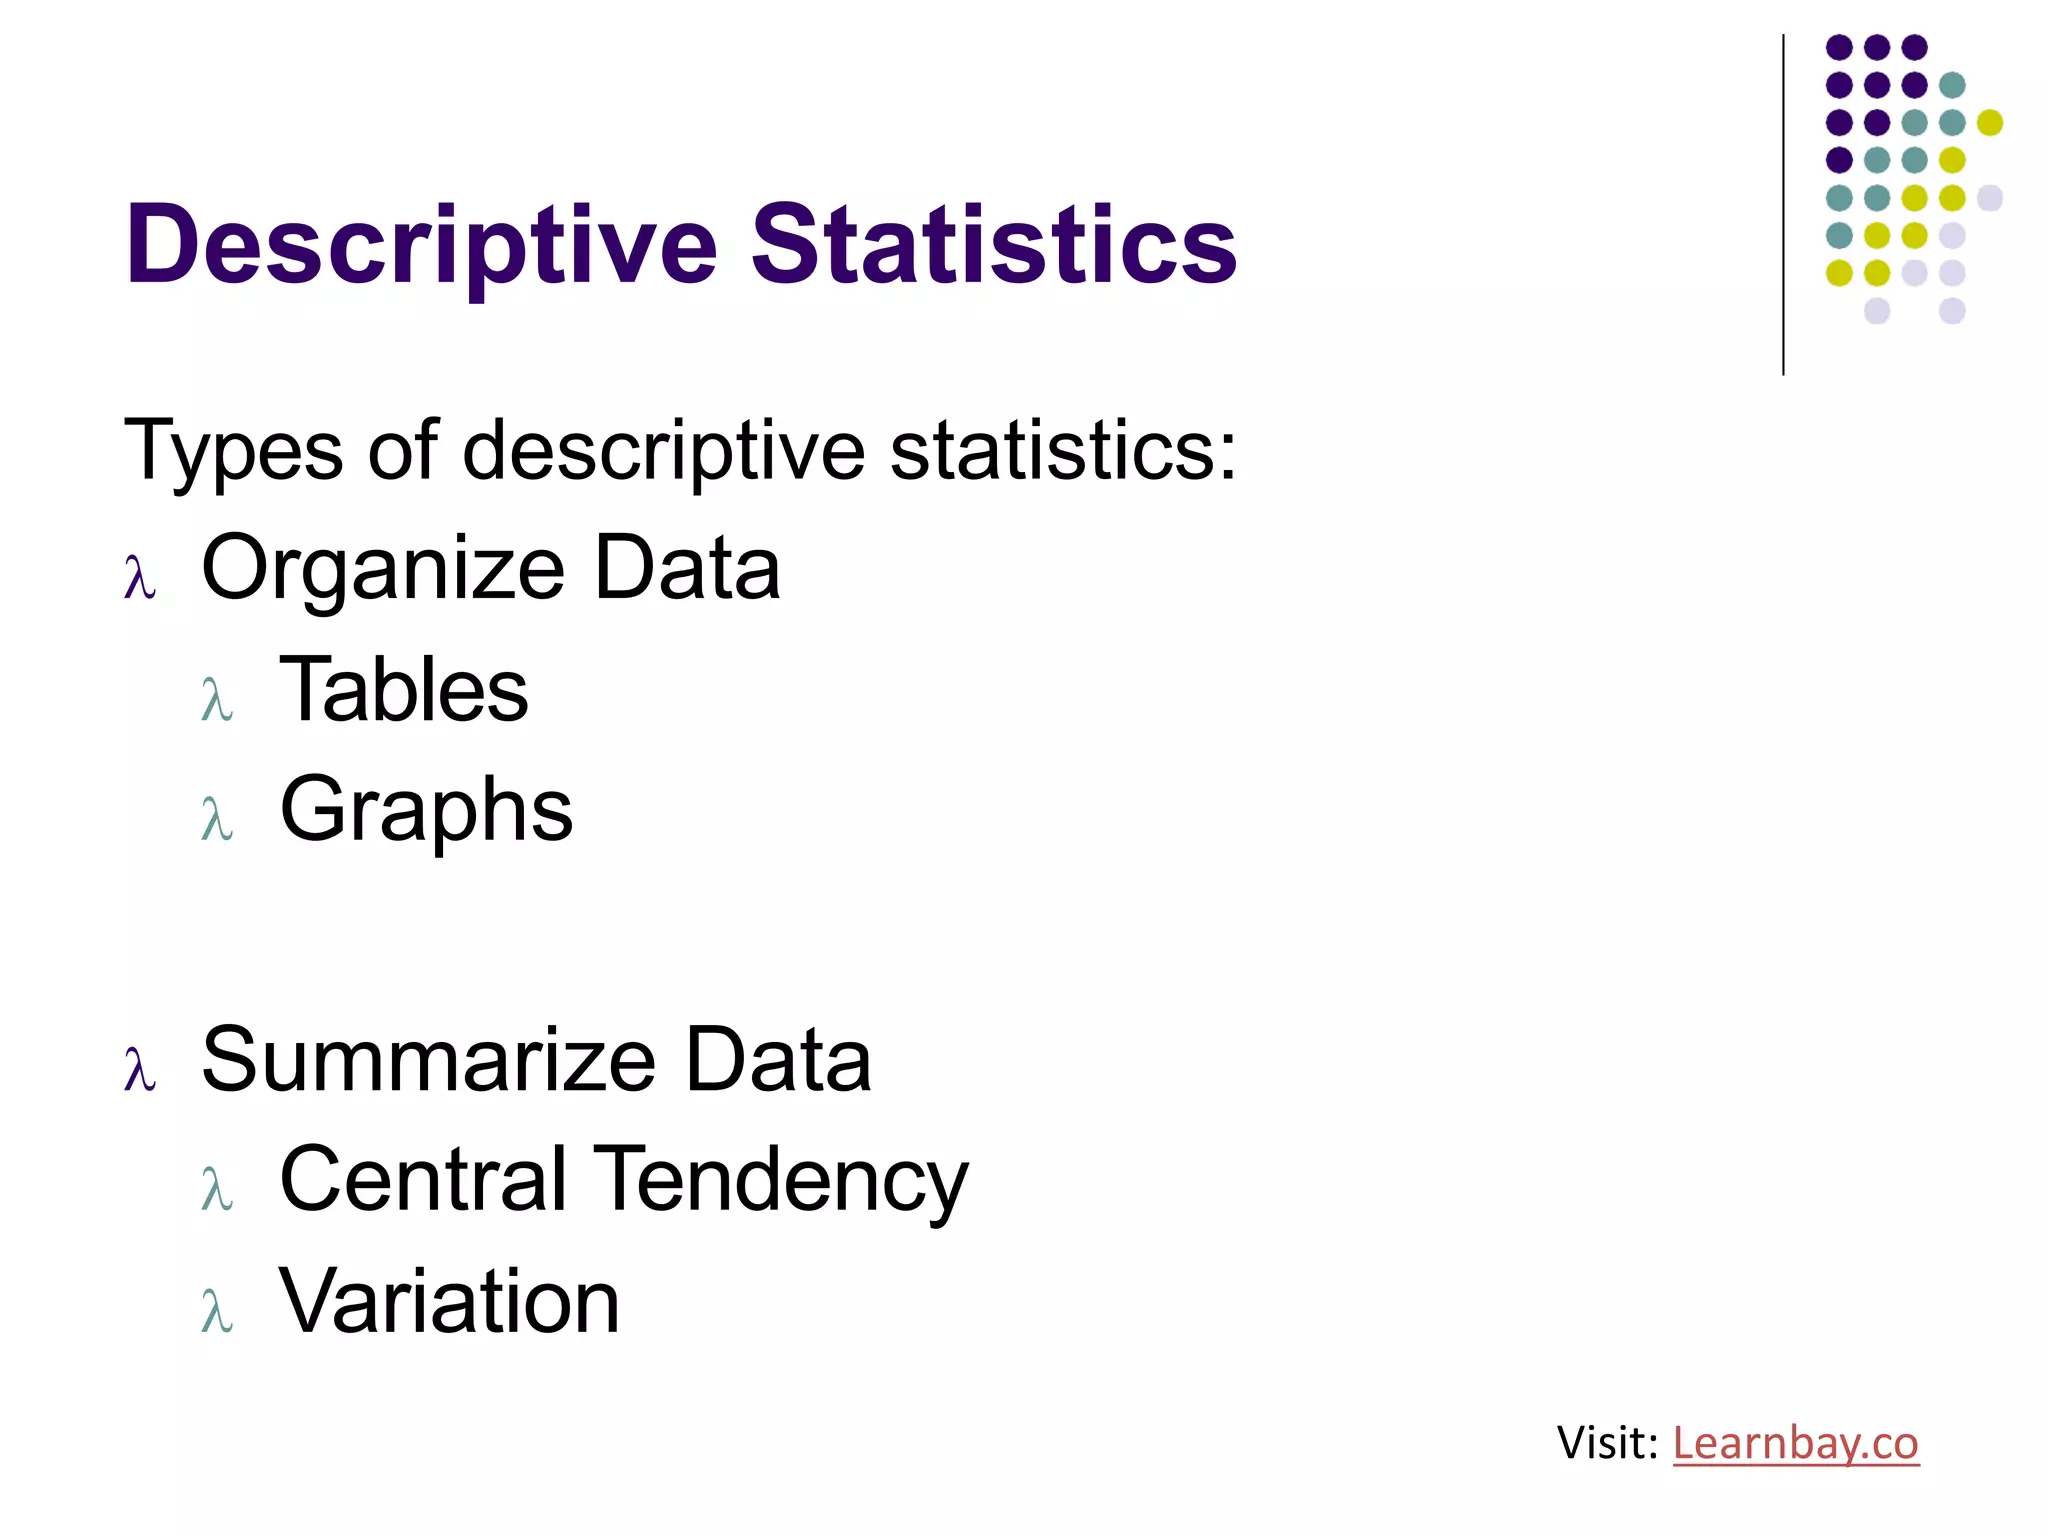
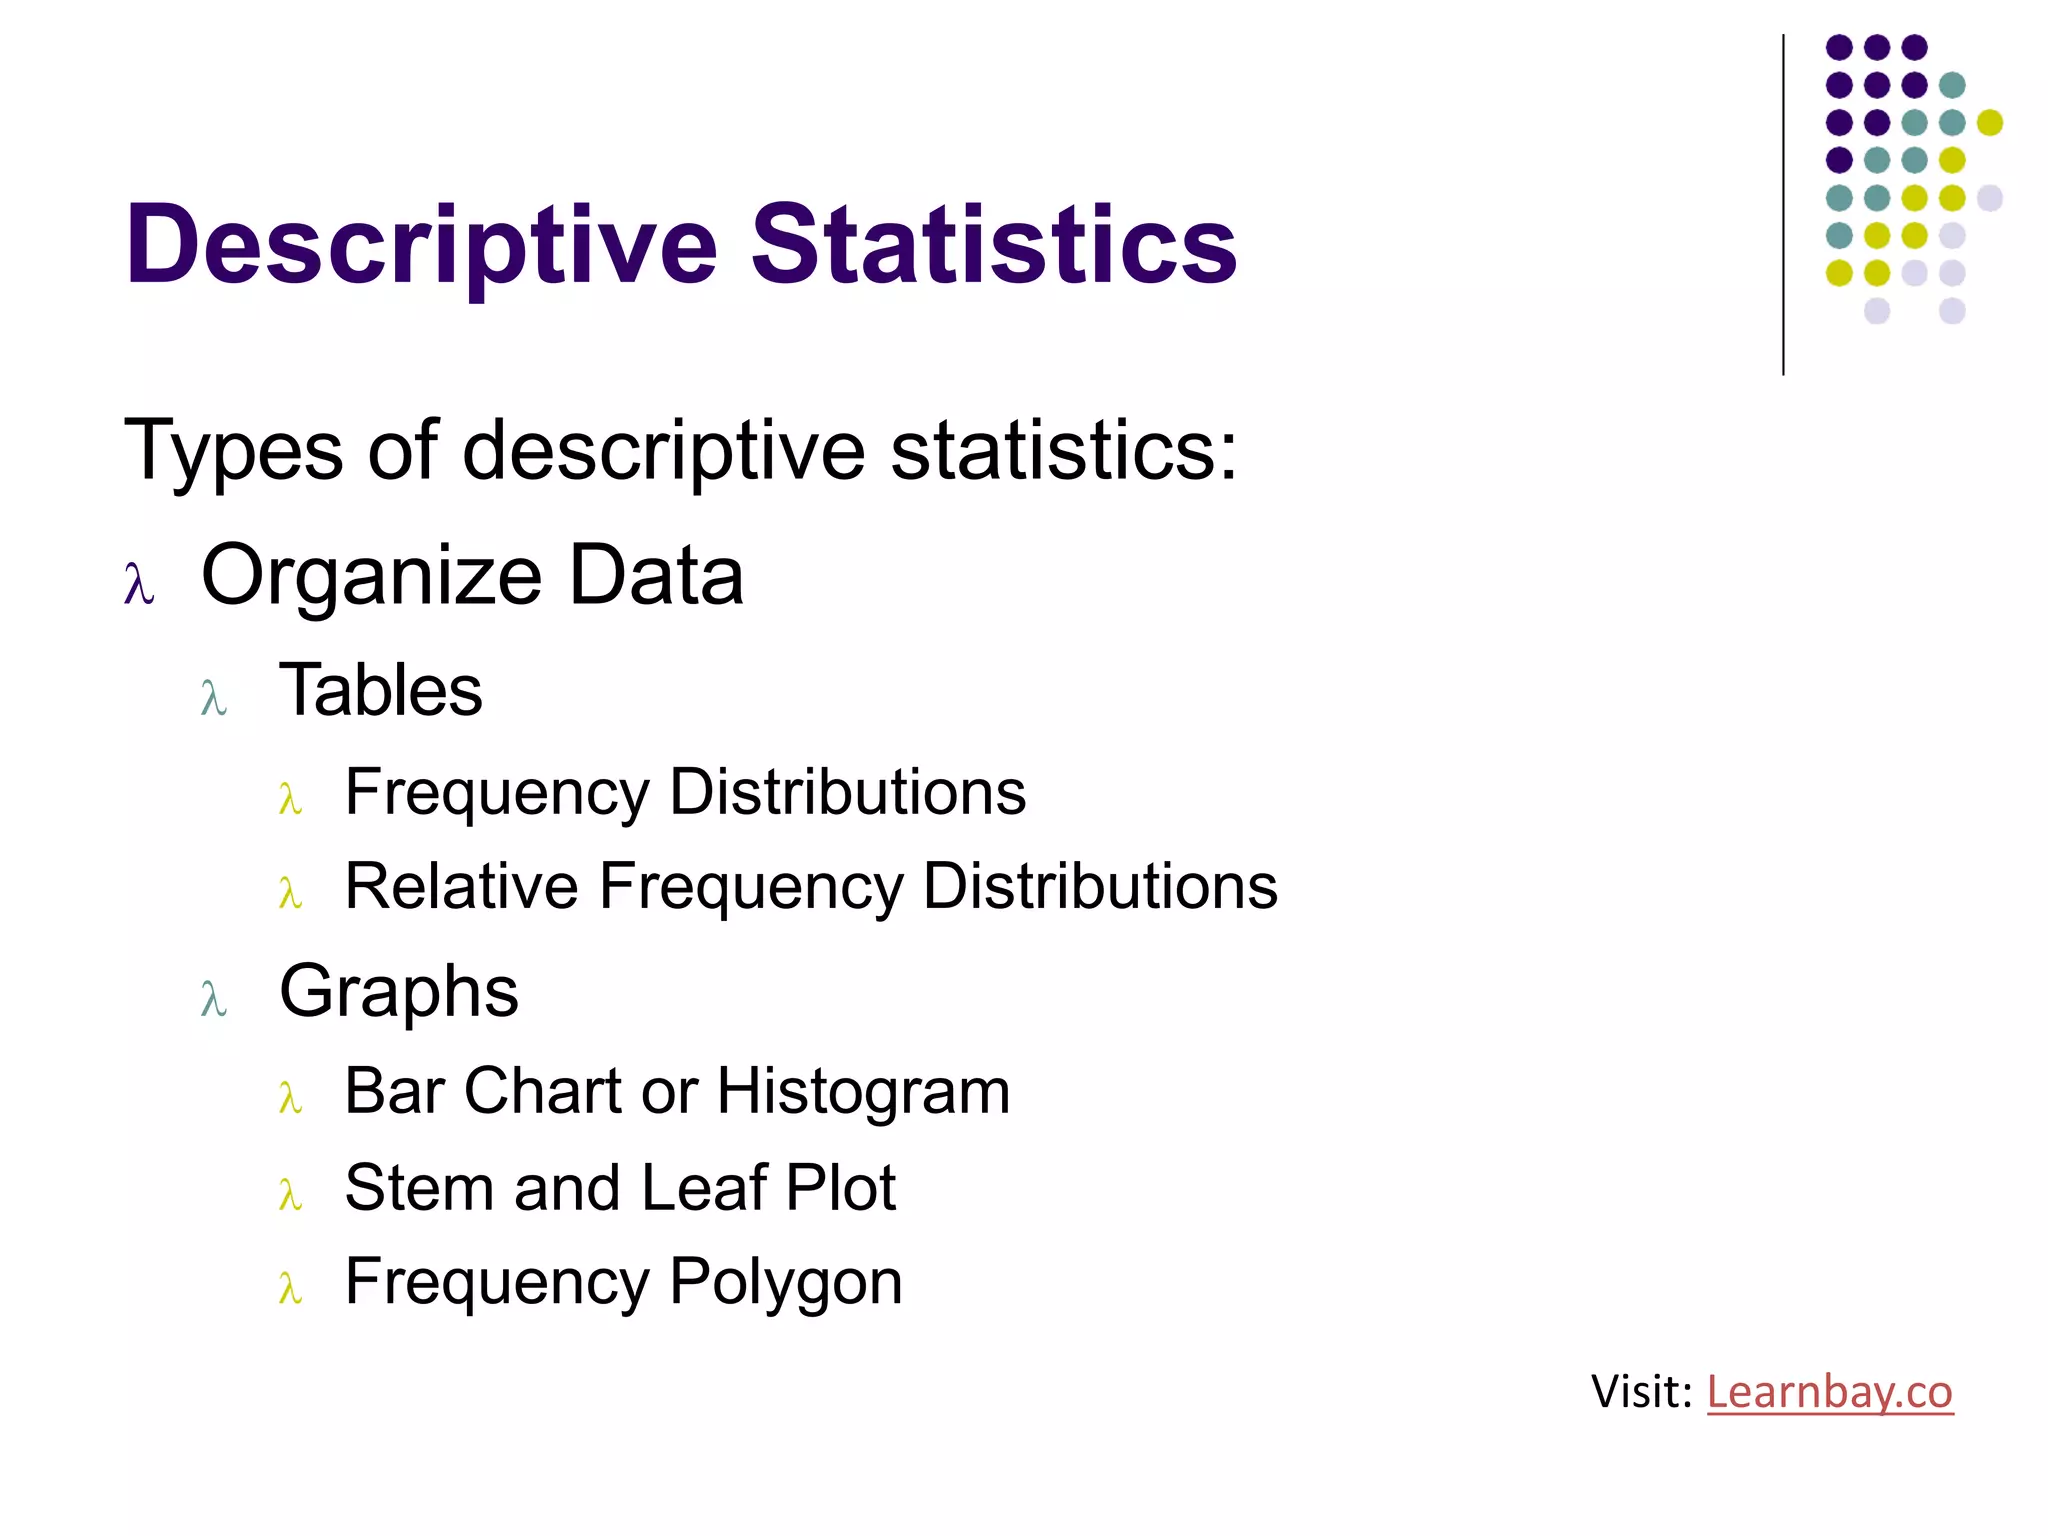
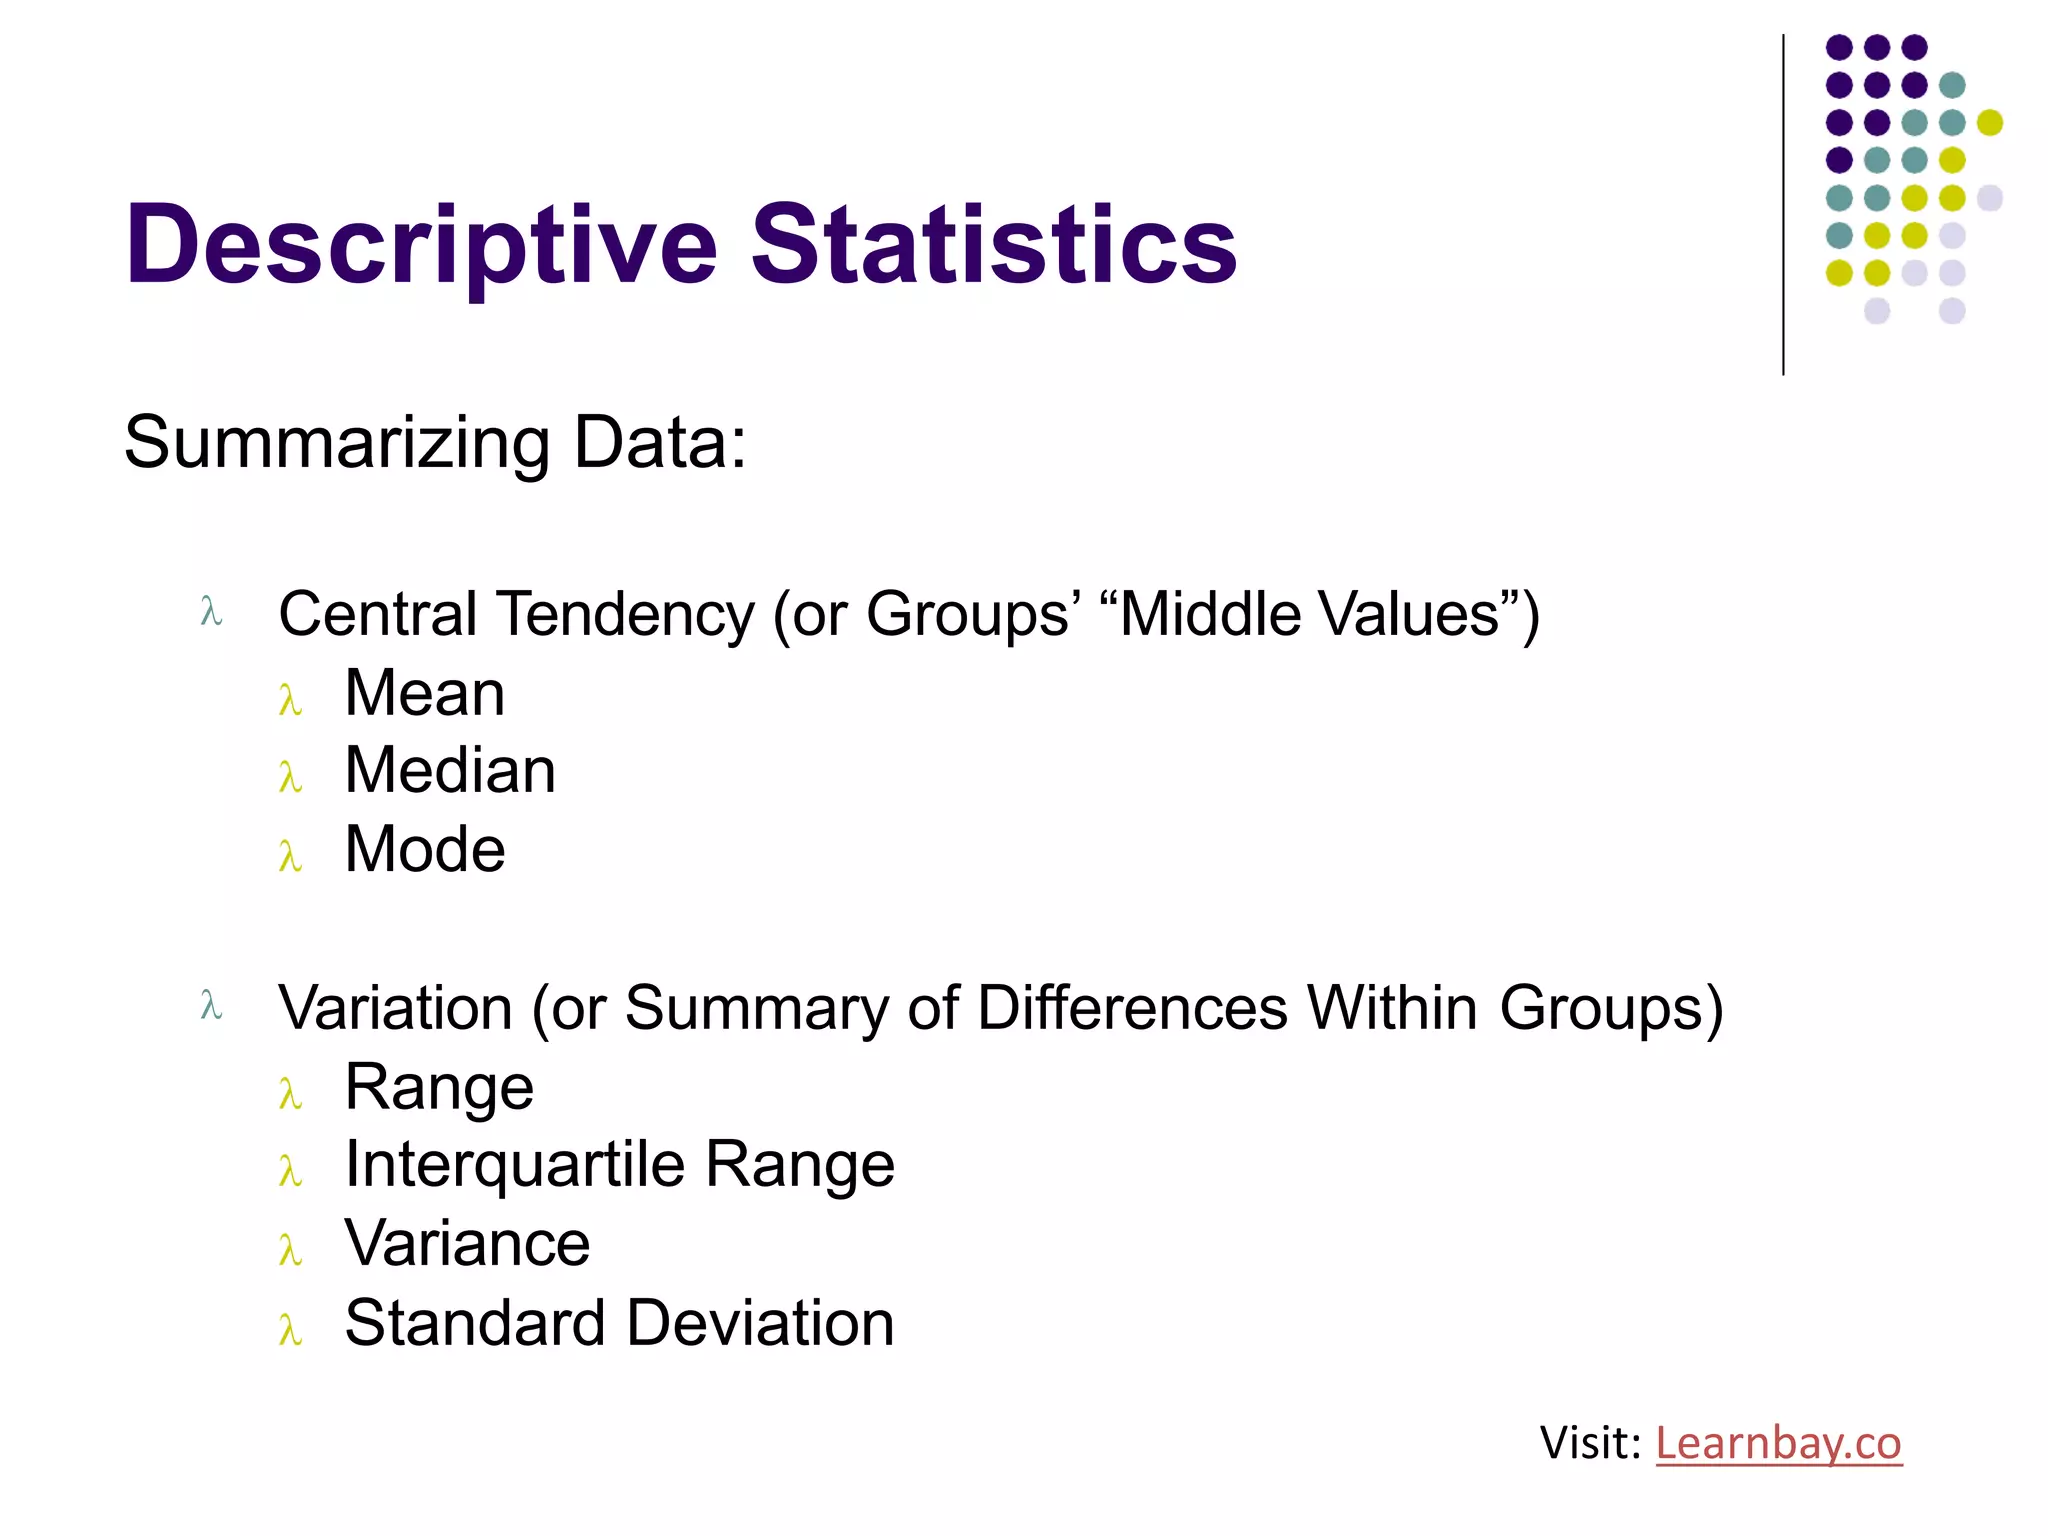
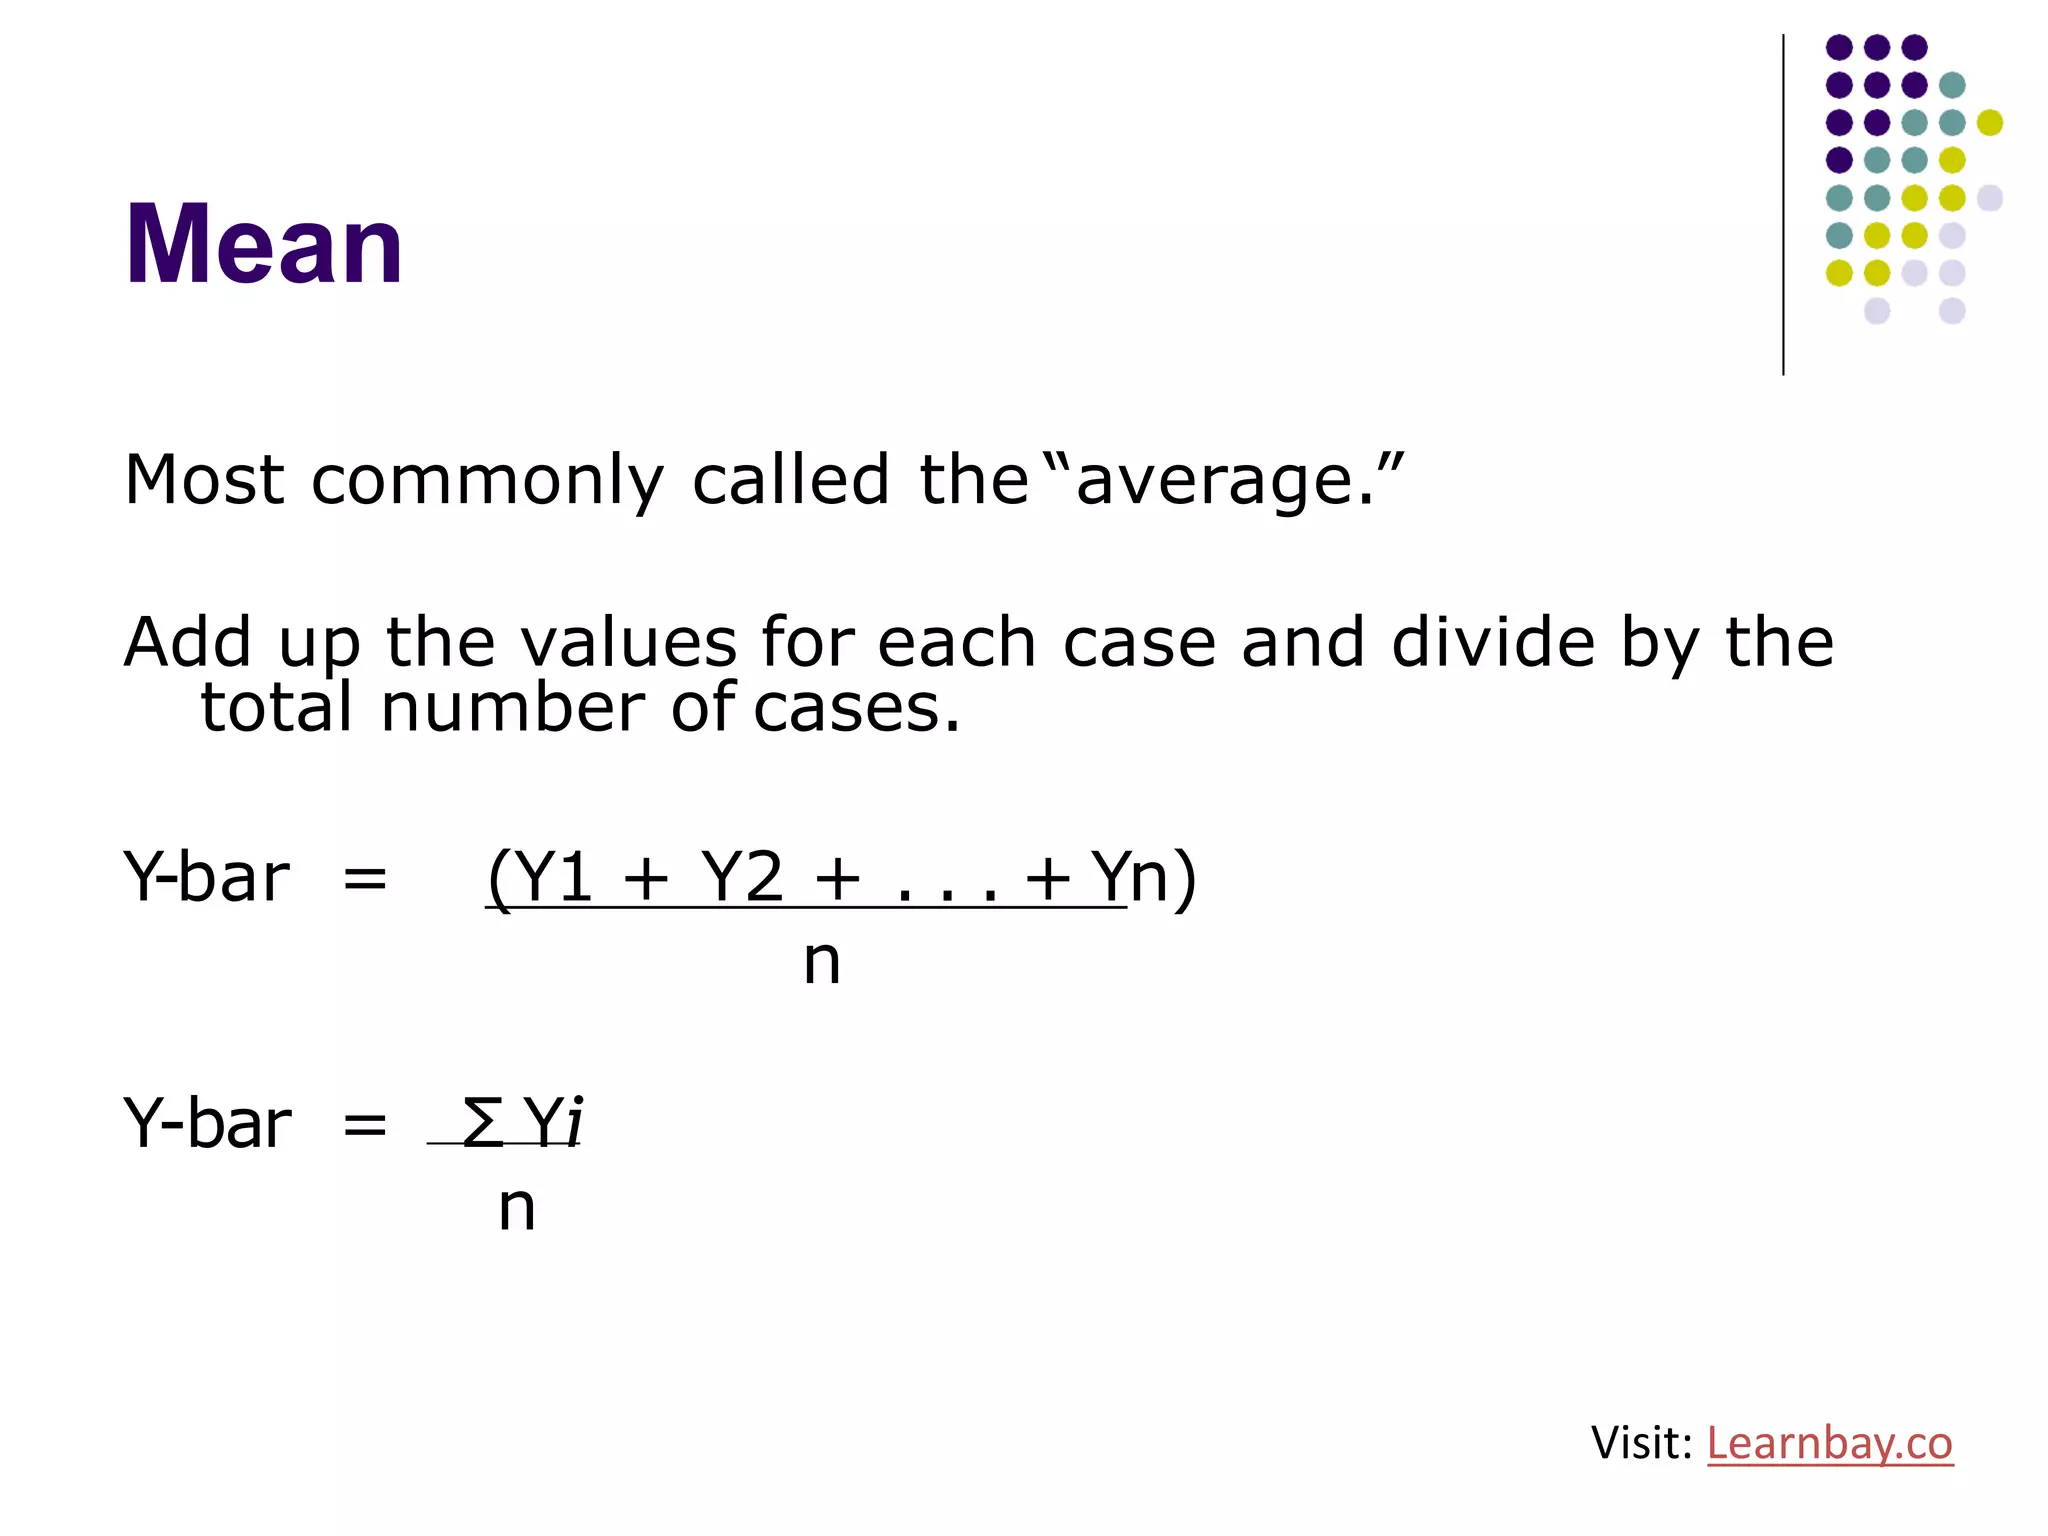
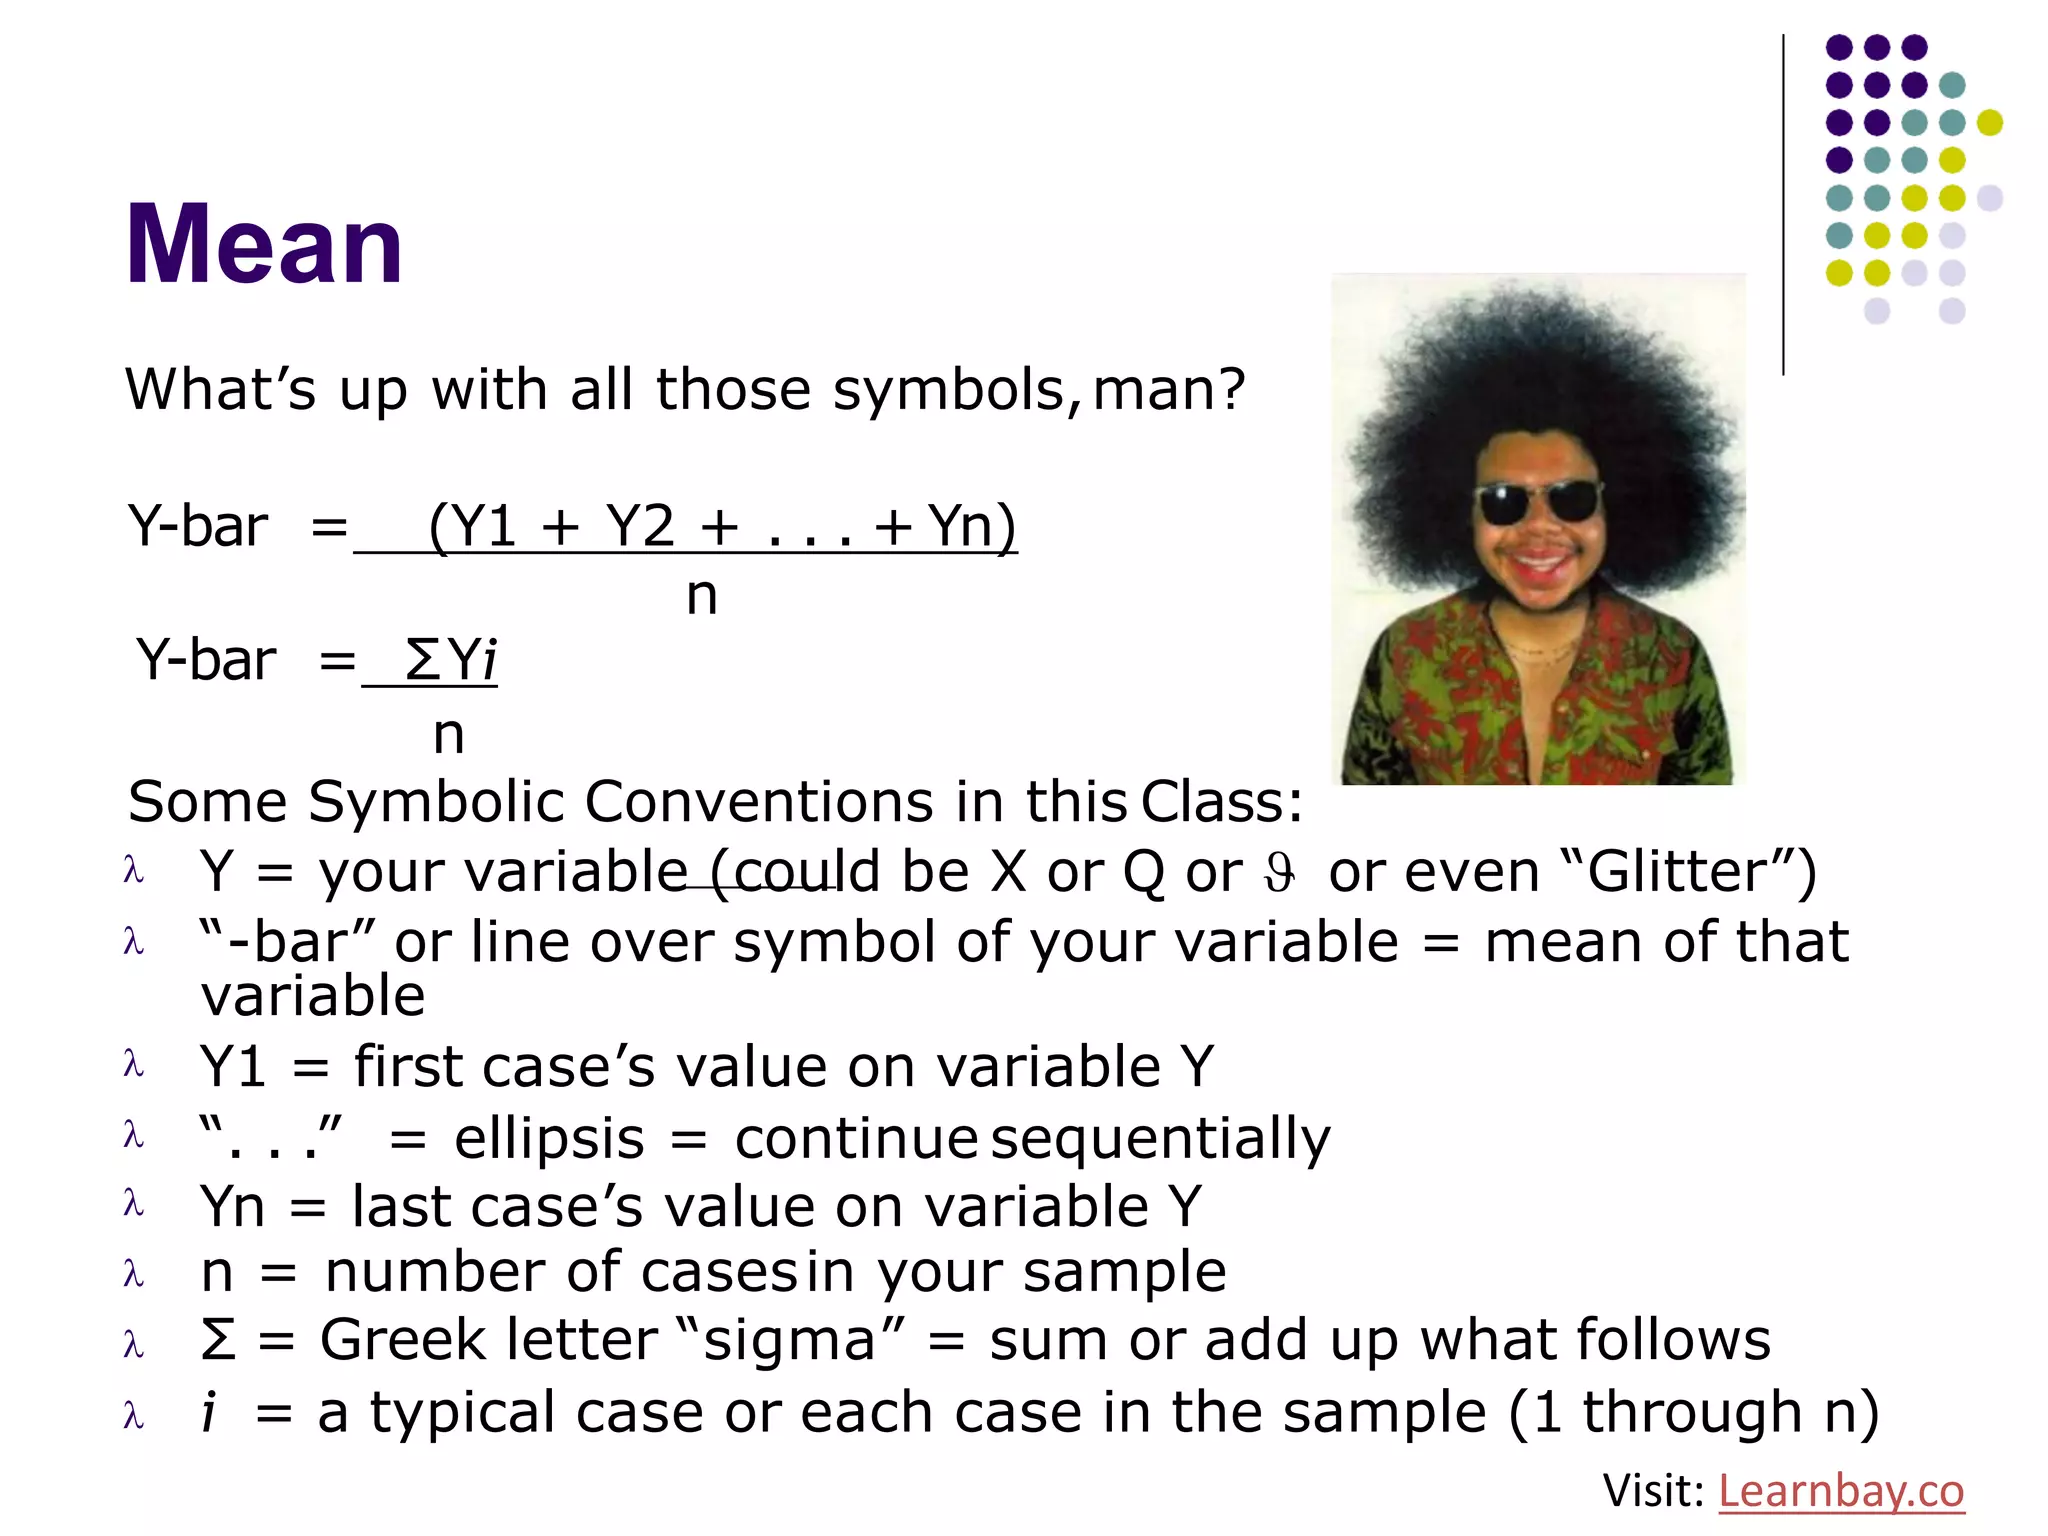
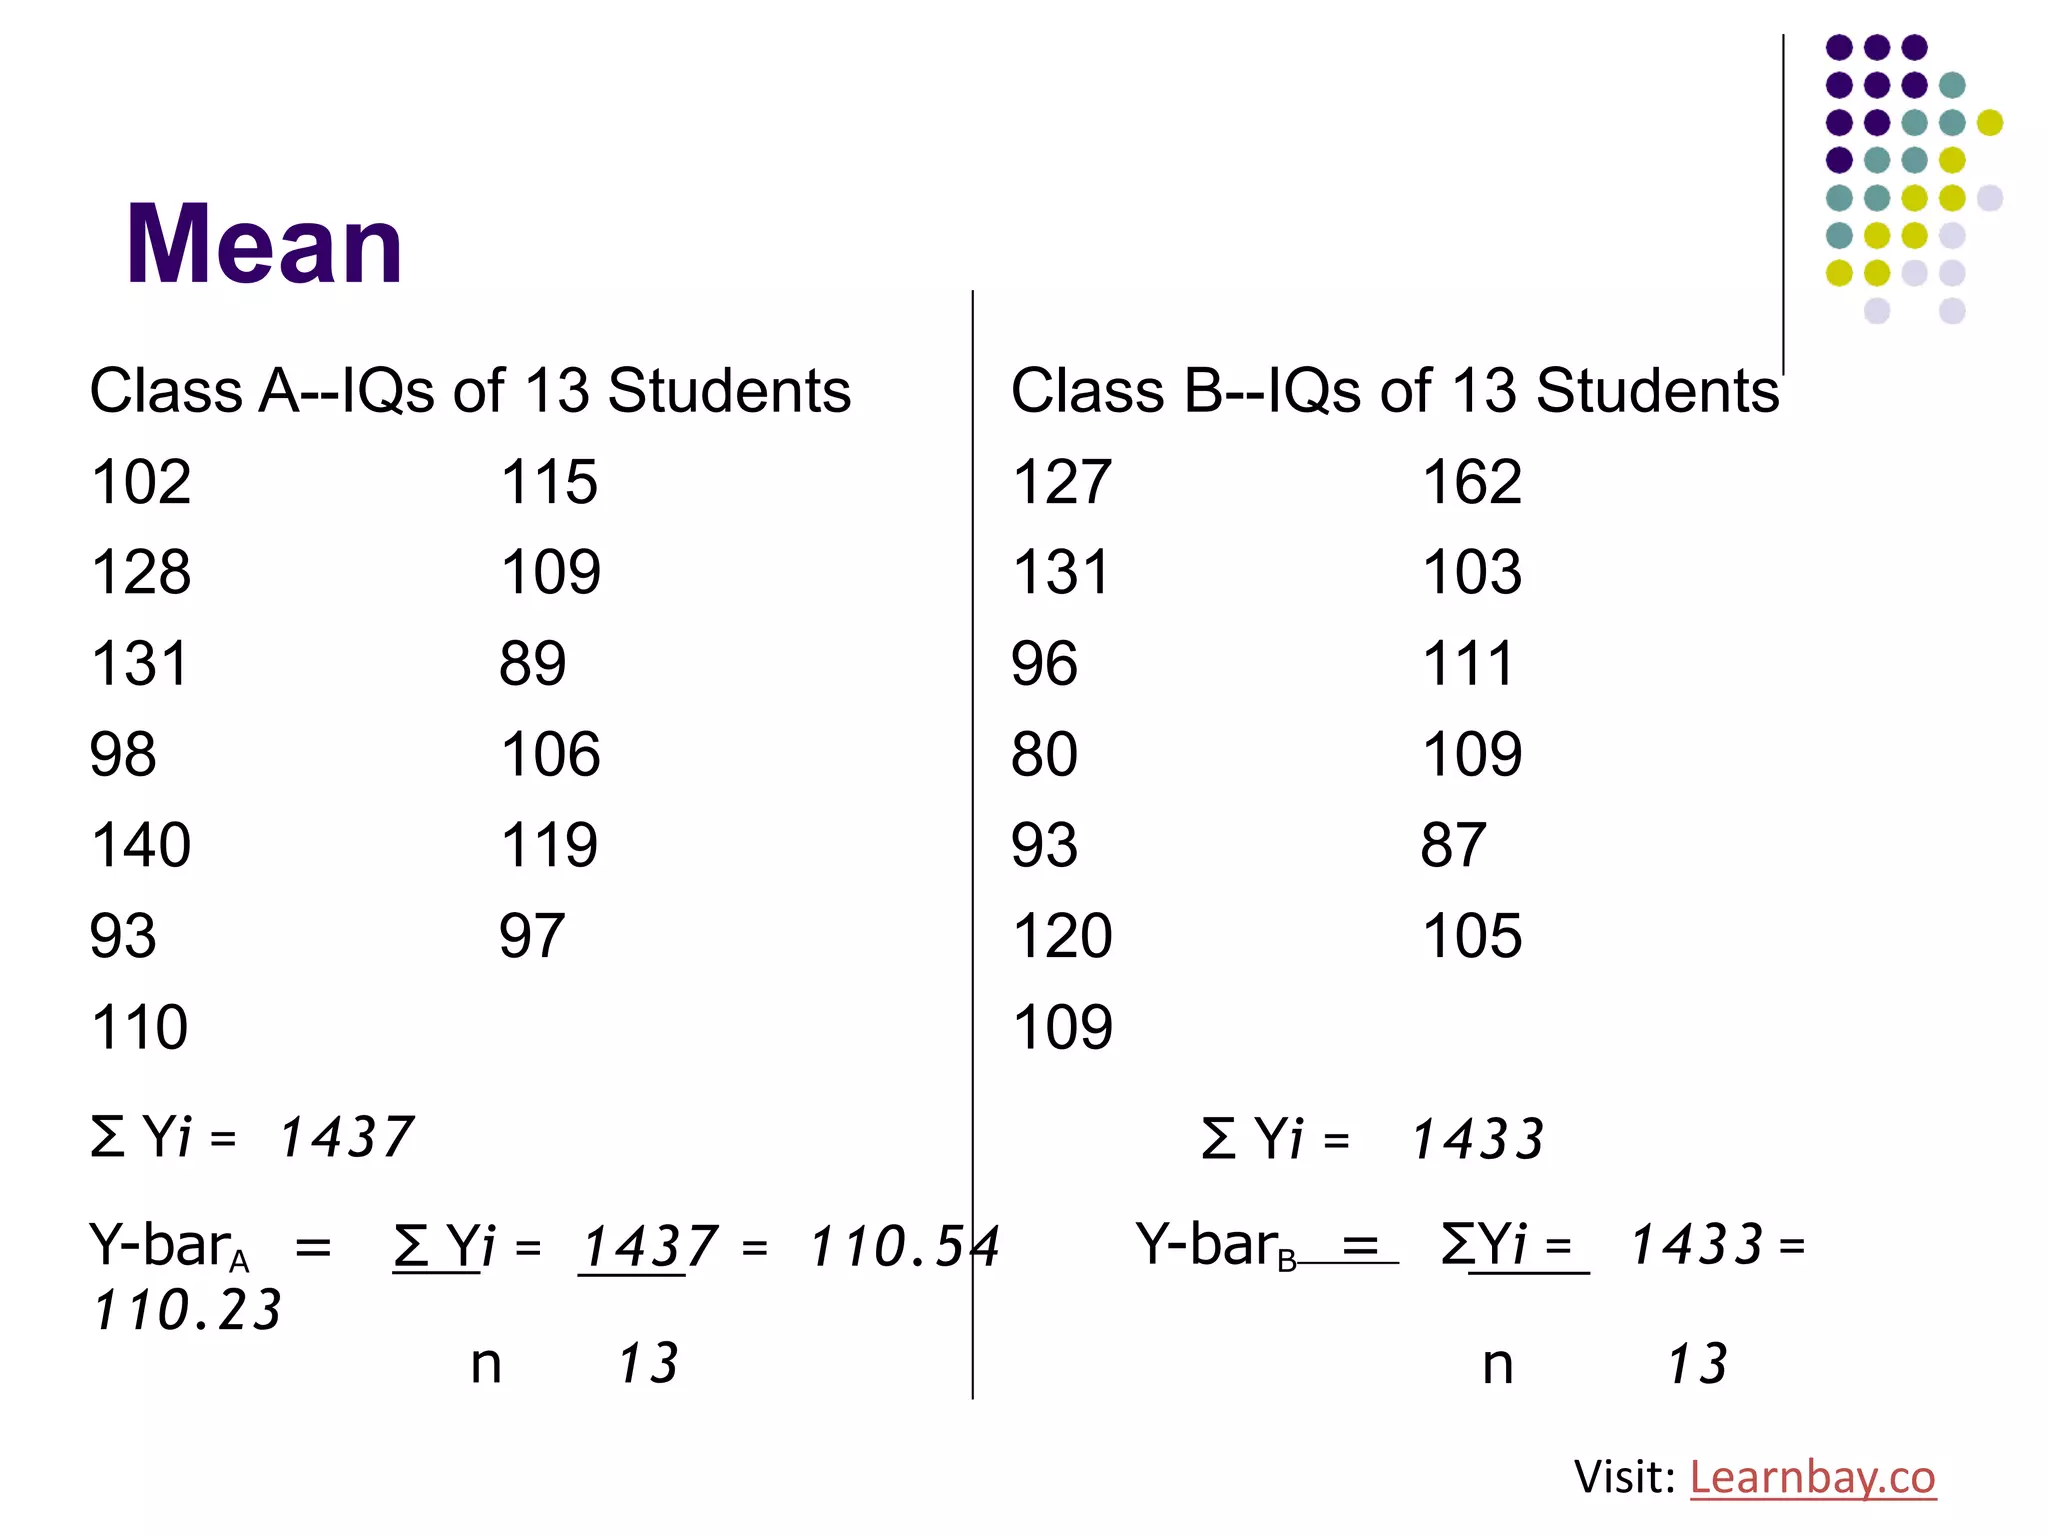
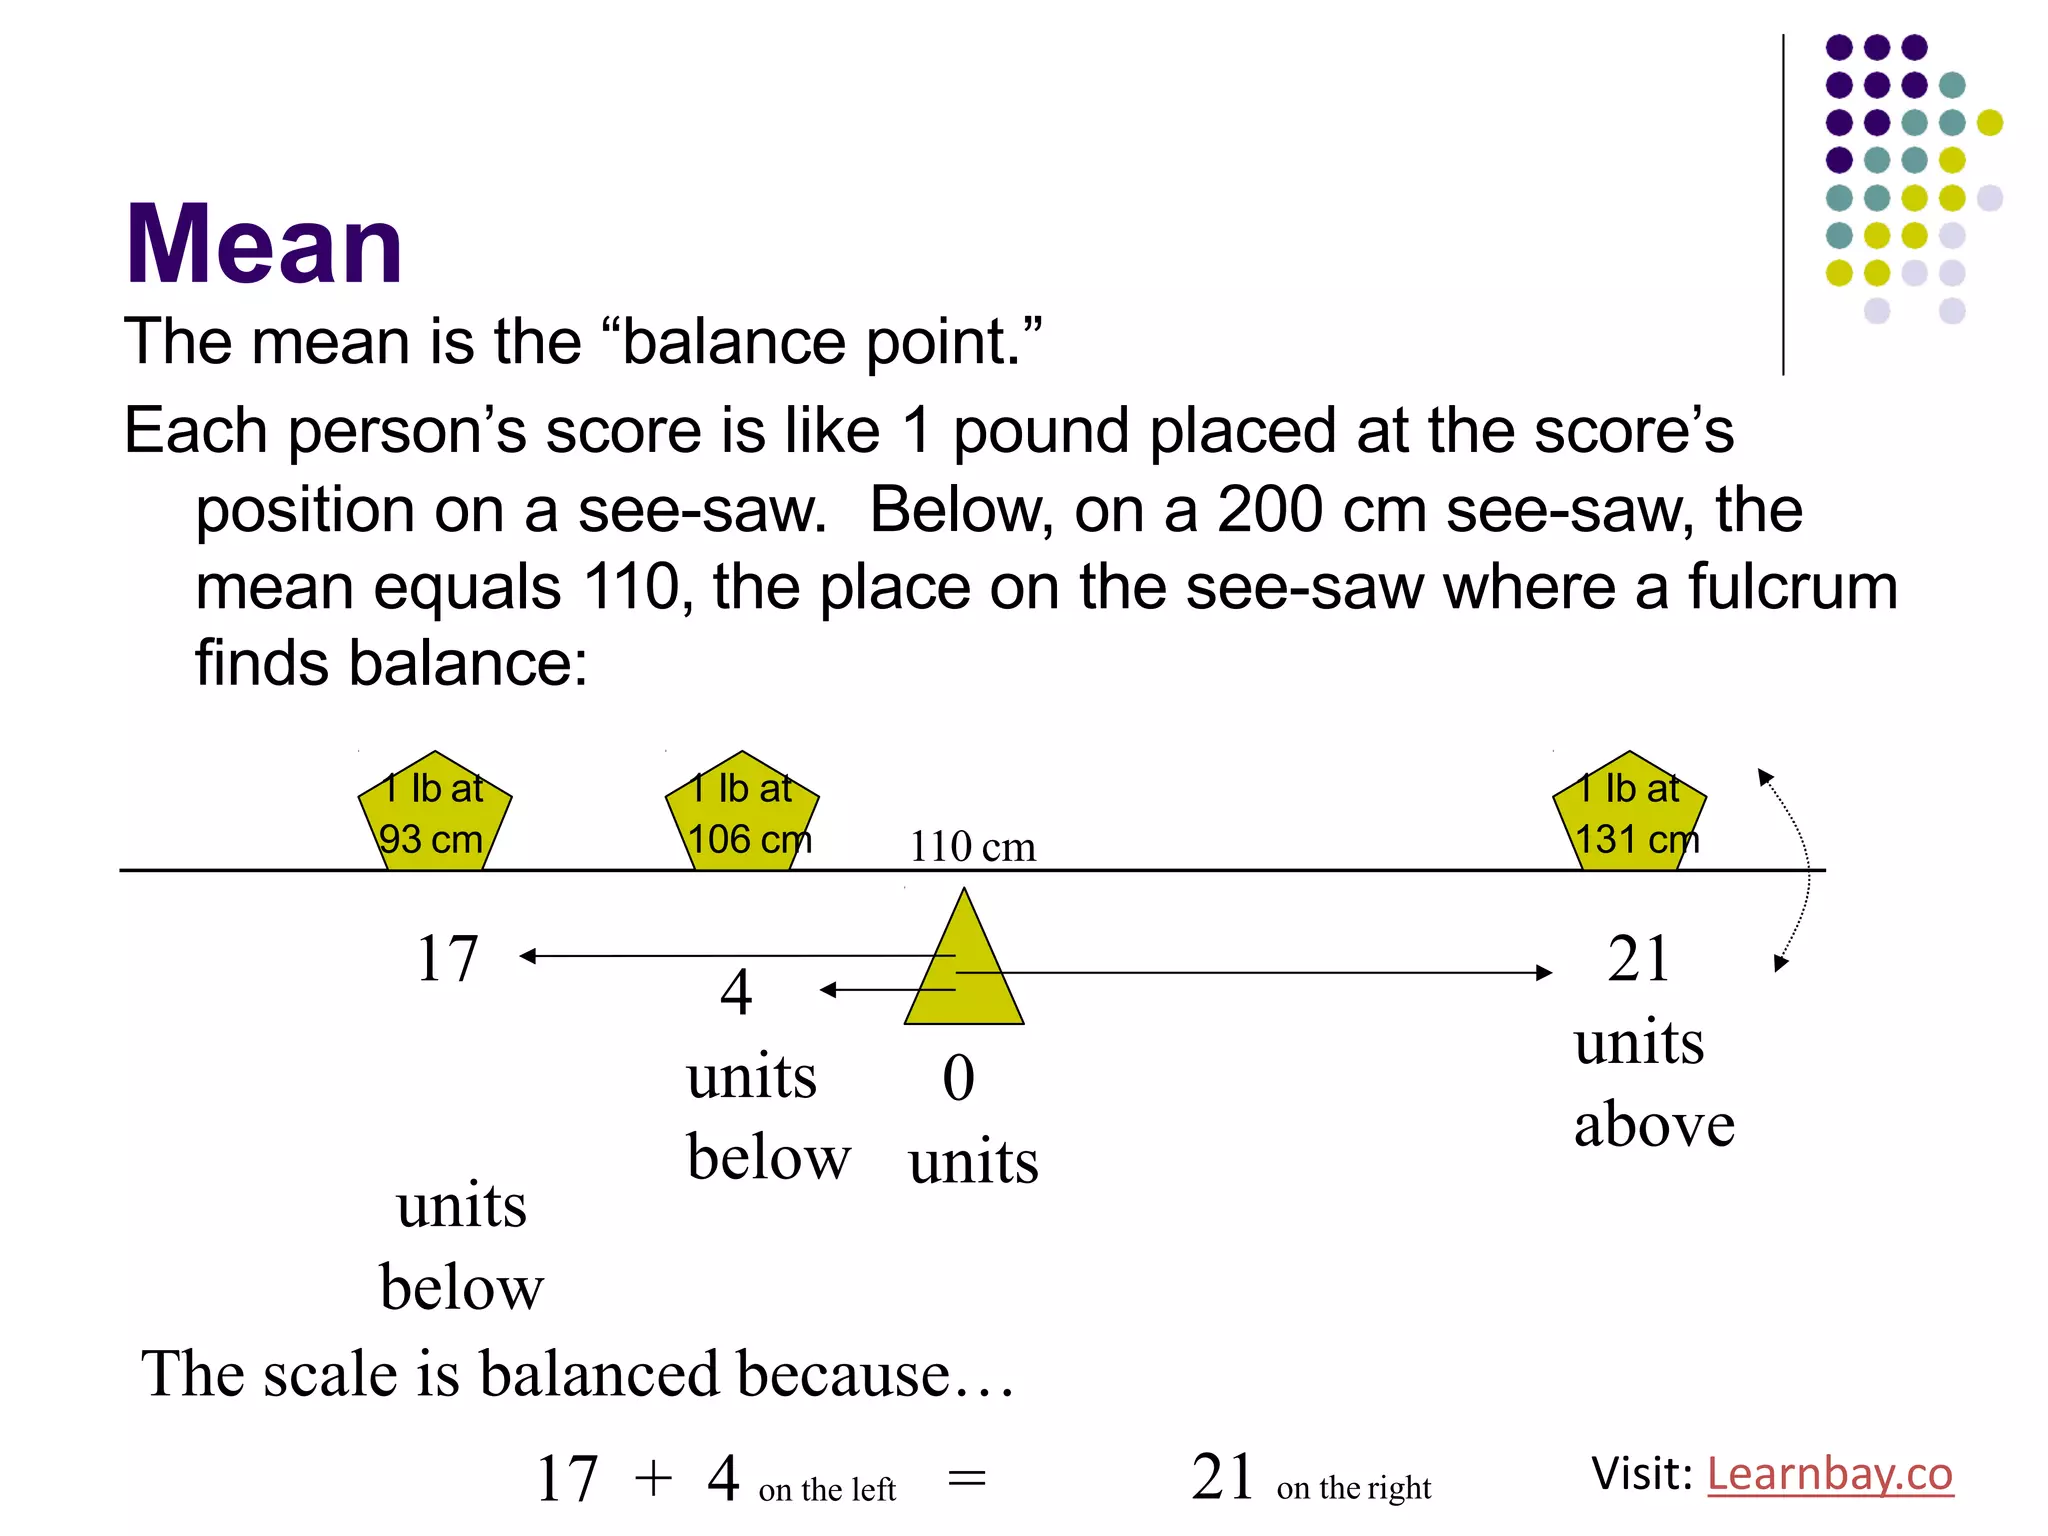
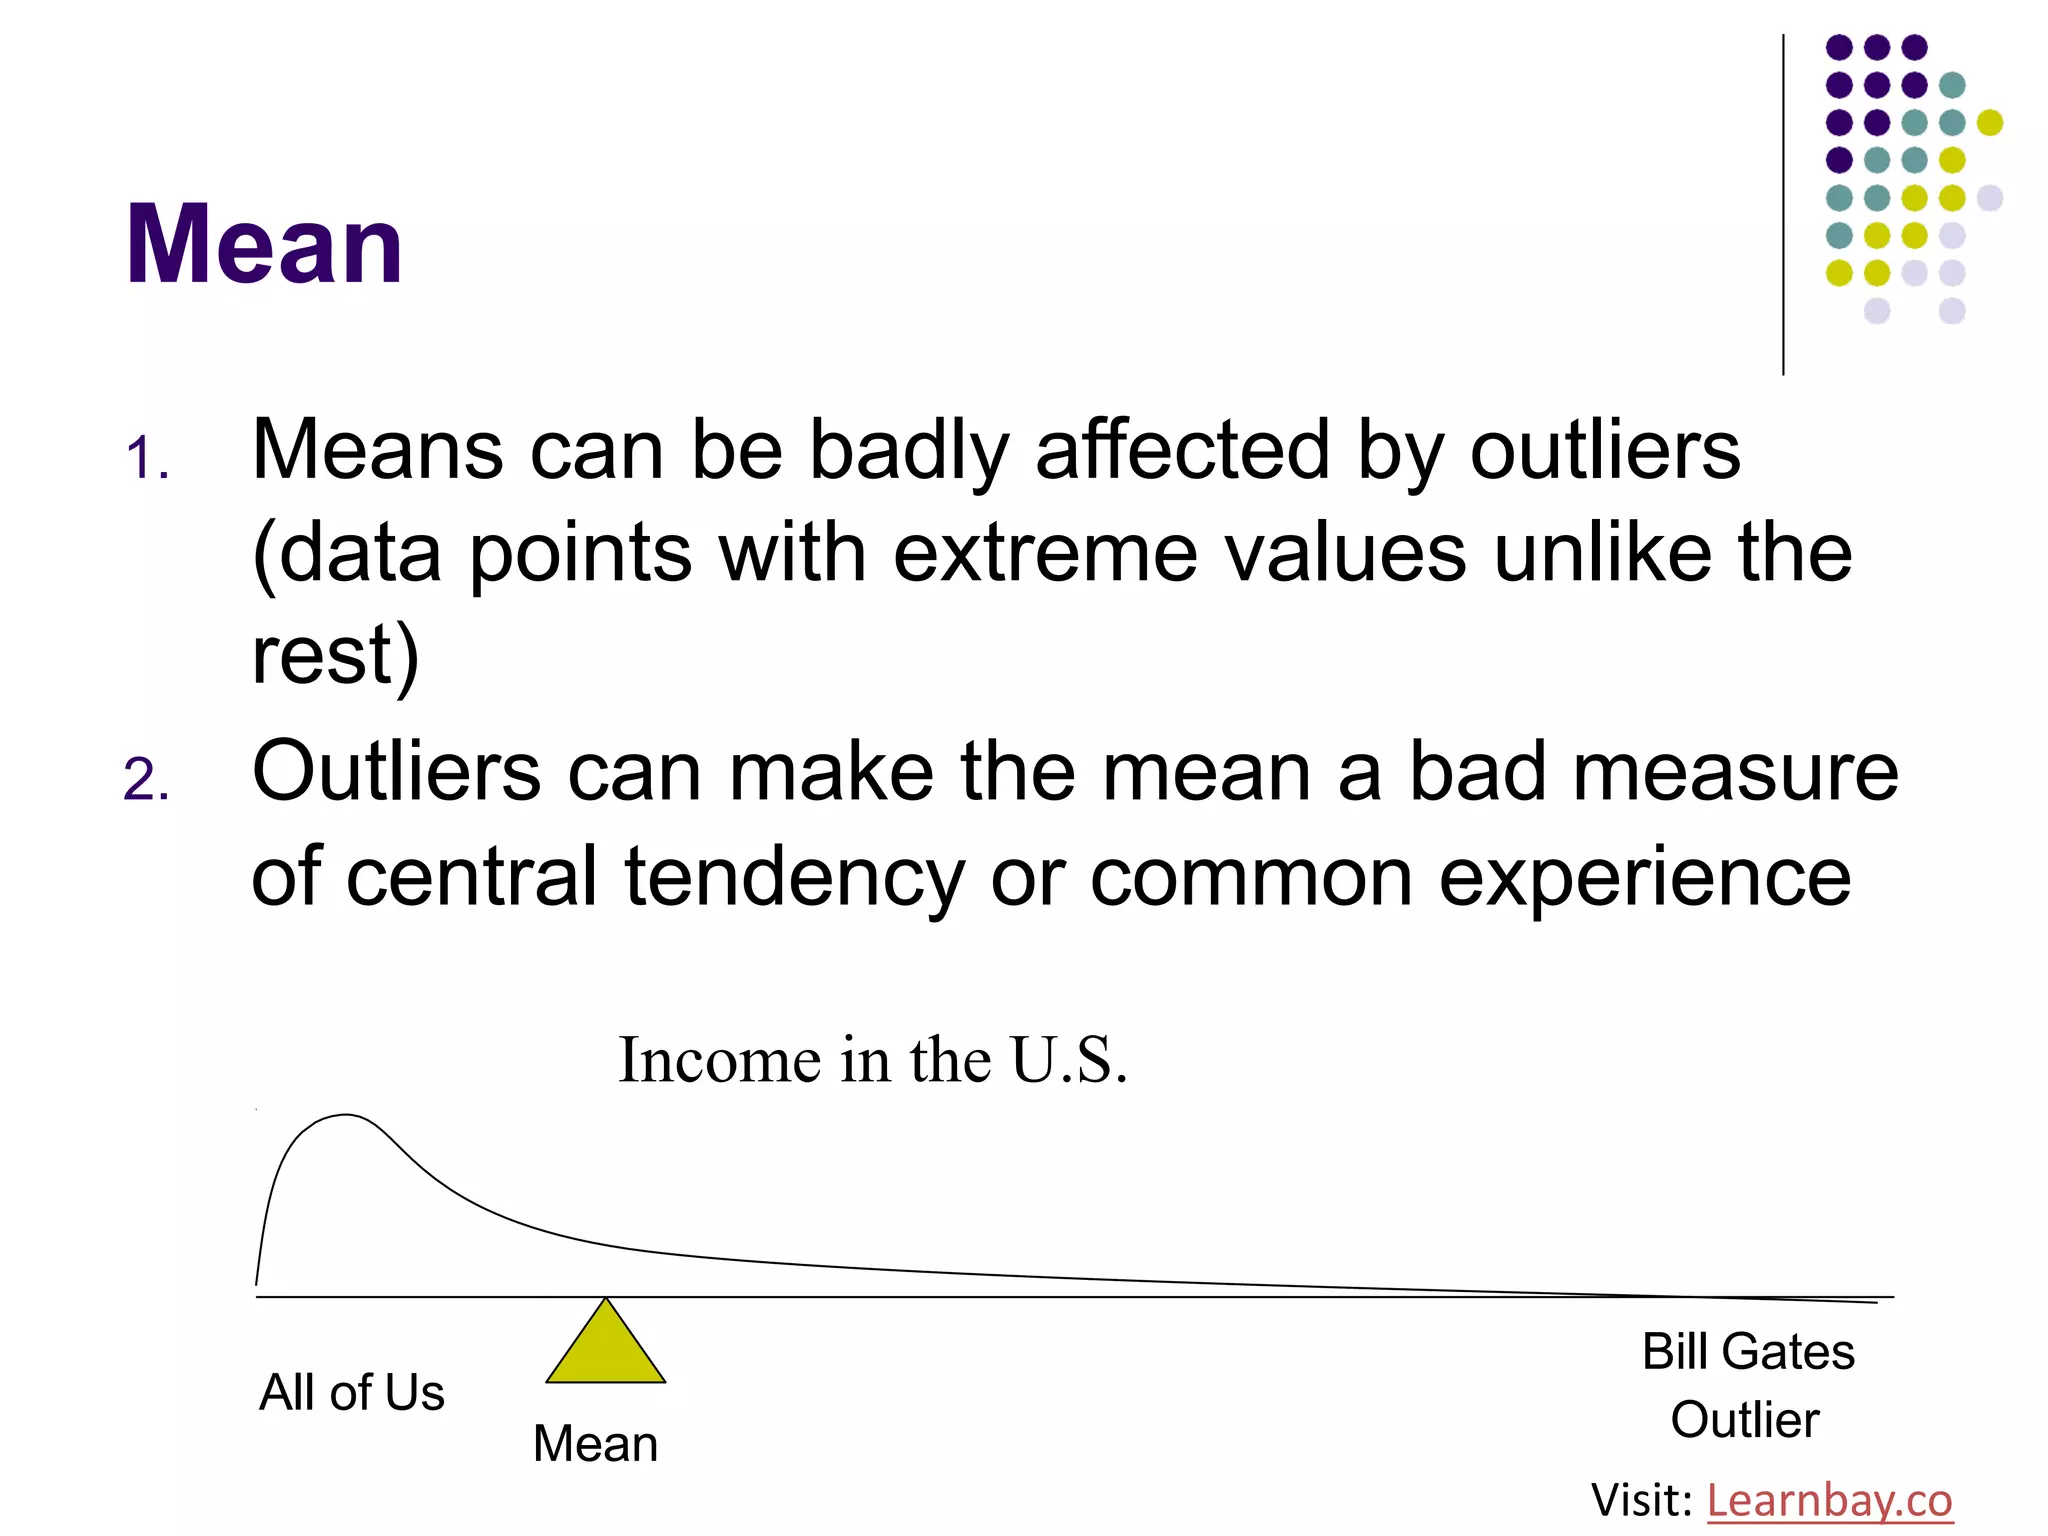
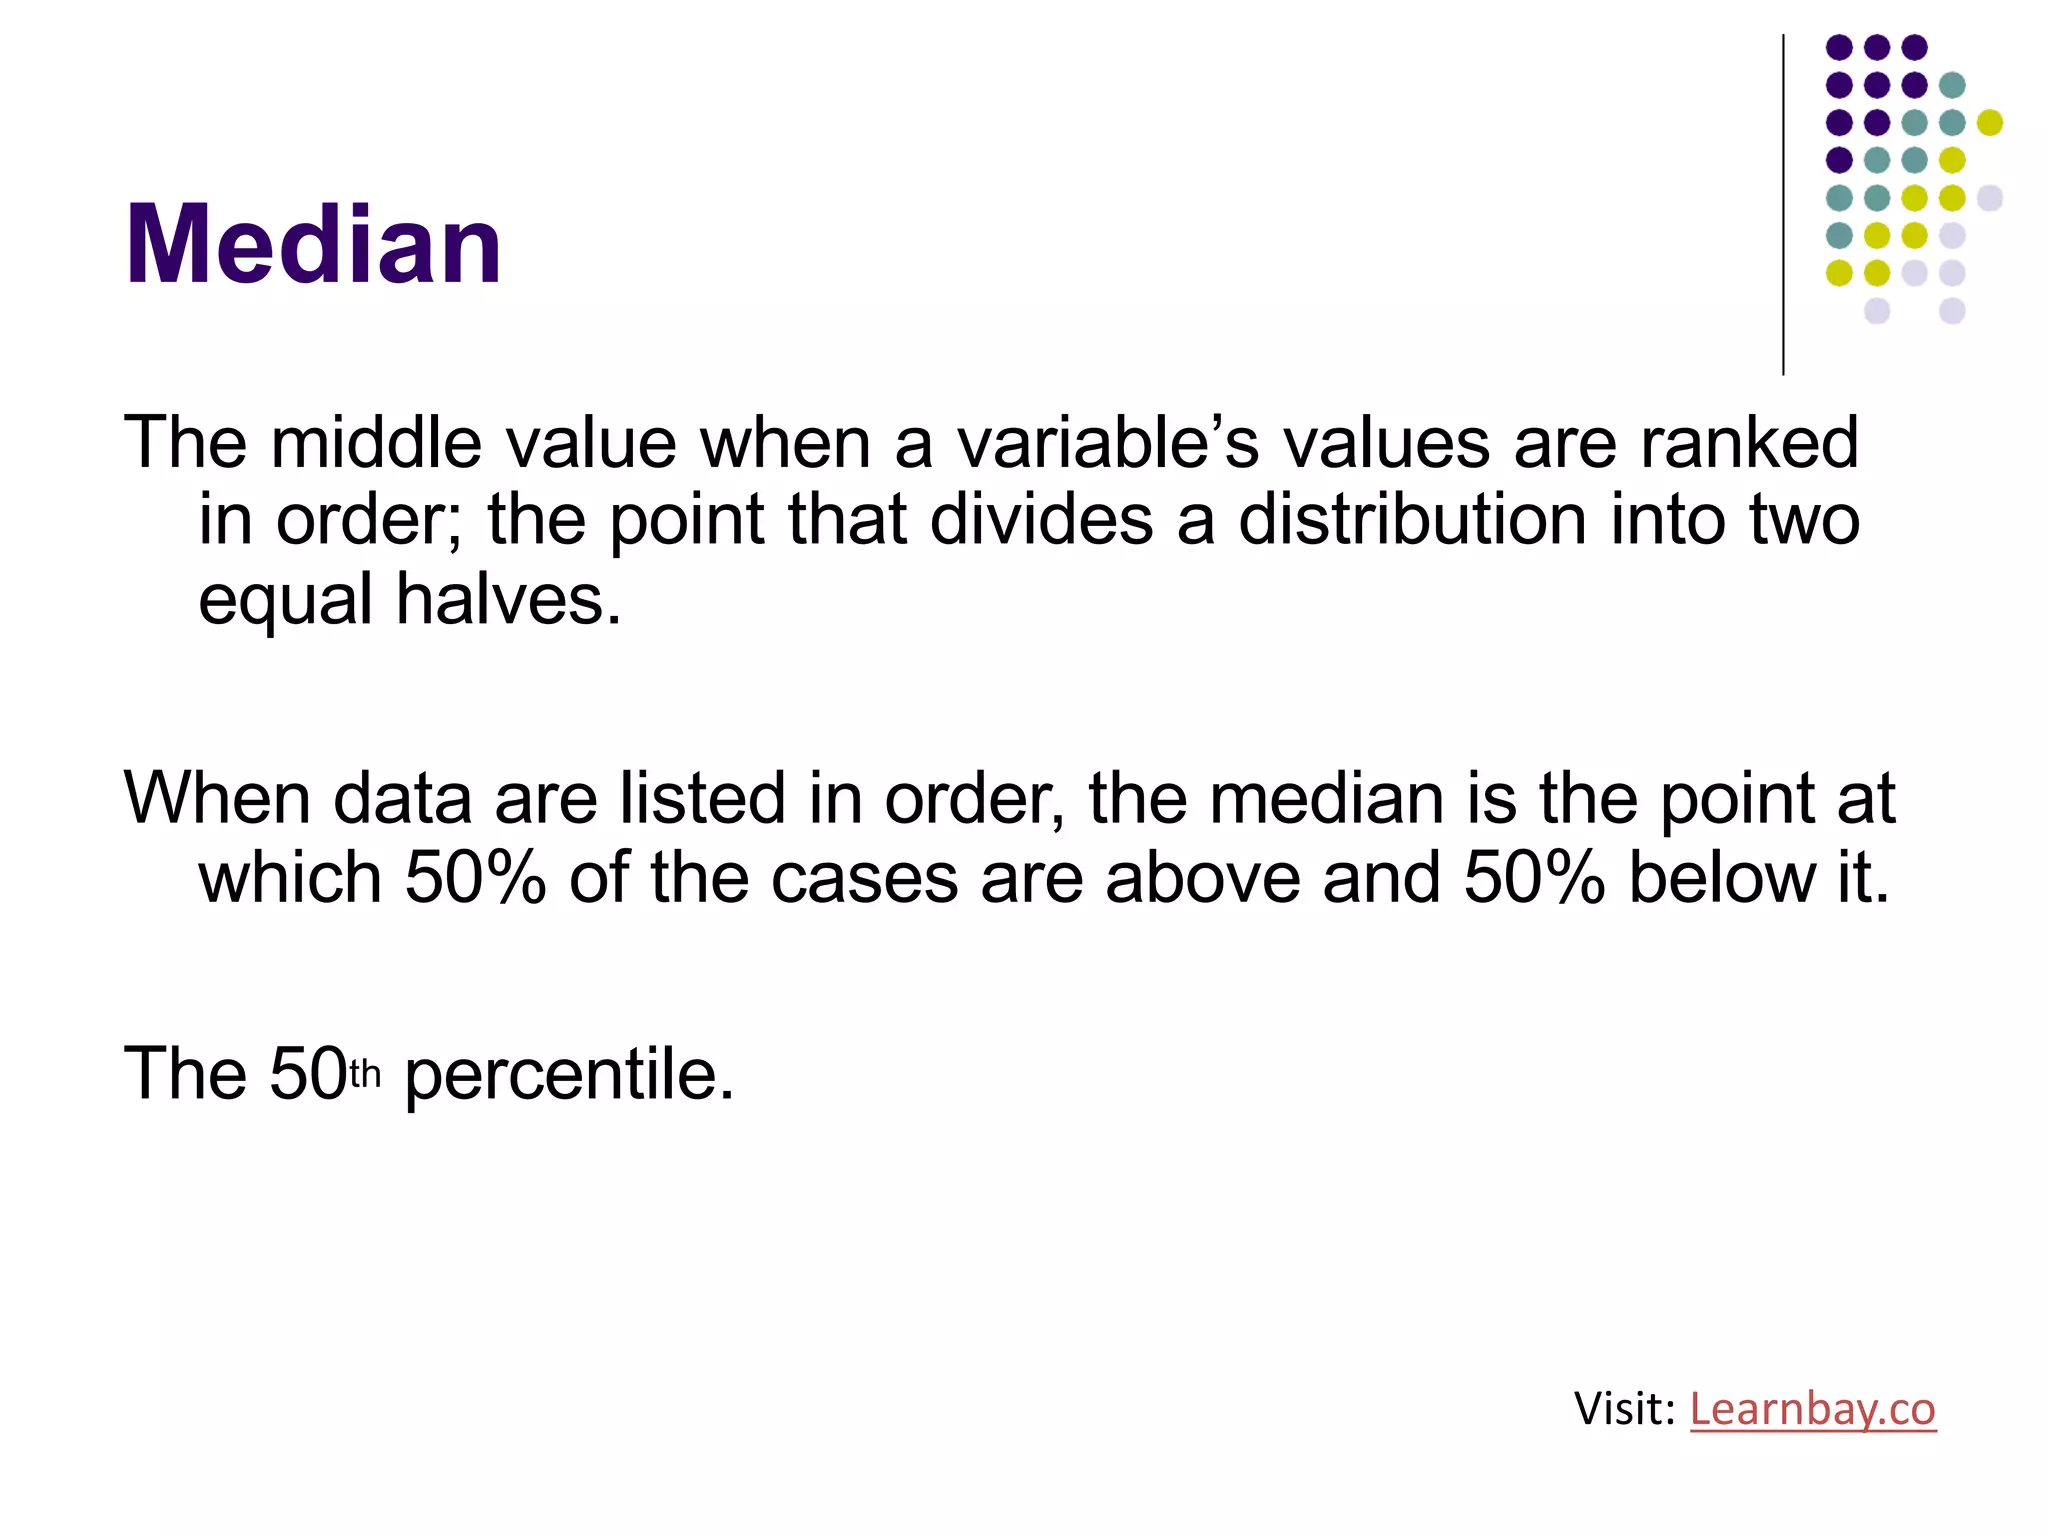
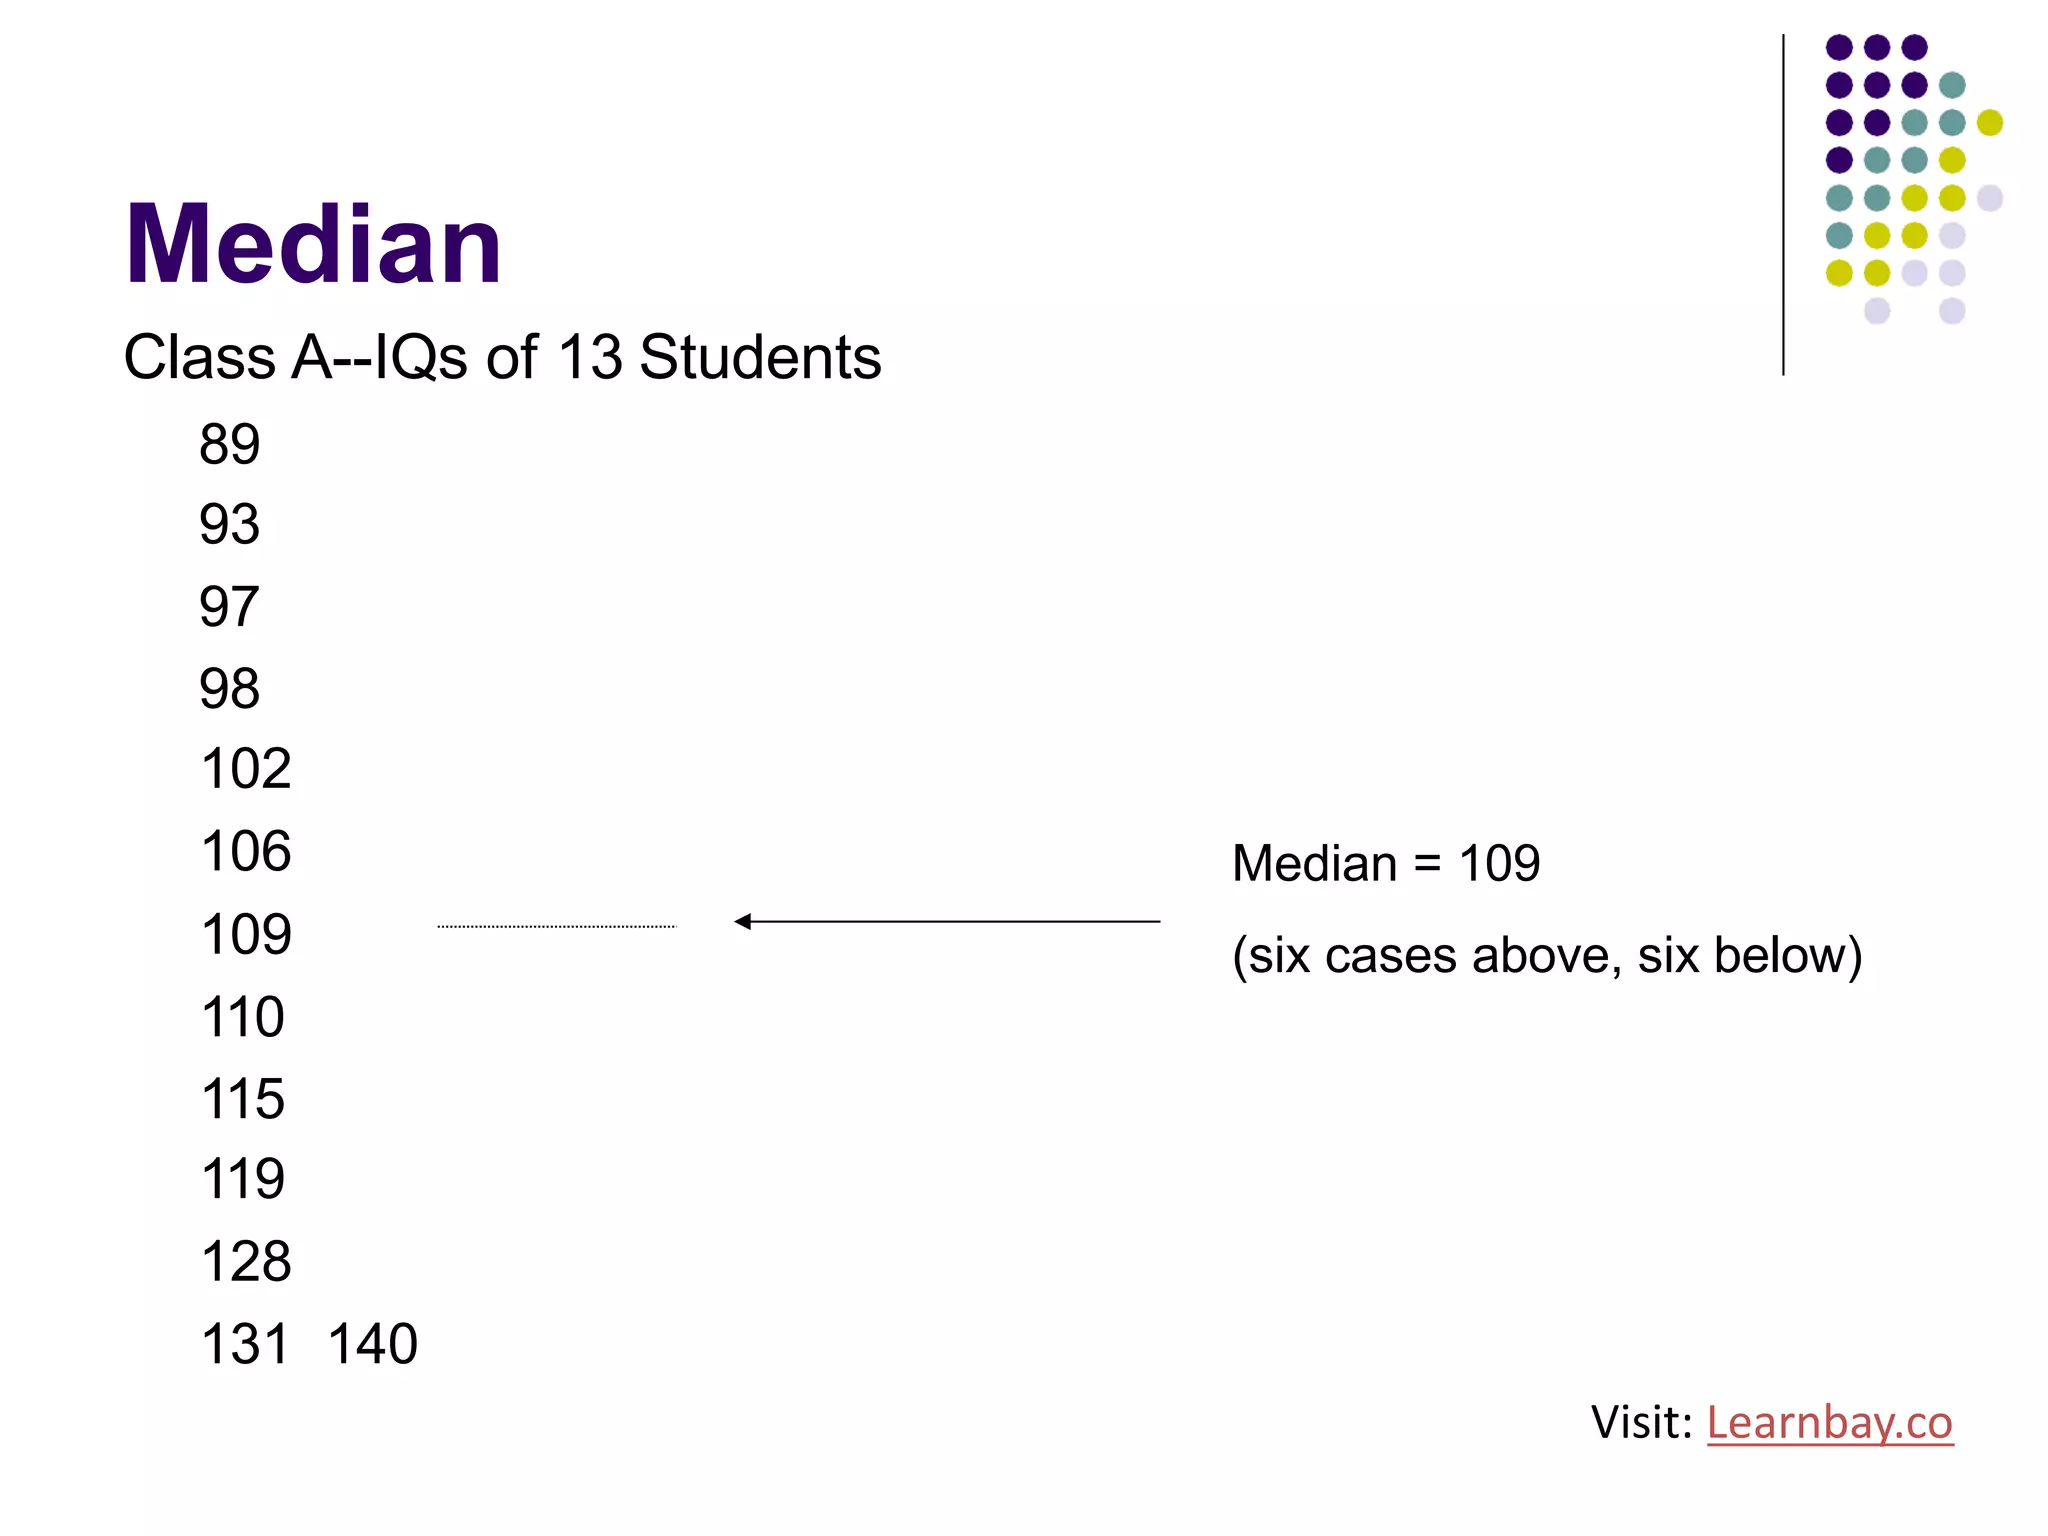

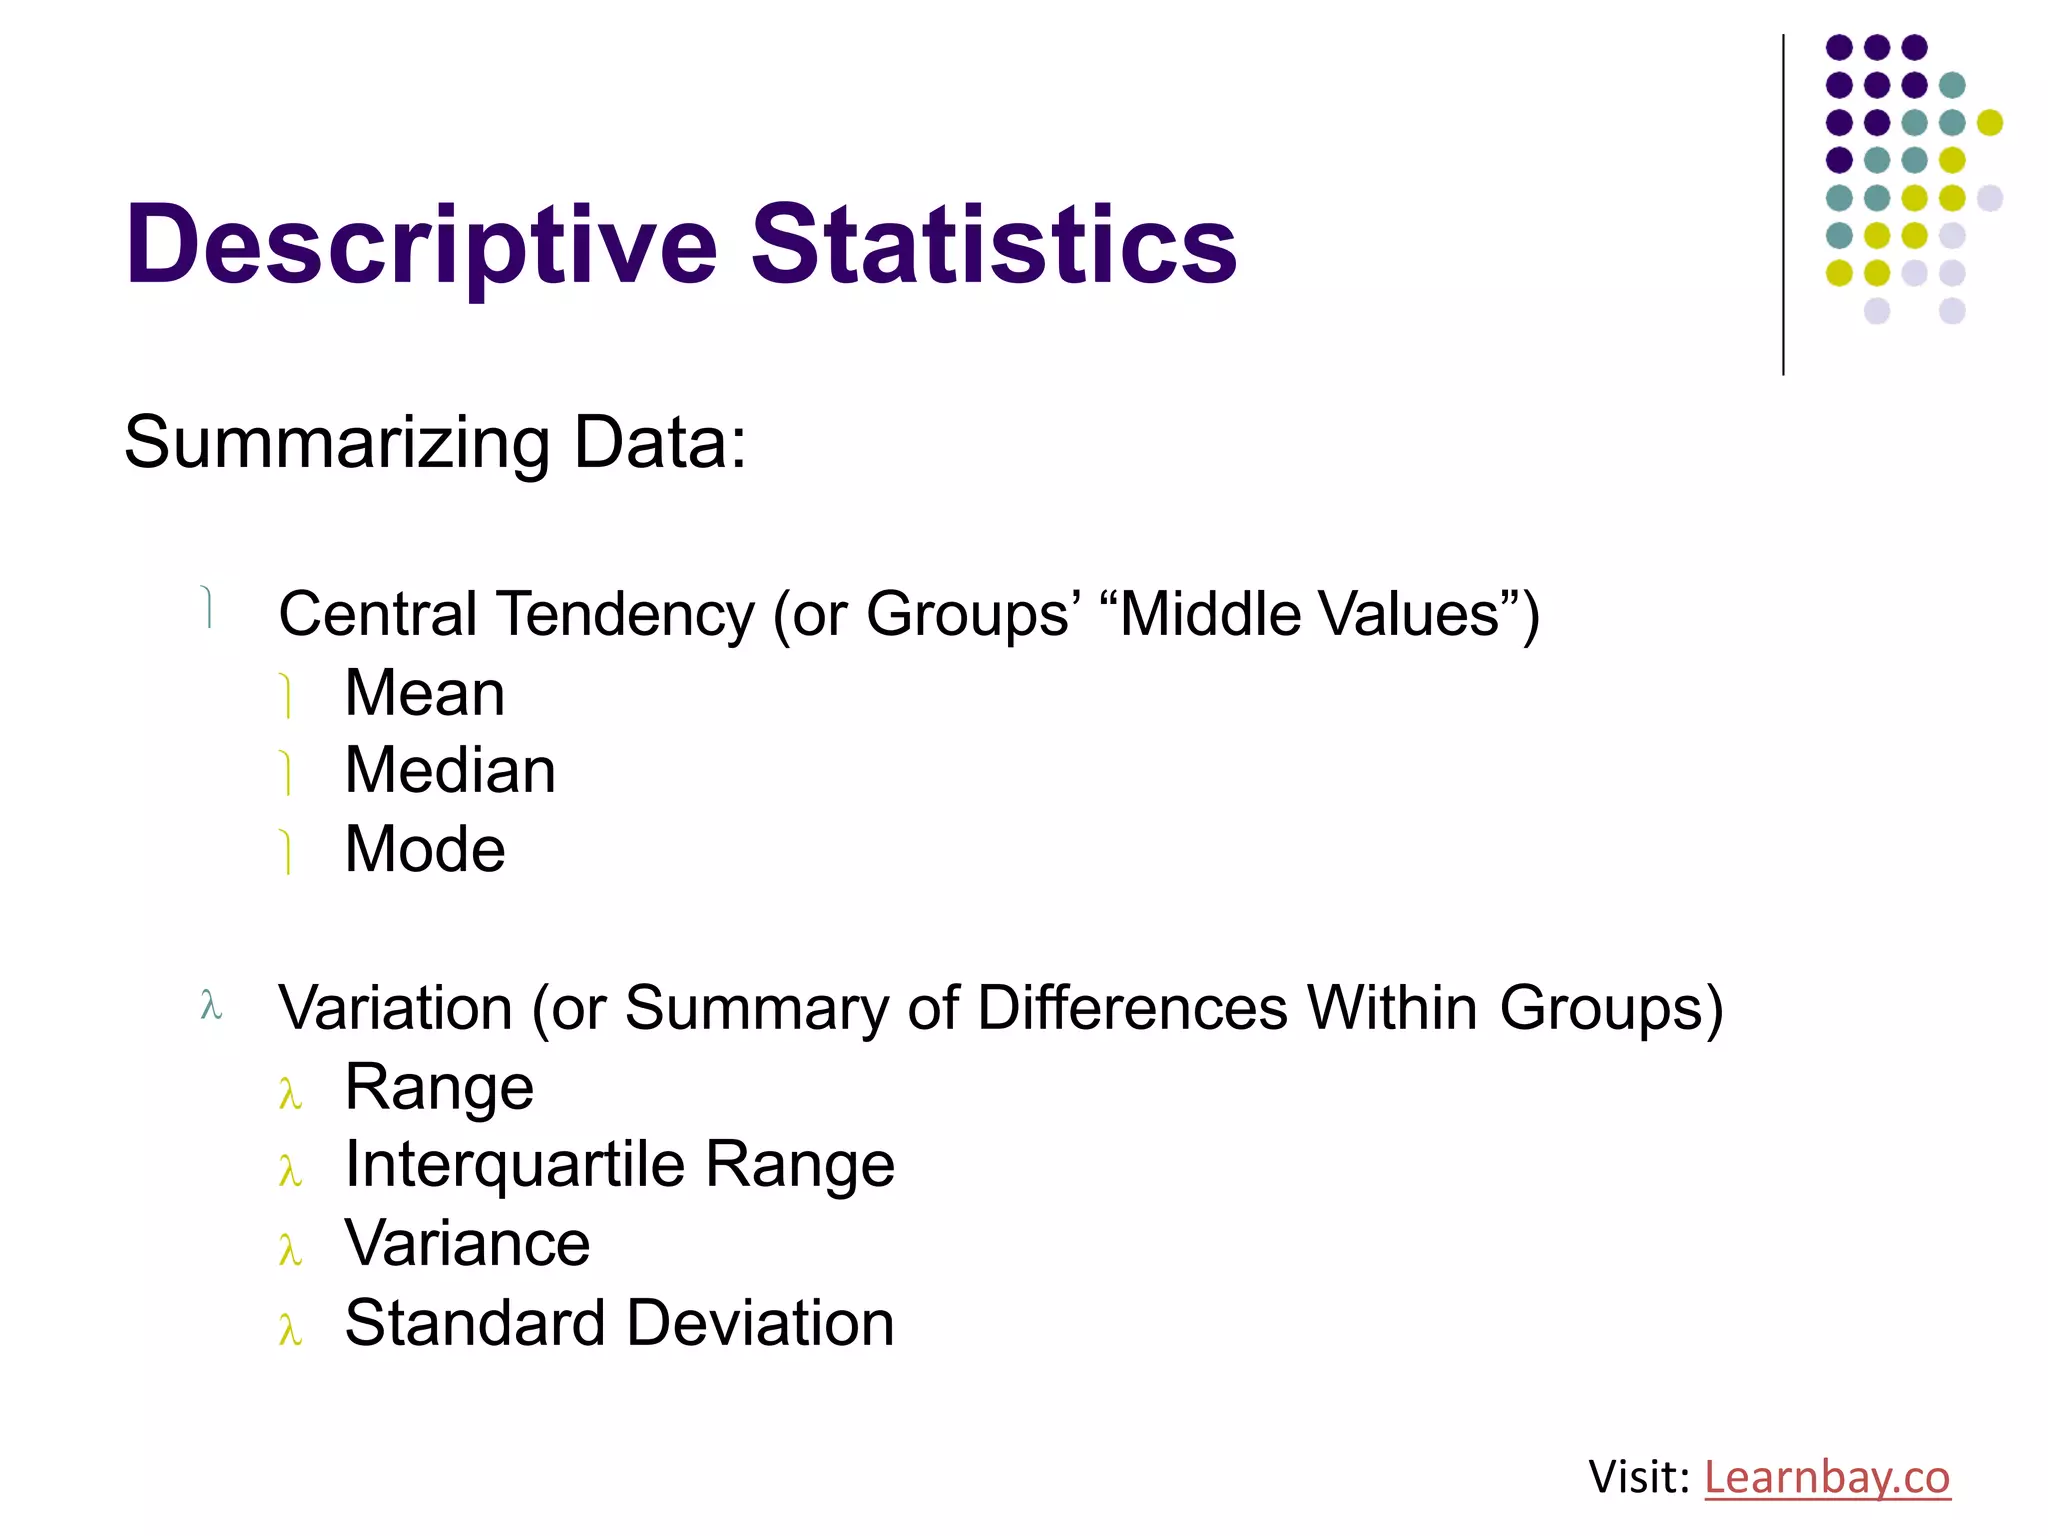


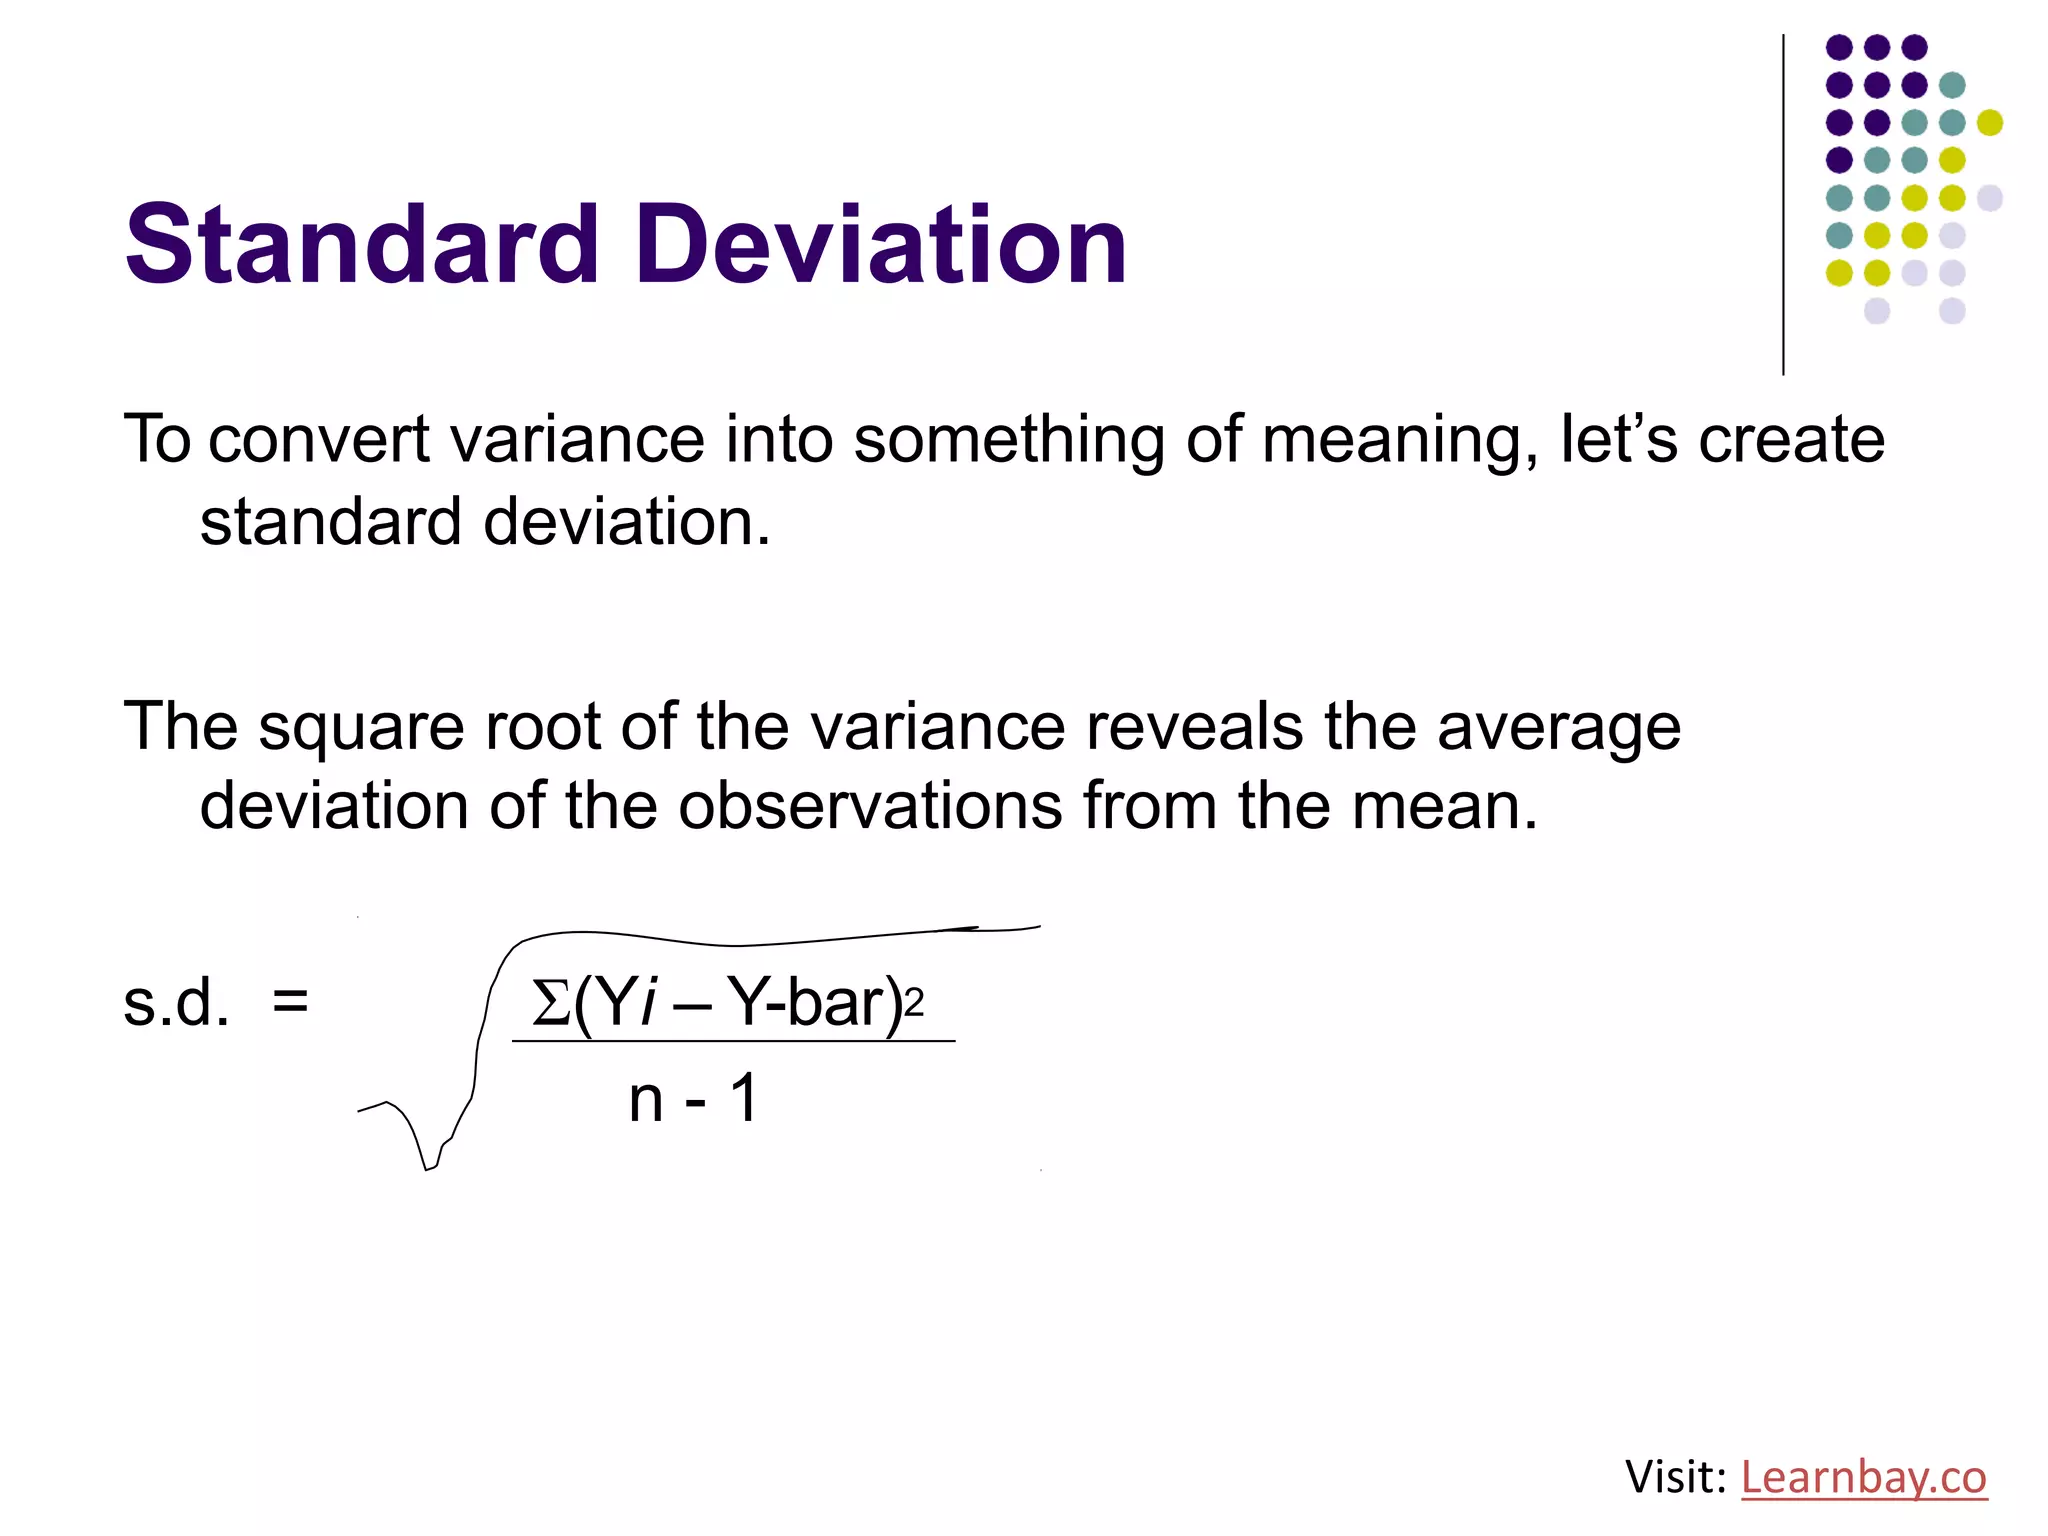
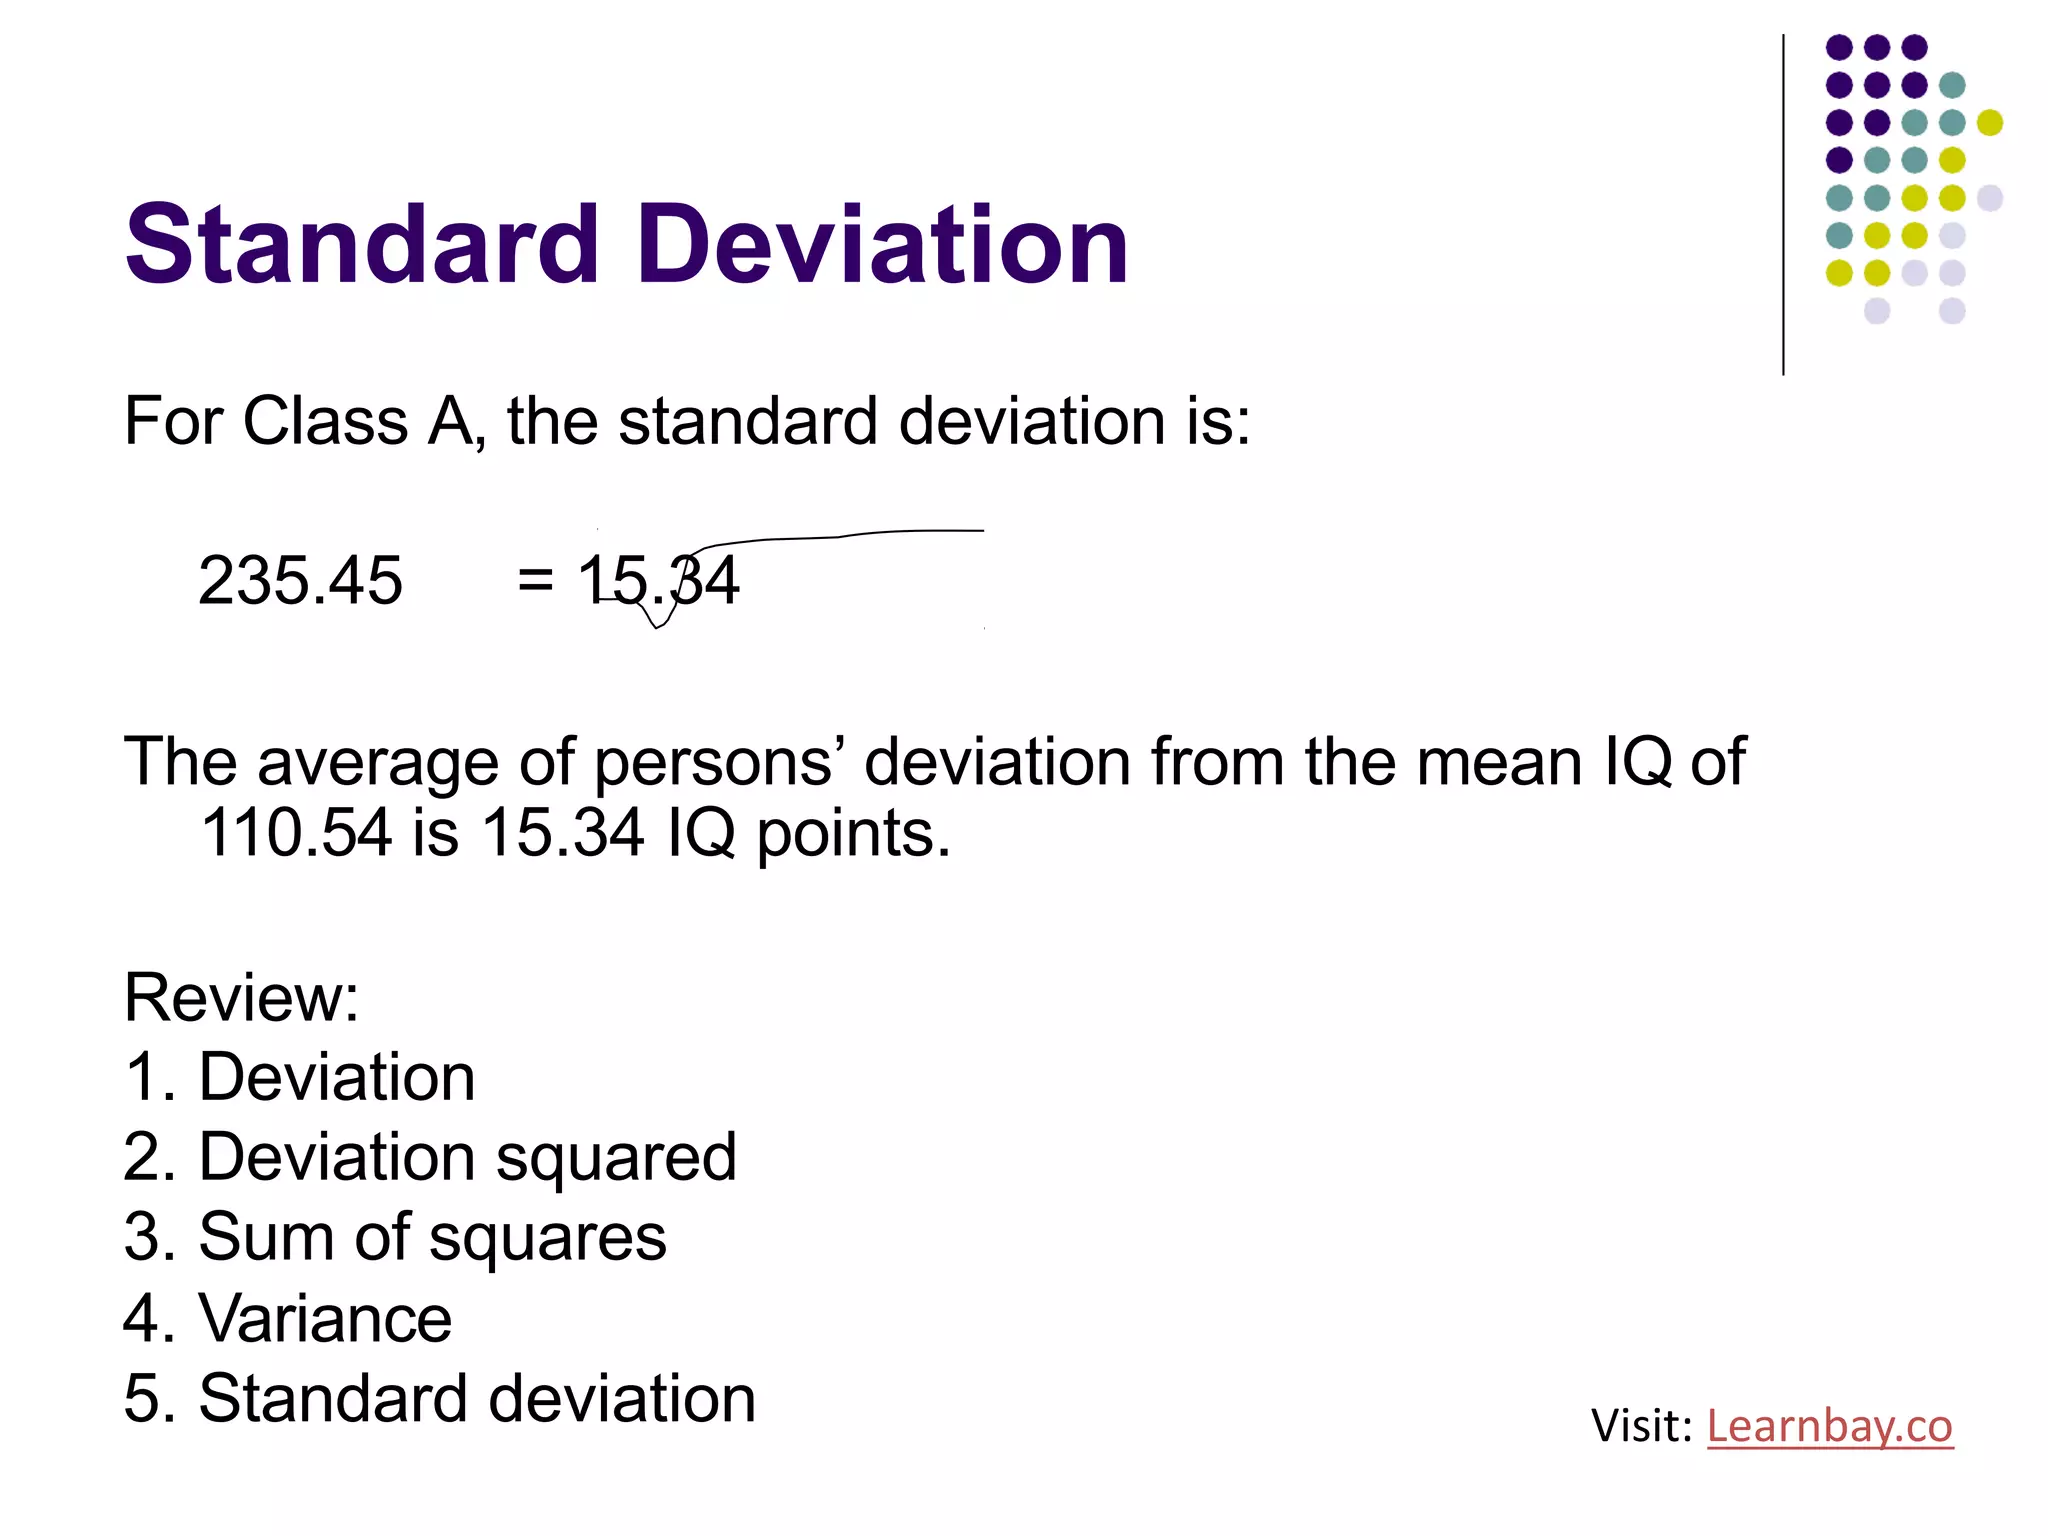
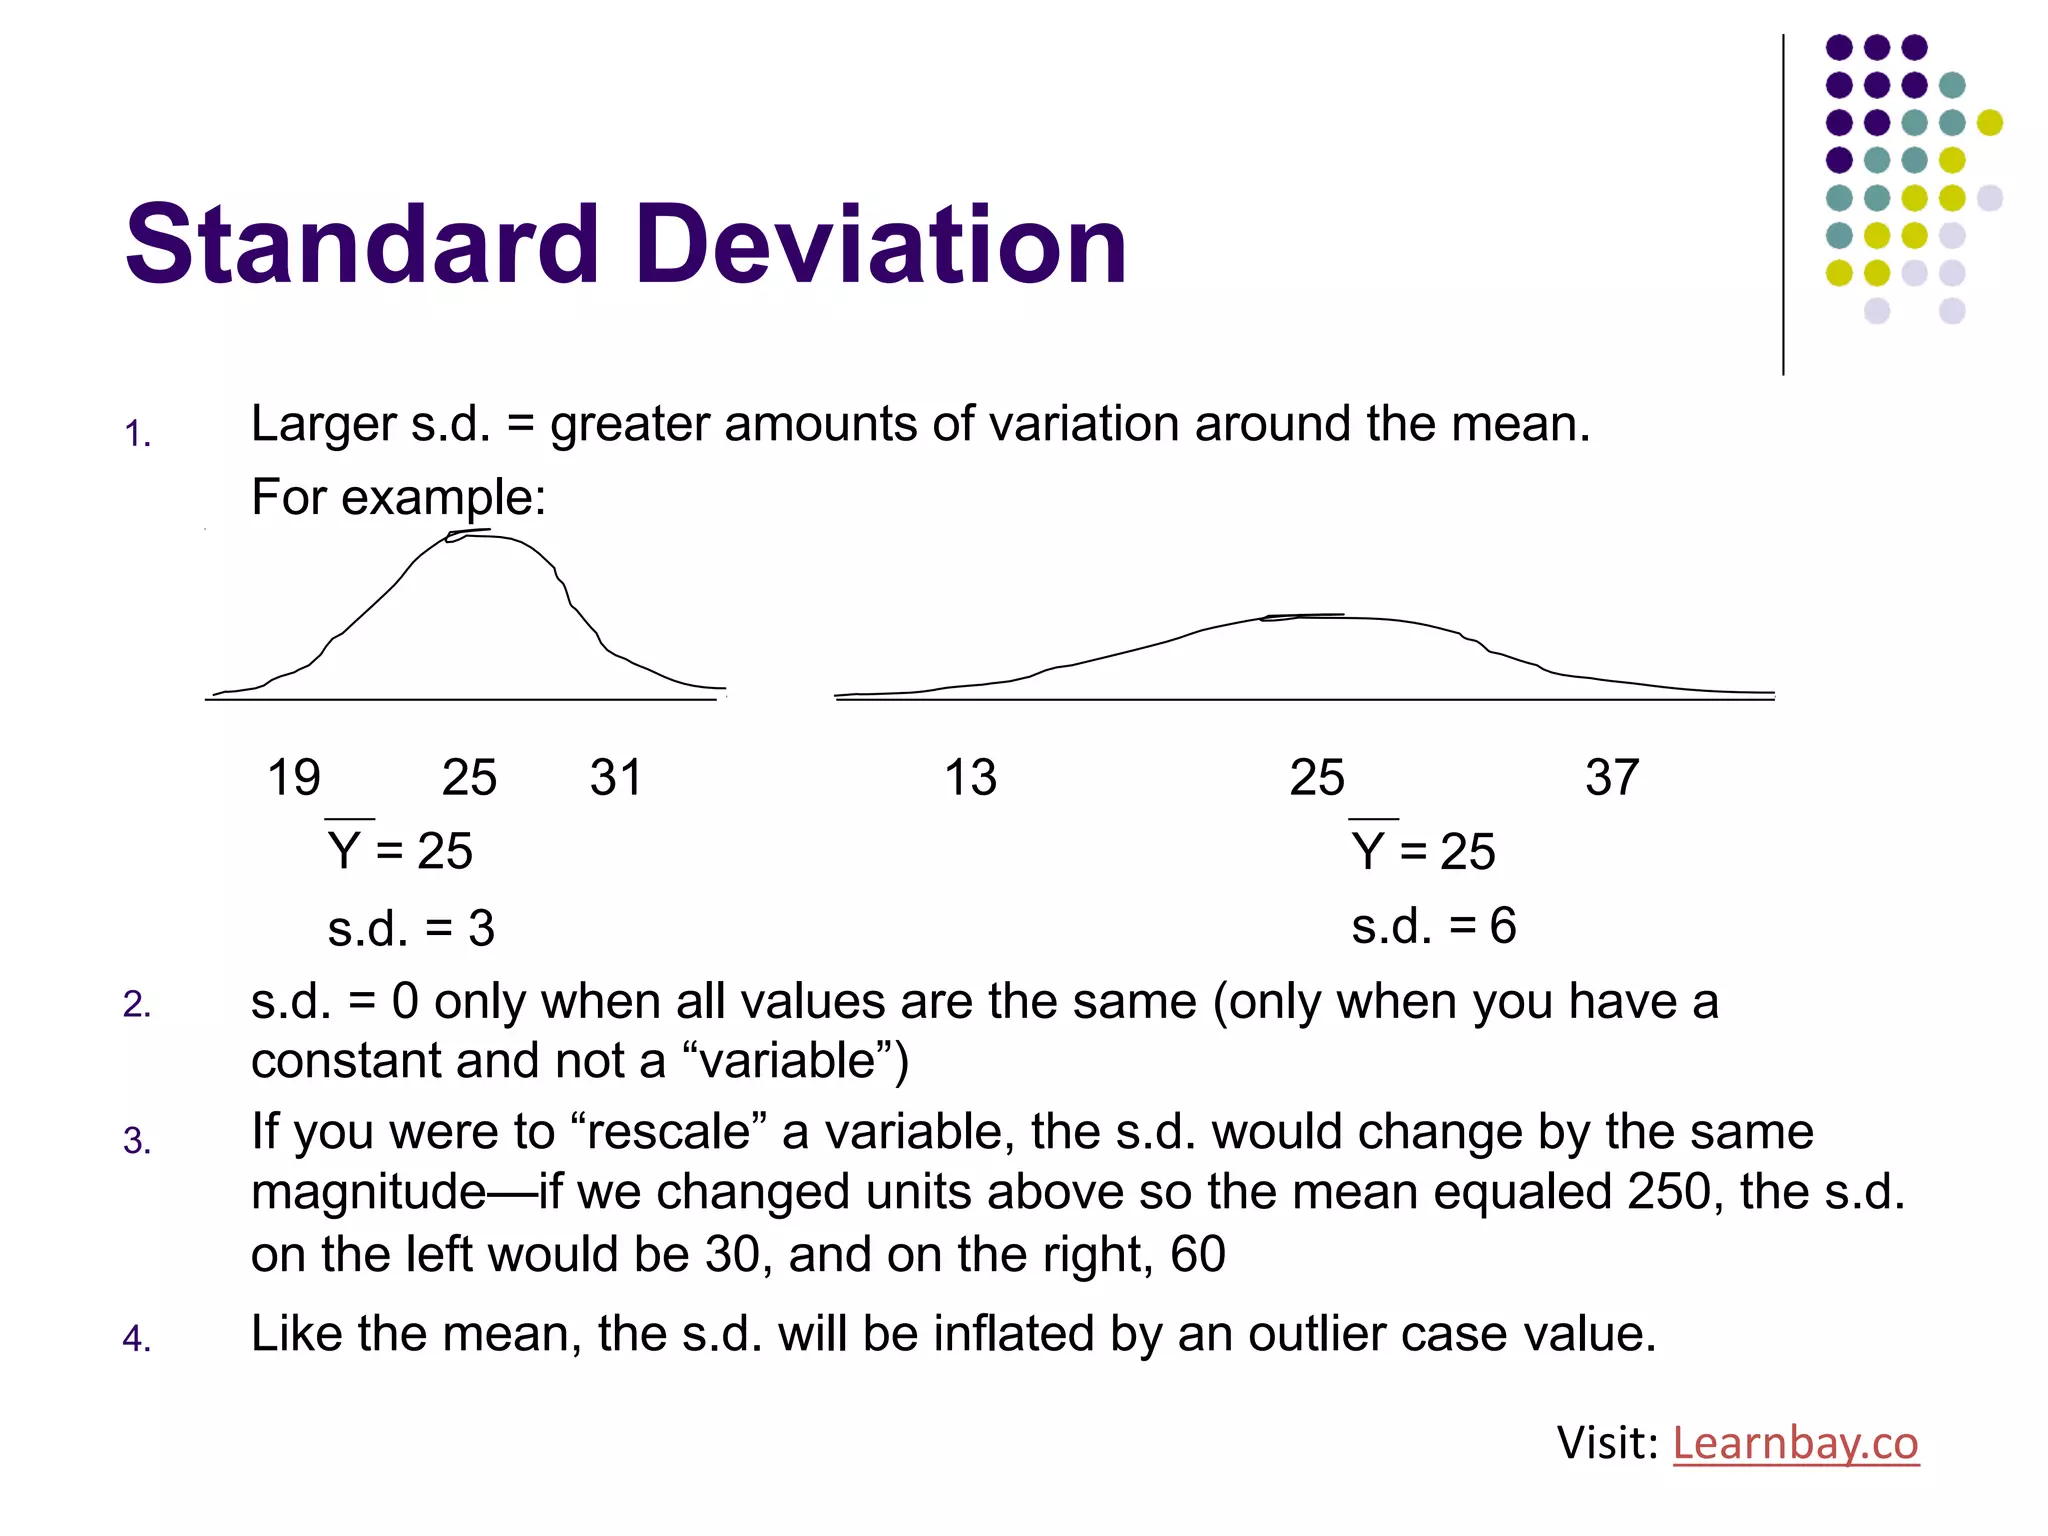
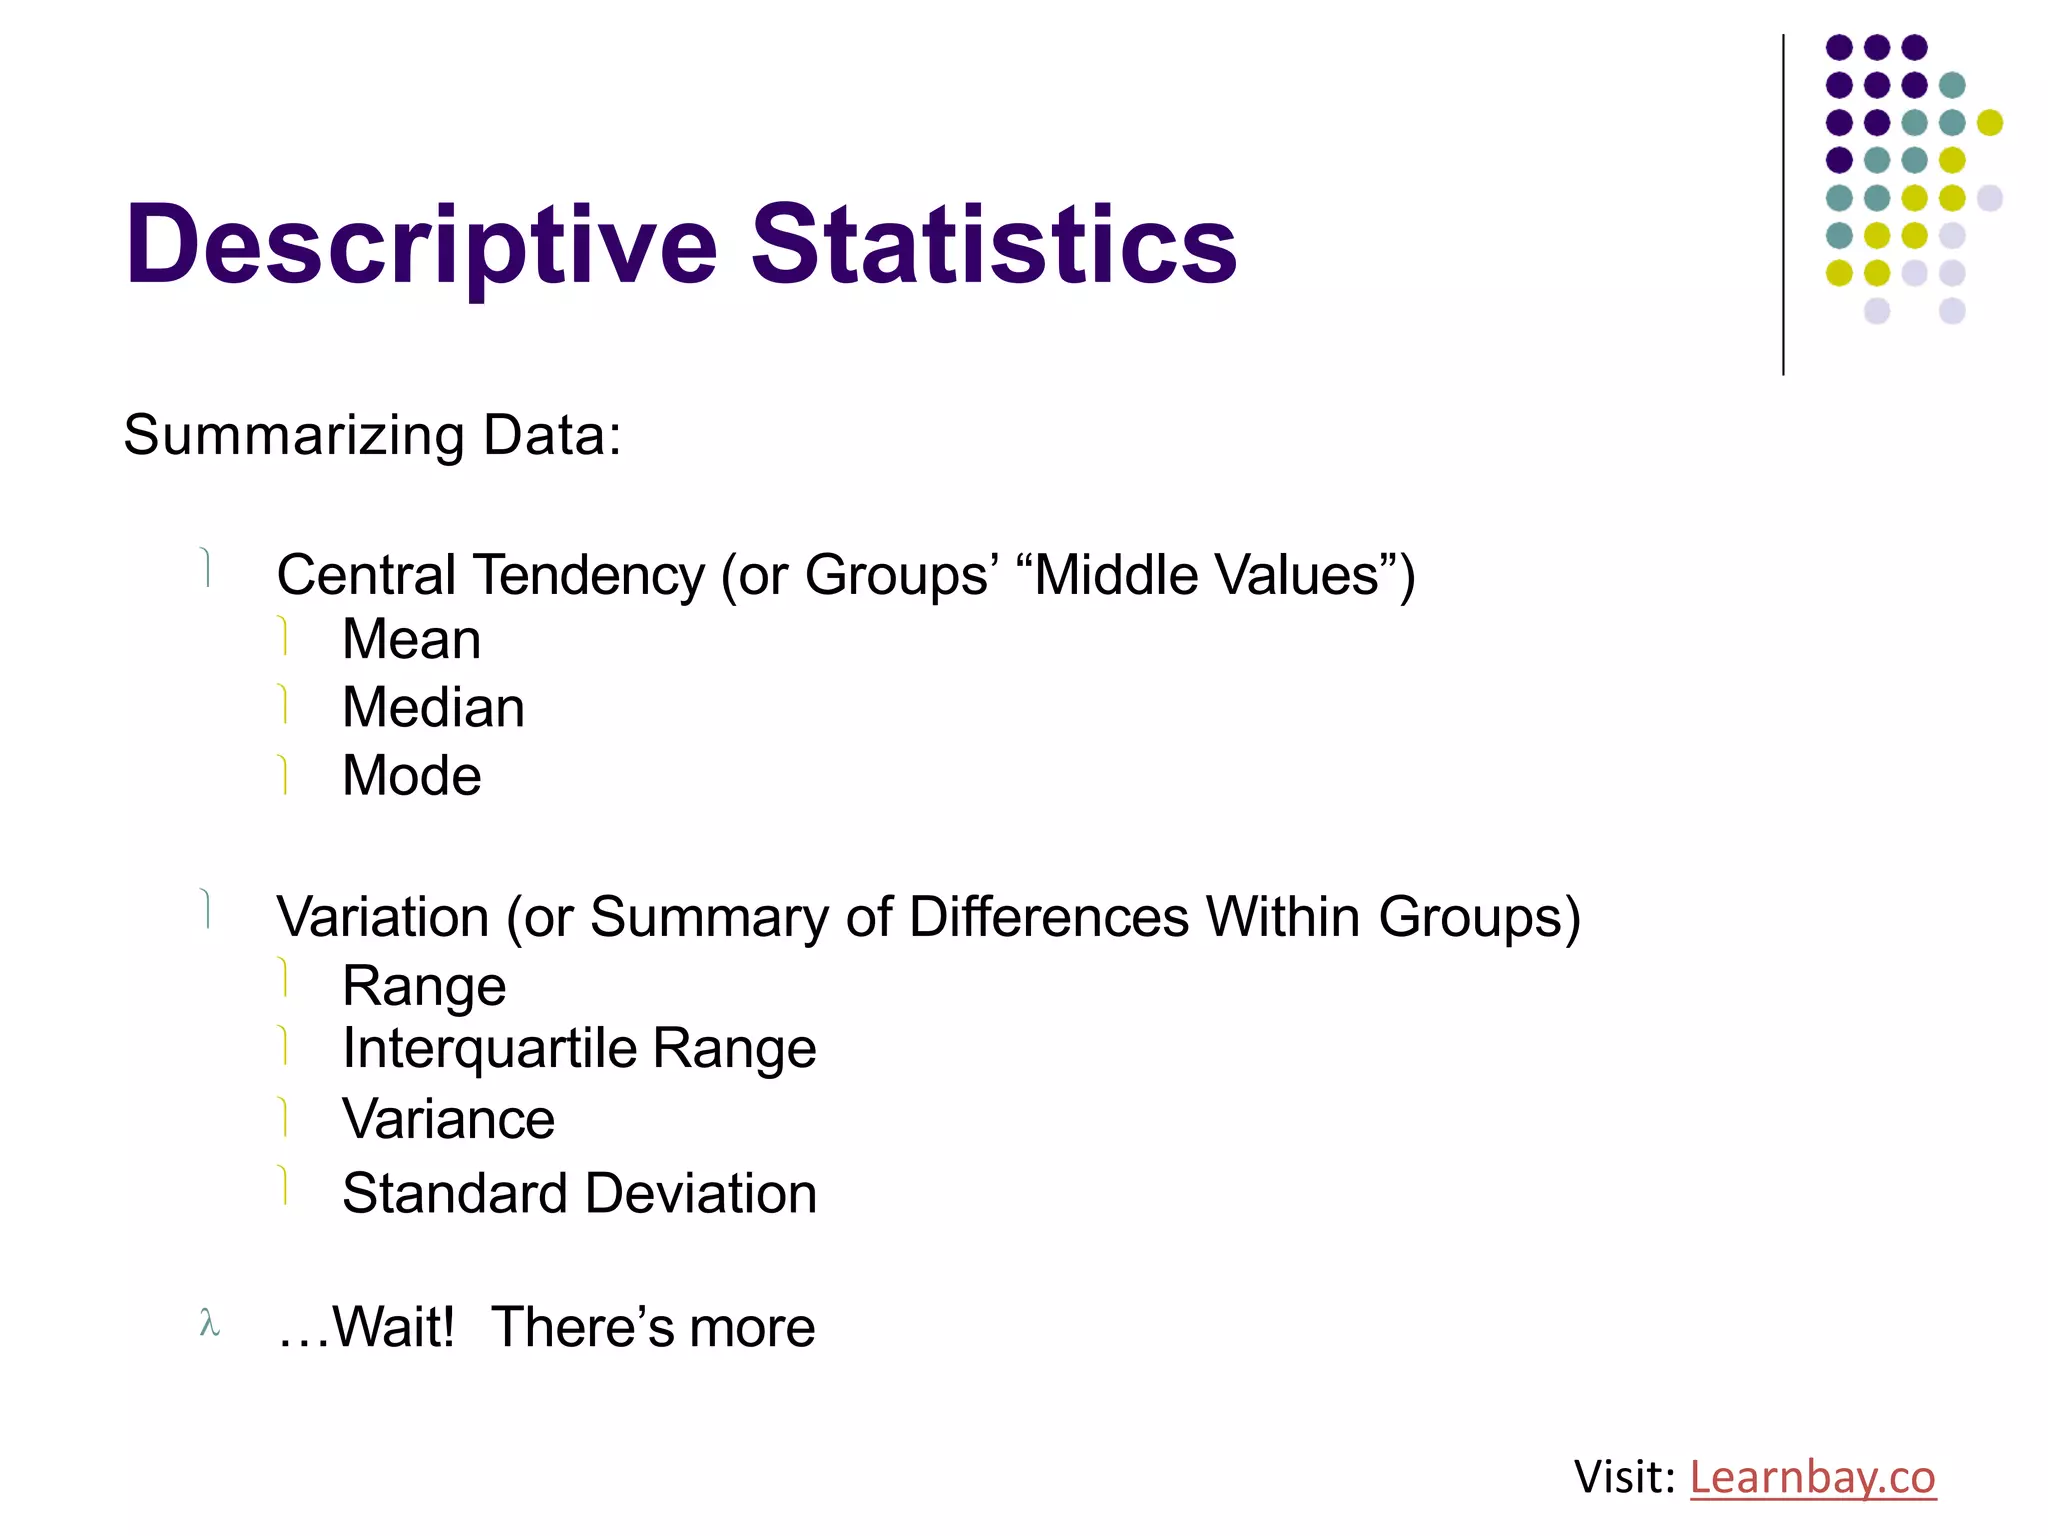


The document explains descriptive statistics, which are essential for summarizing data about populations and samples in research, particularly in sociology. It covers various measures of central tendency such as mean, median, and mode, as well as measures of variation like range, variance, and standard deviation. The text also highlights the importance of summarizing data to enhance comprehension and facilitate analysis.