Download to read offline

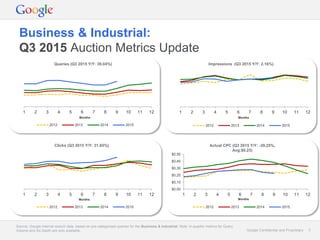
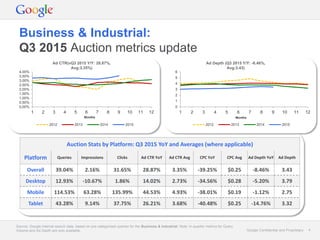
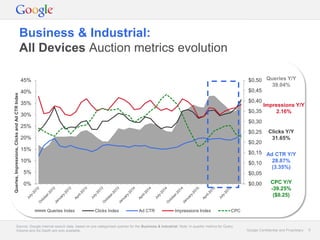
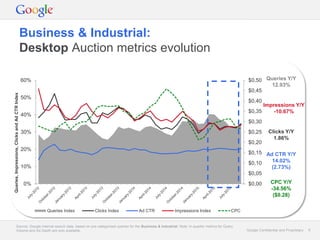
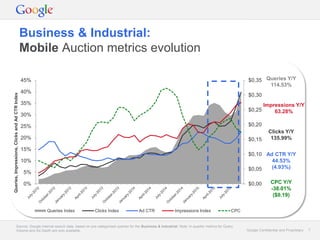
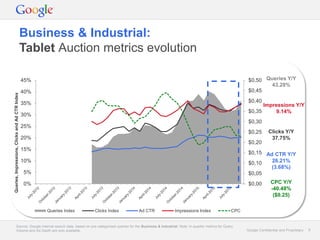
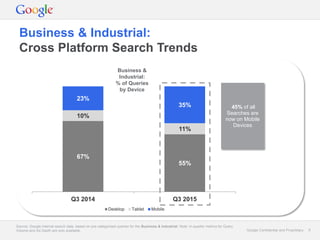

Queries in the business and industrial category grew 39% in Q3 2015 compared to the same period last year. Mobile queries increased 115% while desktop queries rose 13% and tablet searches grew 43%. Nearly 45% of all searches are now on mobile devices. Overall ad clicks increased 31.65% and average cost per click decreased 39.25% to $0.25.


