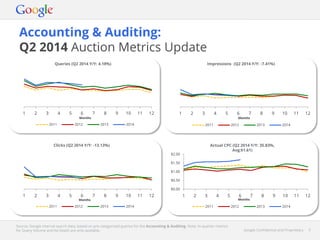
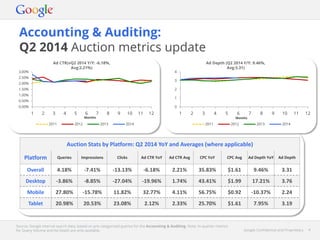
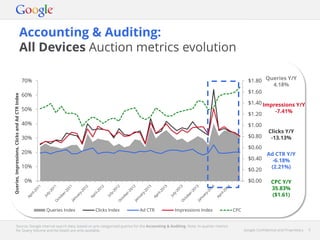
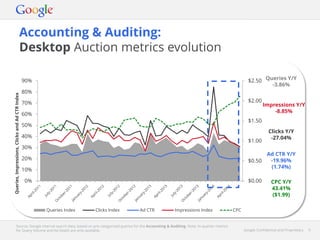
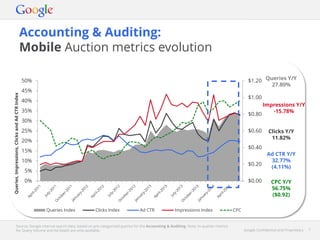
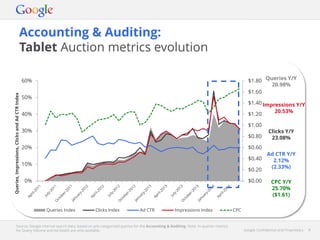
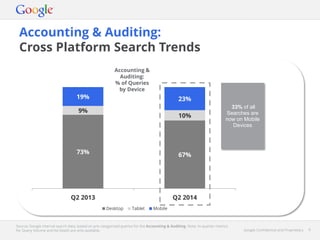
Google Confidential and Proprietary 1Google Confidential and Proprietary 1
Accounting & Auditing
United Kingdom
Quarterly Update
Last Quarter: Q2 2014
September 2014
Google Confidential and Proprietary 2Google Confidential and Proprietary 2
Desktop queries declined by -4%, while Mobile queries
grew by 28% and Tablet searches grew by 21% YoY in
the same period
Queries grew by 4% in Q2 2014 in the
Accounting & Auditing Category
Google Confidential and Proprietary 3Google Confidential and Proprietary 3
Accounting & Auditing:
Q2 2014 Auction Metrics Update
Source: Google internal search data, based on pre-categorised queries for the Accounting & Auditing. Note: In-quarter metrics
for Query Volume and Ad Depth are only available.
1 2 3 4 5 6 7 8 9 10 11 12
Months
2011 2012 2013 2014
Queries (Q2 2014 Y/Y: 4.18%)
1 2 3 4 5 6 7 8 9 10 11 12
Months
2011 2012 2013 2014
1 2 3 4 5 6 7 8 9 10 11 12
Months
2011 2012 2013 2014
$0.00
$0.50
$1.00
$1.50
$2.00
1 2 3 4 5 6 7 8 9 10 11 12
Months
2011 2012 2013 2014
Impressions (Q2 2014 Y/Y: -7.41%)
Clicks (Q2 2014 Y/Y: -13.13%) Actual CPC (Q2 2014 Y/Y: 35.83%,
Avg:$1.61)
Google Confidential and Proprietary 4Google Confidential and Proprietary 4
Accounting & Auditing:
Q2 2014 Auction metrics update
Source: Google internal search data, based on pre-categorised queries for the Accounting & Auditing. Note: In-quarter metrics
for Query Volume and Ad Depth are only available.
Auction Stats by Platform: Q2 2014 YoY and Averages (where applicable)
Platform Queries Impressions Clicks Ad CTR YoY Ad CTR Avg CPC YoY CPC Avg Ad Depth YoY Ad Depth
Overall 4.18% -7.41% -13.13% -6.18% 2.21% 35.83% $1.61 9.46% 3.31
Desktop -3.86% -8.85% -27.04% -19.96% 1.74% 43.41% $1.99 17.21% 3.76
Mobile 27.80% -15.78% 11.82% 32.77% 4.11% 56.75% $0.92 -10.37% 2.24
Tablet 20.98% 20.53% 23.08% 2.12% 2.33% 25.70% $1.61 7.95% 3.19
0.00%
0.50%
1.00%
1.50%
2.00%
2.50%
3.00%
1 2 3 4 5 6 7 8 9 10 11 12
Months
2011 2012 2013 2014
0
1
2
3
4
1 2 3 4 5 6 7 8 9 10 11 12
Months
2011 2012 2013 2014
Ad Depth (Q2 2014 Y/Y: 9.46%,
Avg:3.31)
Ad CTR(vQ2 2014 Y/Y: -6.18%,
Avg:2.21%)
Google Confidential and Proprietary 5Google Confidential and Proprietary 5
Accounting & Auditing:
All Devices Auction metrics evolution
Source: Google internal search data, based on pre-categorised queries for the Accounting & Auditing. Note: In-quarter metrics
for Query Volume and Ad Depth are only available.
$0.00
$0.20
$0.40
$0.60
$0.80
$1.00
$1.20
$1.40
$1.60
$1.80
0%
10%
20%
30%
40%
50%
60%
70%
Queries,Impressions,ClicksandAdCTRIndex
Queries Index Clicks Index Ad CTR Impressions Index CPC
Queries Y/Y
4.18%
Impressions Y/Y
-7.41%
Clicks Y/Y
-13.13%
Ad CTR Y/Y
-6.18%
(2.21%)
CPC Y/Y
35.83%
($1.61)
Google Confidential and Proprietary 6Google Confidential and Proprietary 6
Accounting & Auditing:
Desktop Auction metrics evolution
Source: Google internal search data, based on pre-categorised queries for the Accounting & Auditing. Note: In-quarter metrics
for Query Volume and Ad Depth are only available.
$0.00
$0.50
$1.00
$1.50
$2.00
$2.50
0%
10%
20%
30%
40%
50%
60%
70%
80%
90%
Queries,Impressions,ClicksandAdCTRIndex
Queries Index Clicks Index Ad CTR Impressions Index CPC
Queries Y/Y
-3.86%
Impressions Y/Y
-8.85%
Clicks Y/Y
-27.04%
Ad CTR Y/Y
-19.96%
(1.74%)
CPC Y/Y
43.41%
($1.99)
Google Confidential and Proprietary 7Google Confidential and Proprietary 7
Accounting & Auditing:
Mobile Auction metrics evolution
Source: Google internal search data, based on pre-categorised queries for the Accounting & Auditing. Note: In-quarter metrics
for Query Volume and Ad Depth are only available.
$0.00
$0.20
$0.40
$0.60
$0.80
$1.00
$1.20
0%
5%
10%
15%
20%
25%
30%
35%
40%
45%
50%
Queries,Impressions,ClicksandAdCTRIndex
Queries Index Clicks Index Ad CTR Impressions Index CPC
Queries Y/Y
27.80%
Impressions Y/Y
-15.78%
Clicks Y/Y
11.82%
Ad CTR Y/Y
32.77%
(4.11%)
CPC Y/Y
56.75%
($0.92)
Google Confidential and Proprietary 8Google Confidential and Proprietary 8
Accounting & Auditing:
Tablet Auction metrics evolution
Source: Google internal search data, based on pre-categorised queries for the Accounting & Auditing. Note: In-quarter metrics
for Query Volume and Ad Depth are only available.
$0.00
$0.20
$0.40
$0.60
$0.80
$1.00
$1.20
$1.40
$1.60
$1.80
0%
10%
20%
30%
40%
50%
60%
Queries,Impressions,ClicksandAdCTRIndex
Queries Index Clicks Index Ad CTR Impressions Index CPC
Queries Y/Y
20.98%
Impressions Y/Y
20.53%
Clicks Y/Y
23.08%
Ad CTR Y/Y
2.12%
(2.33%)
CPC Y/Y
25.70%
($1.61)
Google Confidential and Proprietary 9Google Confidential and Proprietary 9
73% 67%
9%
10%
19% 23%
Q2 2013 Q2 2014
Desktop Tablet Mobile
Accounting & Auditing:
Cross Platform Search Trends
Source: Google internal search data, based on pre-categorised queries for the Accounting & Auditing. Note: In-quarter metrics
for Query Volume and Ad Depth are only available.
33% of all
Searches are
now on Mobile
Devices
Accounting &
Auditing:
% of Queries
by Device
Google Confidential and Proprietary 10Google Confidential and Proprietary 10
Thank You!
Google Confidential and Proprietary 11Google Confidential and Proprietary 11
Definitions
• Devices:
– Overall: Devices across Google Search(Desktop, Mobile, Tablet)
– Mobile = Overall – (Computers + Tablet)
– Tablet = Overall – (Mobile + Computers)
– Mobile is Mobile High End devices with a full browser
– Tablet is Tablet devices with a full browser
• Metrics
– Queries: Searches by users on Google Search
– Impressions: AdWords ads shown against search queries on Google Search
– Clicks: Clicks on AdWords ads
– CPC: Cost per Click (Cost ÷ Clicks)
– Ad CTR: Click-through Rate (Clicks ÷ Impressions)

Accounting+&+Auditing

  • 1.
    Google Confidential andProprietary 1Google Confidential and Proprietary 1 Accounting & Auditing United Kingdom Quarterly Update Last Quarter: Q2 2014 September 2014
  • 2.
    Google Confidential andProprietary 2Google Confidential and Proprietary 2 Desktop queries declined by -4%, while Mobile queries grew by 28% and Tablet searches grew by 21% YoY in the same period Queries grew by 4% in Q2 2014 in the Accounting & Auditing Category
  • 3.
    Google Confidential andProprietary 3Google Confidential and Proprietary 3 Accounting & Auditing: Q2 2014 Auction Metrics Update Source: Google internal search data, based on pre-categorised queries for the Accounting & Auditing. Note: In-quarter metrics for Query Volume and Ad Depth are only available. 1 2 3 4 5 6 7 8 9 10 11 12 Months 2011 2012 2013 2014 Queries (Q2 2014 Y/Y: 4.18%) 1 2 3 4 5 6 7 8 9 10 11 12 Months 2011 2012 2013 2014 1 2 3 4 5 6 7 8 9 10 11 12 Months 2011 2012 2013 2014 $0.00 $0.50 $1.00 $1.50 $2.00 1 2 3 4 5 6 7 8 9 10 11 12 Months 2011 2012 2013 2014 Impressions (Q2 2014 Y/Y: -7.41%) Clicks (Q2 2014 Y/Y: -13.13%) Actual CPC (Q2 2014 Y/Y: 35.83%, Avg:$1.61)
  • 4.
    Google Confidential andProprietary 4Google Confidential and Proprietary 4 Accounting & Auditing: Q2 2014 Auction metrics update Source: Google internal search data, based on pre-categorised queries for the Accounting & Auditing. Note: In-quarter metrics for Query Volume and Ad Depth are only available. Auction Stats by Platform: Q2 2014 YoY and Averages (where applicable) Platform Queries Impressions Clicks Ad CTR YoY Ad CTR Avg CPC YoY CPC Avg Ad Depth YoY Ad Depth Overall 4.18% -7.41% -13.13% -6.18% 2.21% 35.83% $1.61 9.46% 3.31 Desktop -3.86% -8.85% -27.04% -19.96% 1.74% 43.41% $1.99 17.21% 3.76 Mobile 27.80% -15.78% 11.82% 32.77% 4.11% 56.75% $0.92 -10.37% 2.24 Tablet 20.98% 20.53% 23.08% 2.12% 2.33% 25.70% $1.61 7.95% 3.19 0.00% 0.50% 1.00% 1.50% 2.00% 2.50% 3.00% 1 2 3 4 5 6 7 8 9 10 11 12 Months 2011 2012 2013 2014 0 1 2 3 4 1 2 3 4 5 6 7 8 9 10 11 12 Months 2011 2012 2013 2014 Ad Depth (Q2 2014 Y/Y: 9.46%, Avg:3.31) Ad CTR(vQ2 2014 Y/Y: -6.18%, Avg:2.21%)
  • 5.
    Google Confidential andProprietary 5Google Confidential and Proprietary 5 Accounting & Auditing: All Devices Auction metrics evolution Source: Google internal search data, based on pre-categorised queries for the Accounting & Auditing. Note: In-quarter metrics for Query Volume and Ad Depth are only available. $0.00 $0.20 $0.40 $0.60 $0.80 $1.00 $1.20 $1.40 $1.60 $1.80 0% 10% 20% 30% 40% 50% 60% 70% Queries,Impressions,ClicksandAdCTRIndex Queries Index Clicks Index Ad CTR Impressions Index CPC Queries Y/Y 4.18% Impressions Y/Y -7.41% Clicks Y/Y -13.13% Ad CTR Y/Y -6.18% (2.21%) CPC Y/Y 35.83% ($1.61)
  • 6.
    Google Confidential andProprietary 6Google Confidential and Proprietary 6 Accounting & Auditing: Desktop Auction metrics evolution Source: Google internal search data, based on pre-categorised queries for the Accounting & Auditing. Note: In-quarter metrics for Query Volume and Ad Depth are only available. $0.00 $0.50 $1.00 $1.50 $2.00 $2.50 0% 10% 20% 30% 40% 50% 60% 70% 80% 90% Queries,Impressions,ClicksandAdCTRIndex Queries Index Clicks Index Ad CTR Impressions Index CPC Queries Y/Y -3.86% Impressions Y/Y -8.85% Clicks Y/Y -27.04% Ad CTR Y/Y -19.96% (1.74%) CPC Y/Y 43.41% ($1.99)
  • 7.
    Google Confidential andProprietary 7Google Confidential and Proprietary 7 Accounting & Auditing: Mobile Auction metrics evolution Source: Google internal search data, based on pre-categorised queries for the Accounting & Auditing. Note: In-quarter metrics for Query Volume and Ad Depth are only available. $0.00 $0.20 $0.40 $0.60 $0.80 $1.00 $1.20 0% 5% 10% 15% 20% 25% 30% 35% 40% 45% 50% Queries,Impressions,ClicksandAdCTRIndex Queries Index Clicks Index Ad CTR Impressions Index CPC Queries Y/Y 27.80% Impressions Y/Y -15.78% Clicks Y/Y 11.82% Ad CTR Y/Y 32.77% (4.11%) CPC Y/Y 56.75% ($0.92)
  • 8.
    Google Confidential andProprietary 8Google Confidential and Proprietary 8 Accounting & Auditing: Tablet Auction metrics evolution Source: Google internal search data, based on pre-categorised queries for the Accounting & Auditing. Note: In-quarter metrics for Query Volume and Ad Depth are only available. $0.00 $0.20 $0.40 $0.60 $0.80 $1.00 $1.20 $1.40 $1.60 $1.80 0% 10% 20% 30% 40% 50% 60% Queries,Impressions,ClicksandAdCTRIndex Queries Index Clicks Index Ad CTR Impressions Index CPC Queries Y/Y 20.98% Impressions Y/Y 20.53% Clicks Y/Y 23.08% Ad CTR Y/Y 2.12% (2.33%) CPC Y/Y 25.70% ($1.61)
  • 9.
    Google Confidential andProprietary 9Google Confidential and Proprietary 9 73% 67% 9% 10% 19% 23% Q2 2013 Q2 2014 Desktop Tablet Mobile Accounting & Auditing: Cross Platform Search Trends Source: Google internal search data, based on pre-categorised queries for the Accounting & Auditing. Note: In-quarter metrics for Query Volume and Ad Depth are only available. 33% of all Searches are now on Mobile Devices Accounting & Auditing: % of Queries by Device
  • 10.
    Google Confidential andProprietary 10Google Confidential and Proprietary 10 Thank You!
  • 11.
    Google Confidential andProprietary 11Google Confidential and Proprietary 11 Definitions • Devices: – Overall: Devices across Google Search(Desktop, Mobile, Tablet) – Mobile = Overall – (Computers + Tablet) – Tablet = Overall – (Mobile + Computers) – Mobile is Mobile High End devices with a full browser – Tablet is Tablet devices with a full browser • Metrics – Queries: Searches by users on Google Search – Impressions: AdWords ads shown against search queries on Google Search – Clicks: Clicks on AdWords ads – CPC: Cost per Click (Cost ÷ Clicks) – Ad CTR: Click-through Rate (Clicks ÷ Impressions)