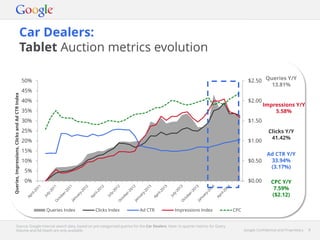
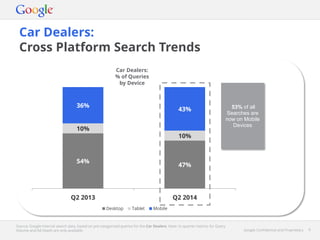
Queries for car dealers grew 14% year-over-year in Q2 2014. Mobile searches increased 37% while desktop searches declined 1%. The number of impressions fell 6% but clicks and average cost-per-click rose 19% and 17% respectively. 53% of searches now occur on mobile devices compared to 47% on desktop and 10% on tablets.
1. Google Confidential and Proprietary 1Google Confidential and Proprietary 1
Car Dealers
United States
Quarterly Update
Last Quarter: Q2 2014
September 2014
2. Google Confidential and Proprietary 2Google Confidential and Proprietary 2
Desktop queries declined by -1%, while Mobile queries
grew by 37% and Tablet searches grew by 14% YoY in
the same period
Queries grew by 14% in Q2 2014 in the
Car Dealers Category
3. Google Confidential and Proprietary 3Google Confidential and Proprietary 3
Car Dealers:
Q2 2014 Auction Metrics Update
Source: Google internal search data, based on pre-categorised queries for the Car Dealers. Note: In-quarter metrics for Query
Volume and Ad Depth are only available.
1 2 3 4 5 6 7 8 9 10 11 12
Months
2011 2012 2013 2014
Queries (Q2 2014 Y/Y: 14.00%)
1 2 3 4 5 6 7 8 9 10 11 12
Months
2011 2012 2013 2014
1 2 3 4 5 6 7 8 9 10 11 12
Months
2011 2012 2013 2014
$0.00
$0.50
$1.00
$1.50
$2.00
$2.50
1 2 3 4 5 6 7 8 9 10 11 12
Months
2011 2012 2013 2014
Impressions (Q2 2014 Y/Y: -6.23%)
Clicks (Q2 2014 Y/Y: 19.13%) Actual CPC (Q2 2014 Y/Y: 17.02%,
Avg:$2.16)
4. Google Confidential and Proprietary 4Google Confidential and Proprietary 4
Car Dealers:
Q2 2014 Auction metrics update
Source: Google internal search data, based on pre-categorised queries for the Car Dealers. Note: In-quarter metrics for Query
Volume and Ad Depth are only available.
Auction Stats by Platform: Q2 2014 YoY and Averages (where applicable)
Platform Queries Impressions Clicks Ad CTR YoY Ad CTR Avg CPC YoY CPC Avg Ad Depth YoY Ad Depth
Overall 14.00% -6.23% 19.13% 27.04% 2.93% 17.02% $2.16 -7.76% 4.86
Desktop -1.00% -12.46% 1.19% 15.59% 2.63% 15.90% $2.27 -3.07% 6.14
Mobile 36.87% 4.41% 53.49% 47.02% 3.47% 32.12% $2.01 -9.04% 3.26
Tablet 13.81% 5.58% 41.42% 33.94% 3.17% 7.59% $2.12 -7.09% 5.32
0.00%
1.00%
2.00%
3.00%
4.00%
1 2 3 4 5 6 7 8 9 10 11 12
Months
2011 2012 2013 2014
4
5
5
6
6
1 2 3 4 5 6 7 8 9 10 11 12
Months
2011 2012 2013 2014
Ad Depth (Q2 2014 Y/Y: -7.76%,
Avg:4.86)
Ad CTR(vQ2 2014 Y/Y: 27.04%,
Avg:2.93%)
5. Google Confidential and Proprietary 5Google Confidential and Proprietary 5
Car Dealers:
All Devices Auction metrics evolution
Source: Google internal search data, based on pre-categorised queries for the Car Dealers. Note: In-quarter metrics for Query
Volume and Ad Depth are only available.
$0.00
$0.50
$1.00
$1.50
$2.00
$2.50
0%
5%
10%
15%
20%
25%
30%
35%
40%
45%
Queries,Impressions,ClicksandAdCTRIndex
Queries Index Clicks Index Ad CTR Impressions Index CPC
Queries Y/Y
14.00%
Impressions Y/Y
-6.23%
Clicks Y/Y
19.13%
Ad CTR Y/Y
27.04%
(2.93%)
CPC Y/Y
17.02%
($2.16)
6. Google Confidential and Proprietary 6Google Confidential and Proprietary 6
Car Dealers:
Desktop Auction metrics evolution
Source: Google internal search data, based on pre-categorised queries for the Car Dealers. Note: In-quarter metrics for Query
Volume and Ad Depth are only available.
$0.00
$0.50
$1.00
$1.50
$2.00
$2.50
0%
5%
10%
15%
20%
25%
30%
35%
40%
45%
50%
Queries,Impressions,ClicksandAdCTRIndex
Queries Index Clicks Index Ad CTR Impressions Index CPC
Queries Y/Y
-1.00%
Impressions Y/Y
-12.46%
Clicks Y/Y
1.19%
Ad CTR Y/Y
15.59%
(2.63%)
CPC Y/Y
15.90%
($2.27)
7. Google Confidential and Proprietary 7Google Confidential and Proprietary 7
Car Dealers:
Mobile Auction metrics evolution
Source: Google internal search data, based on pre-categorised queries for the Car Dealers. Note: In-quarter metrics for Query
Volume and Ad Depth are only available.
$0.00
$0.50
$1.00
$1.50
$2.00
$2.50
0%
5%
10%
15%
20%
25%
30%
35%
40%
45%
Queries,Impressions,ClicksandAdCTRIndex
Queries Index Clicks Index Ad CTR Impressions Index CPC
Queries Y/Y
36.87%
Impressions Y/Y
4.41%
Clicks Y/Y
53.49%
Ad CTR Y/Y
47.02%
(3.47%)
CPC Y/Y
32.12%
($2.01)
8. Google Confidential and Proprietary 8Google Confidential and Proprietary 8
Car Dealers:
Tablet Auction metrics evolution
Source: Google internal search data, based on pre-categorised queries for the Car Dealers. Note: In-quarter metrics for Query
Volume and Ad Depth are only available.
$0.00
$0.50
$1.00
$1.50
$2.00
$2.50
0%
5%
10%
15%
20%
25%
30%
35%
40%
45%
50%
Queries,Impressions,ClicksandAdCTRIndex
Queries Index Clicks Index Ad CTR Impressions Index CPC
Queries Y/Y
13.81%
Impressions Y/Y
5.58%
Clicks Y/Y
41.42%
Ad CTR Y/Y
33.94%
(3.17%)
CPC Y/Y
7.59%
($2.12)
9. Google Confidential and Proprietary 9Google Confidential and Proprietary 9
54%
47%
10%
10%
36%
43%
Q2 2013 Q2 2014
Desktop Tablet Mobile
Car Dealers:
Cross Platform Search Trends
Source: Google internal search data, based on pre-categorised queries for the Car Dealers. Note: In-quarter metrics for Query
Volume and Ad Depth are only available.
53% of all
Searches are
now on Mobile
Devices
Car Dealers:
% of Queries
by Device
11. Google Confidential and Proprietary 11Google Confidential and Proprietary 11
Definitions
• Devices:
– Overall: Devices across Google Search(Desktop, Mobile, Tablet)
– Mobile = Overall – (Computers + Tablet)
– Tablet = Overall – (Mobile + Computers)
– Mobile is Mobile High End devices with a full browser
– Tablet is Tablet devices with a full browser
• Metrics
– Queries: Searches by users on Google Search
– Impressions: AdWords ads shown against search queries on Google Search
– Clicks: Clicks on AdWords ads
– CPC: Cost per Click (Cost ÷ Clicks)
– Ad CTR: Click-through Rate (Clicks ÷ Impressions)