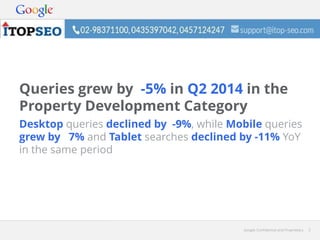
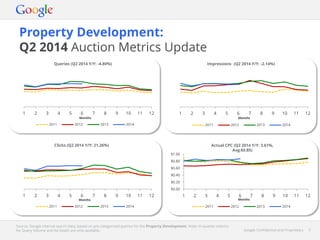
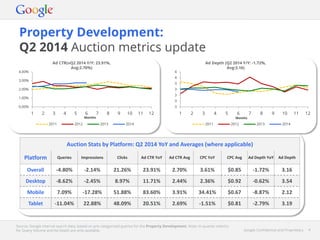
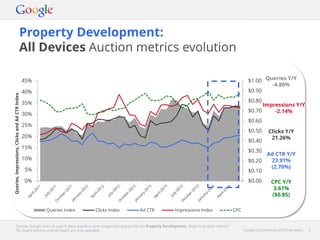
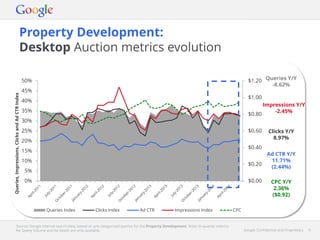
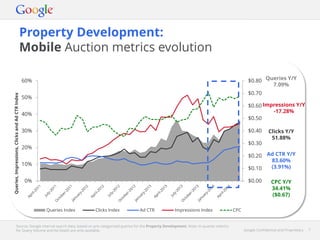
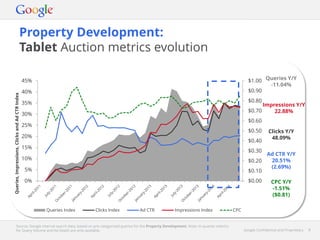
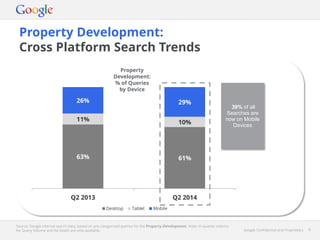
Google Confidential and Proprietary 1Google Confidential and Proprietary 1
Property Development
United States
Quarterly Update
Last Quarter: Q2 2014
September 2014
Google Confidential and Proprietary 2Google Confidential and Proprietary 2
Desktop queries declined by -9%, while Mobile queries
grew by 7% and Tablet searches declined by -11% YoY
in the same period
Queries grew by -5% in Q2 2014 in the
Property Development Category
Google Confidential and Proprietary 3Google Confidential and Proprietary 3
Property Development:
Q2 2014 Auction Metrics Update
Source: Google internal search data, based on pre-categorised queries for the Property Development. Note: In-quarter metrics
for Query Volume and Ad Depth are only available.
1 2 3 4 5 6 7 8 9 10 11 12
Months
2011 2012 2013 2014
Queries (Q2 2014 Y/Y: -4.80%)
1 2 3 4 5 6 7 8 9 10 11 12
Months
2011 2012 2013 2014
1 2 3 4 5 6 7 8 9 10 11 12
Months
2011 2012 2013 2014
$0.00
$0.20
$0.40
$0.60
$0.80
$1.00
1 2 3 4 5 6 7 8 9 10 11 12
Months
2011 2012 2013 2014
Impressions (Q2 2014 Y/Y: -2.14%)
Clicks (Q2 2014 Y/Y: 21.26%) Actual CPC (Q2 2014 Y/Y: 3.61%,
Avg:$0.85)
Google Confidential and Proprietary 4Google Confidential and Proprietary 4
Property Development:
Q2 2014 Auction metrics update
Source: Google internal search data, based on pre-categorised queries for the Property Development. Note: In-quarter metrics
for Query Volume and Ad Depth are only available.
Auction Stats by Platform: Q2 2014 YoY and Averages (where applicable)
Platform Queries Impressions Clicks Ad CTR YoY Ad CTR Avg CPC YoY CPC Avg Ad Depth YoY Ad Depth
Overall -4.80% -2.14% 21.26% 23.91% 2.70% 3.61% $0.85 -1.72% 3.16
Desktop -8.62% -2.45% 8.97% 11.71% 2.44% 2.36% $0.92 -0.62% 3.54
Mobile 7.09% -17.28% 51.88% 83.60% 3.91% 34.41% $0.67 -8.87% 2.12
Tablet -11.04% 22.88% 48.09% 20.51% 2.69% -1.51% $0.81 -2.79% 3.19
0.00%
1.00%
2.00%
3.00%
4.00%
1 2 3 4 5 6 7 8 9 10 11 12
Months
2011 2012 2013 2014
3
3
3
3
3
4
4
1 2 3 4 5 6 7 8 9 10 11 12
Months
2011 2012 2013 2014
Ad Depth (Q2 2014 Y/Y: -1.72%,
Avg:3.16)
Ad CTR(vQ2 2014 Y/Y: 23.91%,
Avg:2.70%)
Google Confidential and Proprietary 5Google Confidential and Proprietary 5
Property Development:
All Devices Auction metrics evolution
Source: Google internal search data, based on pre-categorised queries for the Property Development. Note: In-quarter metrics
for Query Volume and Ad Depth are only available.
$0.00
$0.10
$0.20
$0.30
$0.40
$0.50
$0.60
$0.70
$0.80
$0.90
$1.00
0%
5%
10%
15%
20%
25%
30%
35%
40%
45%
Queries,Impressions,ClicksandAdCTRIndex
Queries Index Clicks Index Ad CTR Impressions Index CPC
Queries Y/Y
-4.80%
Impressions Y/Y
-2.14%
Clicks Y/Y
21.26%
Ad CTR Y/Y
23.91%
(2.70%)
CPC Y/Y
3.61%
($0.85)
Google Confidential and Proprietary 6Google Confidential and Proprietary 6
Property Development:
Desktop Auction metrics evolution
Source: Google internal search data, based on pre-categorised queries for the Property Development. Note: In-quarter metrics
for Query Volume and Ad Depth are only available.
$0.00
$0.20
$0.40
$0.60
$0.80
$1.00
$1.20
0%
5%
10%
15%
20%
25%
30%
35%
40%
45%
50%
Queries,Impressions,ClicksandAdCTRIndex
Queries Index Clicks Index Ad CTR Impressions Index CPC
Queries Y/Y
-8.62%
Impressions Y/Y
-2.45%
Clicks Y/Y
8.97%
Ad CTR Y/Y
11.71%
(2.44%)
CPC Y/Y
2.36%
($0.92)
Google Confidential and Proprietary 7Google Confidential and Proprietary 7
Property Development:
Mobile Auction metrics evolution
Source: Google internal search data, based on pre-categorised queries for the Property Development. Note: In-quarter metrics
for Query Volume and Ad Depth are only available.
$0.00
$0.10
$0.20
$0.30
$0.40
$0.50
$0.60
$0.70
$0.80
0%
10%
20%
30%
40%
50%
60%
Queries,Impressions,ClicksandAdCTRIndex
Queries Index Clicks Index Ad CTR Impressions Index CPC
Queries Y/Y
7.09%
Impressions Y/Y
-17.28%
Clicks Y/Y
51.88%
Ad CTR Y/Y
83.60%
(3.91%)
CPC Y/Y
34.41%
($0.67)
Google Confidential and Proprietary 8Google Confidential and Proprietary 8
Property Development:
Tablet Auction metrics evolution
Source: Google internal search data, based on pre-categorised queries for the Property Development. Note: In-quarter metrics
for Query Volume and Ad Depth are only available.
$0.00
$0.10
$0.20
$0.30
$0.40
$0.50
$0.60
$0.70
$0.80
$0.90
$1.00
0%
5%
10%
15%
20%
25%
30%
35%
40%
45%
Queries,Impressions,ClicksandAdCTRIndex
Queries Index Clicks Index Ad CTR Impressions Index CPC
Queries Y/Y
-11.04%
Impressions Y/Y
22.88%
Clicks Y/Y
48.09%
Ad CTR Y/Y
20.51%
(2.69%)
CPC Y/Y
-1.51%
($0.81)
Google Confidential and Proprietary 9Google Confidential and Proprietary 9
63% 61%
11% 10%
26% 29%
Q2 2013 Q2 2014
Desktop Tablet Mobile
Property Development:
Cross Platform Search Trends
Source: Google internal search data, based on pre-categorised queries for the Property Development. Note: In-quarter metrics
for Query Volume and Ad Depth are only available.
39% of all
Searches are
now on Mobile
Devices
Property
Development:
% of Queries
by Device
Google Confidential and Proprietary 10Google Confidential and Proprietary 10
Thank You!
Google Confidential and Proprietary 11Google Confidential and Proprietary 11
Definitions
• Devices:
– Overall: Devices across Google Search(Desktop, Mobile, Tablet)
– Mobile = Overall – (Computers + Tablet)
– Tablet = Overall – (Mobile + Computers)
– Mobile is Mobile High End devices with a full browser
– Tablet is Tablet devices with a full browser
• Metrics
– Queries: Searches by users on Google Search
– Impressions: AdWords ads shown against search queries on Google Search
– Clicks: Clicks on AdWords ads
– CPC: Cost per Click (Cost ÷ Clicks)
– Ad CTR: Click-through Rate (Clicks ÷ Impressions)

Property+Development

  • 1.
    Google Confidential andProprietary 1Google Confidential and Proprietary 1 Property Development United States Quarterly Update Last Quarter: Q2 2014 September 2014
  • 2.
    Google Confidential andProprietary 2Google Confidential and Proprietary 2 Desktop queries declined by -9%, while Mobile queries grew by 7% and Tablet searches declined by -11% YoY in the same period Queries grew by -5% in Q2 2014 in the Property Development Category
  • 3.
    Google Confidential andProprietary 3Google Confidential and Proprietary 3 Property Development: Q2 2014 Auction Metrics Update Source: Google internal search data, based on pre-categorised queries for the Property Development. Note: In-quarter metrics for Query Volume and Ad Depth are only available. 1 2 3 4 5 6 7 8 9 10 11 12 Months 2011 2012 2013 2014 Queries (Q2 2014 Y/Y: -4.80%) 1 2 3 4 5 6 7 8 9 10 11 12 Months 2011 2012 2013 2014 1 2 3 4 5 6 7 8 9 10 11 12 Months 2011 2012 2013 2014 $0.00 $0.20 $0.40 $0.60 $0.80 $1.00 1 2 3 4 5 6 7 8 9 10 11 12 Months 2011 2012 2013 2014 Impressions (Q2 2014 Y/Y: -2.14%) Clicks (Q2 2014 Y/Y: 21.26%) Actual CPC (Q2 2014 Y/Y: 3.61%, Avg:$0.85)
  • 4.
    Google Confidential andProprietary 4Google Confidential and Proprietary 4 Property Development: Q2 2014 Auction metrics update Source: Google internal search data, based on pre-categorised queries for the Property Development. Note: In-quarter metrics for Query Volume and Ad Depth are only available. Auction Stats by Platform: Q2 2014 YoY and Averages (where applicable) Platform Queries Impressions Clicks Ad CTR YoY Ad CTR Avg CPC YoY CPC Avg Ad Depth YoY Ad Depth Overall -4.80% -2.14% 21.26% 23.91% 2.70% 3.61% $0.85 -1.72% 3.16 Desktop -8.62% -2.45% 8.97% 11.71% 2.44% 2.36% $0.92 -0.62% 3.54 Mobile 7.09% -17.28% 51.88% 83.60% 3.91% 34.41% $0.67 -8.87% 2.12 Tablet -11.04% 22.88% 48.09% 20.51% 2.69% -1.51% $0.81 -2.79% 3.19 0.00% 1.00% 2.00% 3.00% 4.00% 1 2 3 4 5 6 7 8 9 10 11 12 Months 2011 2012 2013 2014 3 3 3 3 3 4 4 1 2 3 4 5 6 7 8 9 10 11 12 Months 2011 2012 2013 2014 Ad Depth (Q2 2014 Y/Y: -1.72%, Avg:3.16) Ad CTR(vQ2 2014 Y/Y: 23.91%, Avg:2.70%)
  • 5.
    Google Confidential andProprietary 5Google Confidential and Proprietary 5 Property Development: All Devices Auction metrics evolution Source: Google internal search data, based on pre-categorised queries for the Property Development. Note: In-quarter metrics for Query Volume and Ad Depth are only available. $0.00 $0.10 $0.20 $0.30 $0.40 $0.50 $0.60 $0.70 $0.80 $0.90 $1.00 0% 5% 10% 15% 20% 25% 30% 35% 40% 45% Queries,Impressions,ClicksandAdCTRIndex Queries Index Clicks Index Ad CTR Impressions Index CPC Queries Y/Y -4.80% Impressions Y/Y -2.14% Clicks Y/Y 21.26% Ad CTR Y/Y 23.91% (2.70%) CPC Y/Y 3.61% ($0.85)
  • 6.
    Google Confidential andProprietary 6Google Confidential and Proprietary 6 Property Development: Desktop Auction metrics evolution Source: Google internal search data, based on pre-categorised queries for the Property Development. Note: In-quarter metrics for Query Volume and Ad Depth are only available. $0.00 $0.20 $0.40 $0.60 $0.80 $1.00 $1.20 0% 5% 10% 15% 20% 25% 30% 35% 40% 45% 50% Queries,Impressions,ClicksandAdCTRIndex Queries Index Clicks Index Ad CTR Impressions Index CPC Queries Y/Y -8.62% Impressions Y/Y -2.45% Clicks Y/Y 8.97% Ad CTR Y/Y 11.71% (2.44%) CPC Y/Y 2.36% ($0.92)
  • 7.
    Google Confidential andProprietary 7Google Confidential and Proprietary 7 Property Development: Mobile Auction metrics evolution Source: Google internal search data, based on pre-categorised queries for the Property Development. Note: In-quarter metrics for Query Volume and Ad Depth are only available. $0.00 $0.10 $0.20 $0.30 $0.40 $0.50 $0.60 $0.70 $0.80 0% 10% 20% 30% 40% 50% 60% Queries,Impressions,ClicksandAdCTRIndex Queries Index Clicks Index Ad CTR Impressions Index CPC Queries Y/Y 7.09% Impressions Y/Y -17.28% Clicks Y/Y 51.88% Ad CTR Y/Y 83.60% (3.91%) CPC Y/Y 34.41% ($0.67)
  • 8.
    Google Confidential andProprietary 8Google Confidential and Proprietary 8 Property Development: Tablet Auction metrics evolution Source: Google internal search data, based on pre-categorised queries for the Property Development. Note: In-quarter metrics for Query Volume and Ad Depth are only available. $0.00 $0.10 $0.20 $0.30 $0.40 $0.50 $0.60 $0.70 $0.80 $0.90 $1.00 0% 5% 10% 15% 20% 25% 30% 35% 40% 45% Queries,Impressions,ClicksandAdCTRIndex Queries Index Clicks Index Ad CTR Impressions Index CPC Queries Y/Y -11.04% Impressions Y/Y 22.88% Clicks Y/Y 48.09% Ad CTR Y/Y 20.51% (2.69%) CPC Y/Y -1.51% ($0.81)
  • 9.
    Google Confidential andProprietary 9Google Confidential and Proprietary 9 63% 61% 11% 10% 26% 29% Q2 2013 Q2 2014 Desktop Tablet Mobile Property Development: Cross Platform Search Trends Source: Google internal search data, based on pre-categorised queries for the Property Development. Note: In-quarter metrics for Query Volume and Ad Depth are only available. 39% of all Searches are now on Mobile Devices Property Development: % of Queries by Device
  • 10.
    Google Confidential andProprietary 10Google Confidential and Proprietary 10 Thank You!
  • 11.
    Google Confidential andProprietary 11Google Confidential and Proprietary 11 Definitions • Devices: – Overall: Devices across Google Search(Desktop, Mobile, Tablet) – Mobile = Overall – (Computers + Tablet) – Tablet = Overall – (Mobile + Computers) – Mobile is Mobile High End devices with a full browser – Tablet is Tablet devices with a full browser • Metrics – Queries: Searches by users on Google Search – Impressions: AdWords ads shown against search queries on Google Search – Clicks: Clicks on AdWords ads – CPC: Cost per Click (Cost ÷ Clicks) – Ad CTR: Click-through Rate (Clicks ÷ Impressions)