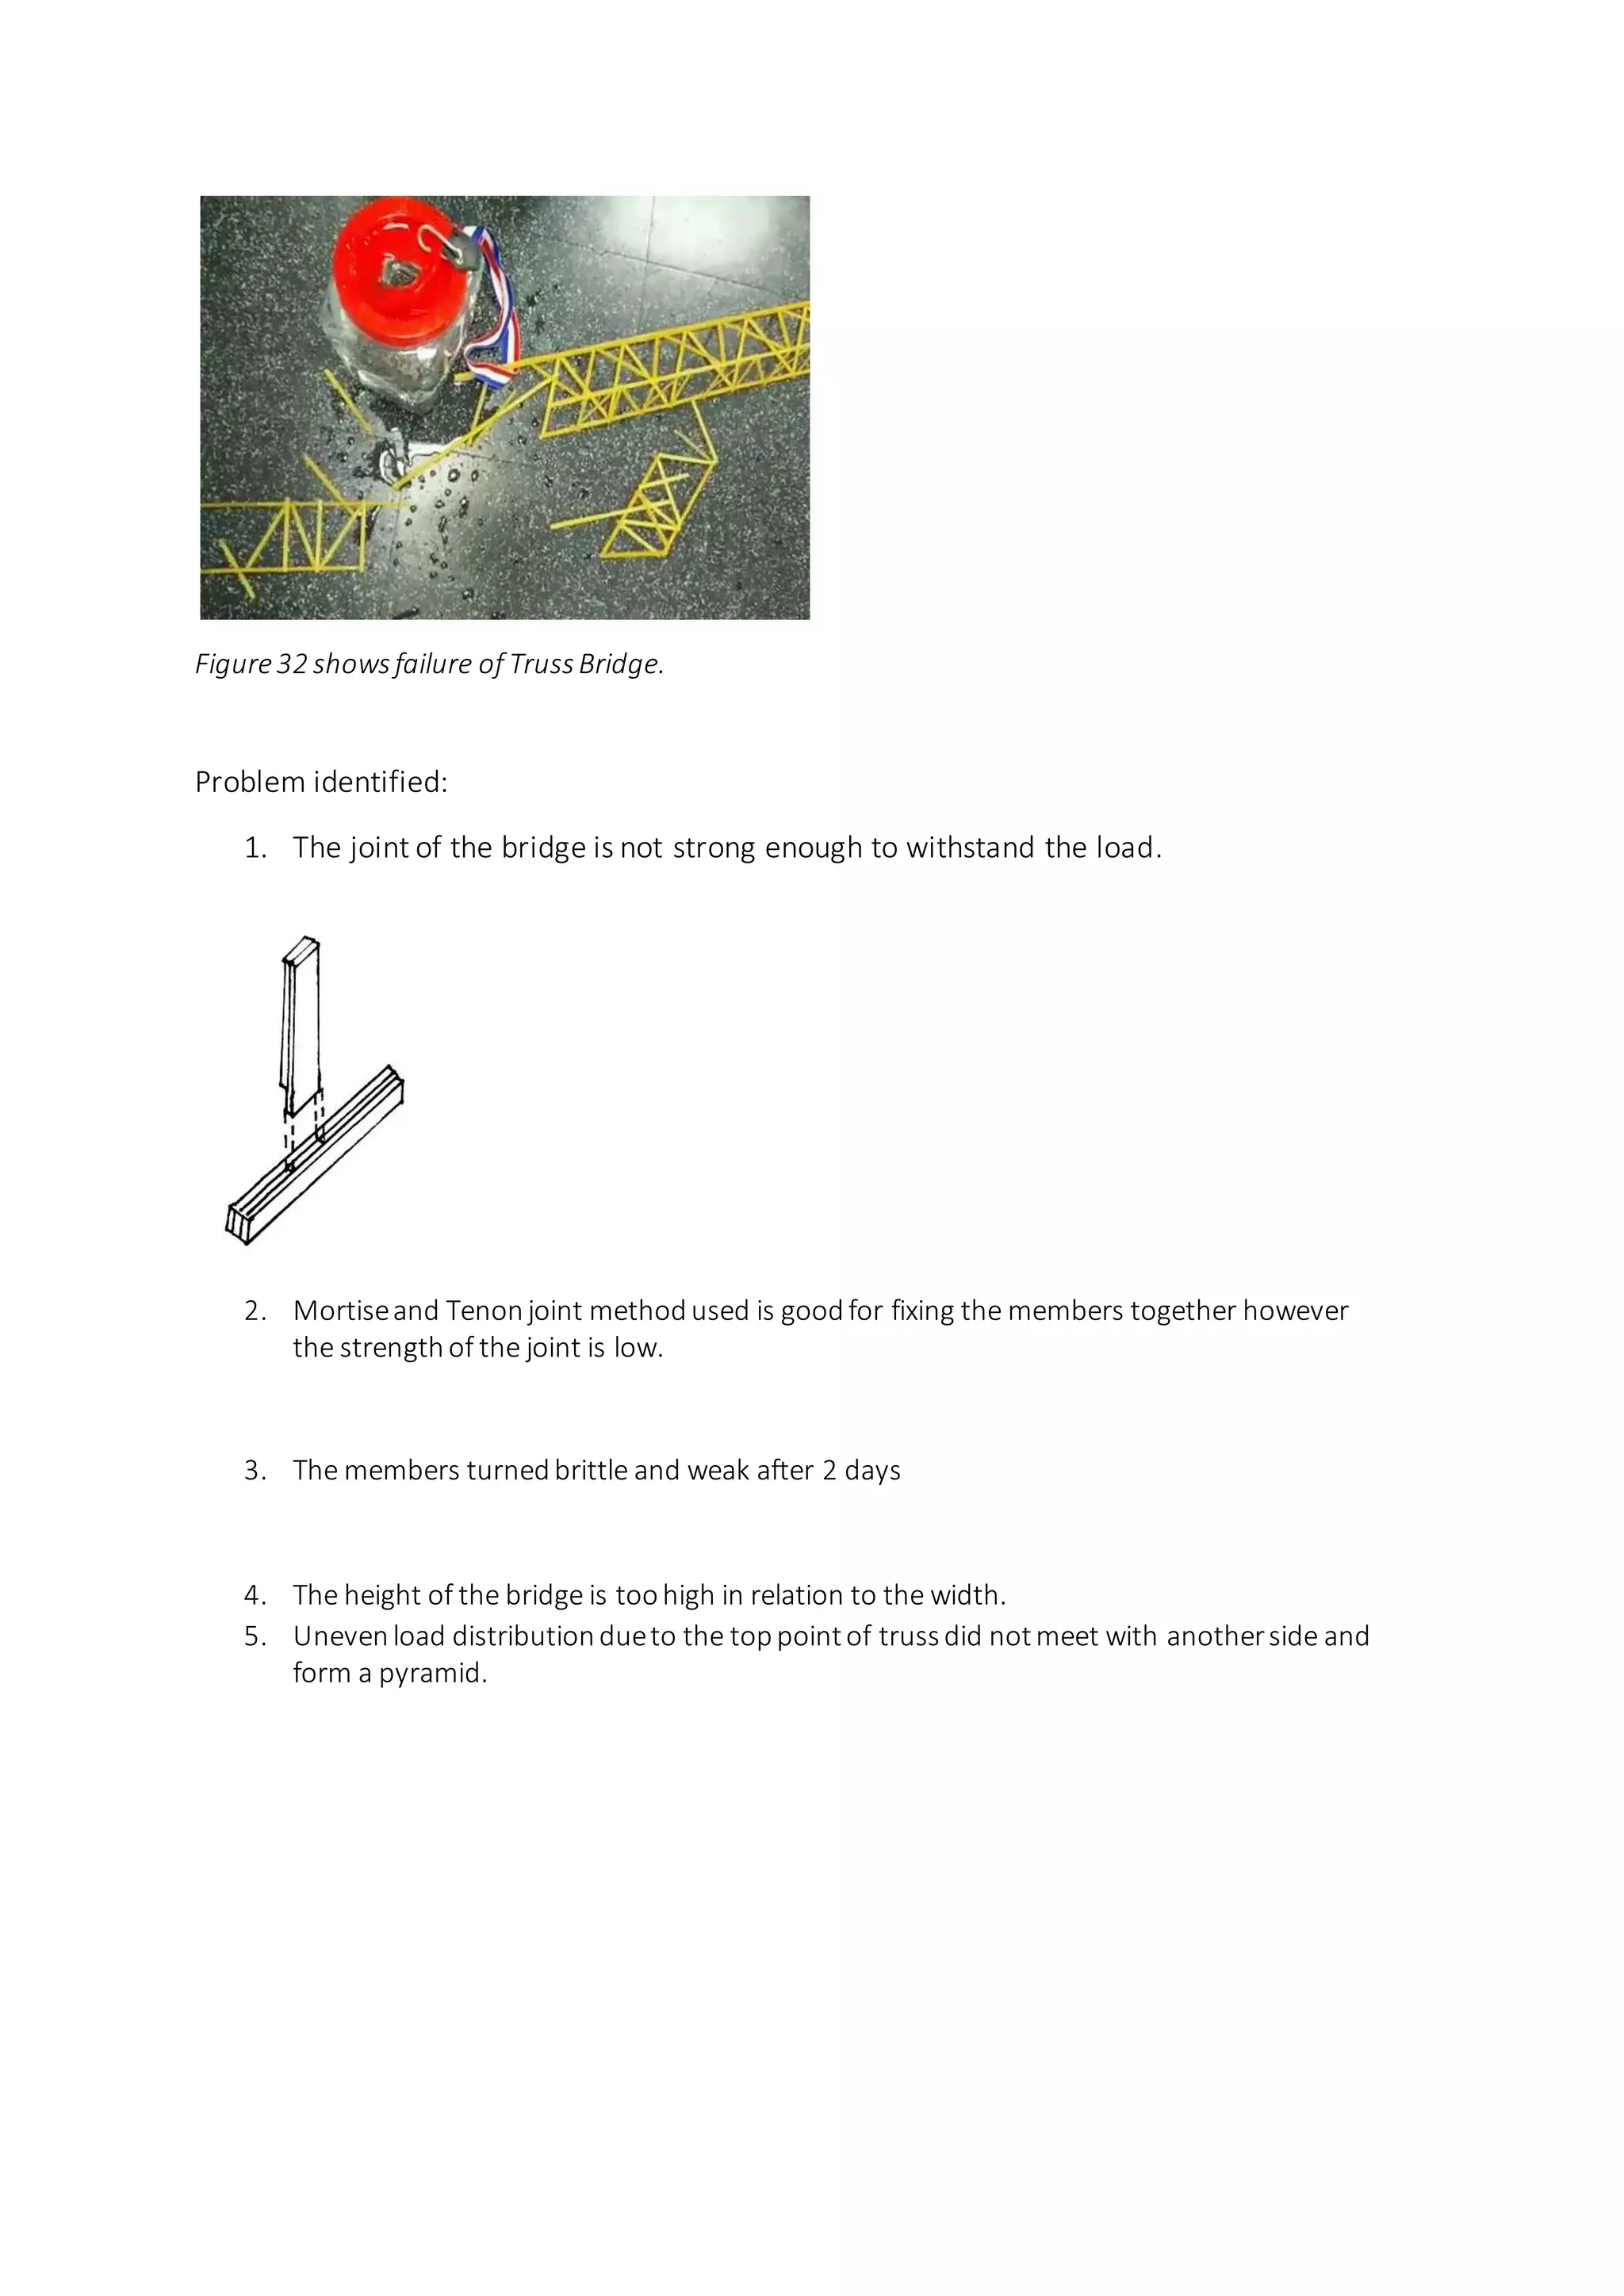
1. The document describes a student project to design a fettuccine truss bridge with a 750mm clear span and maximum weight of 200g.
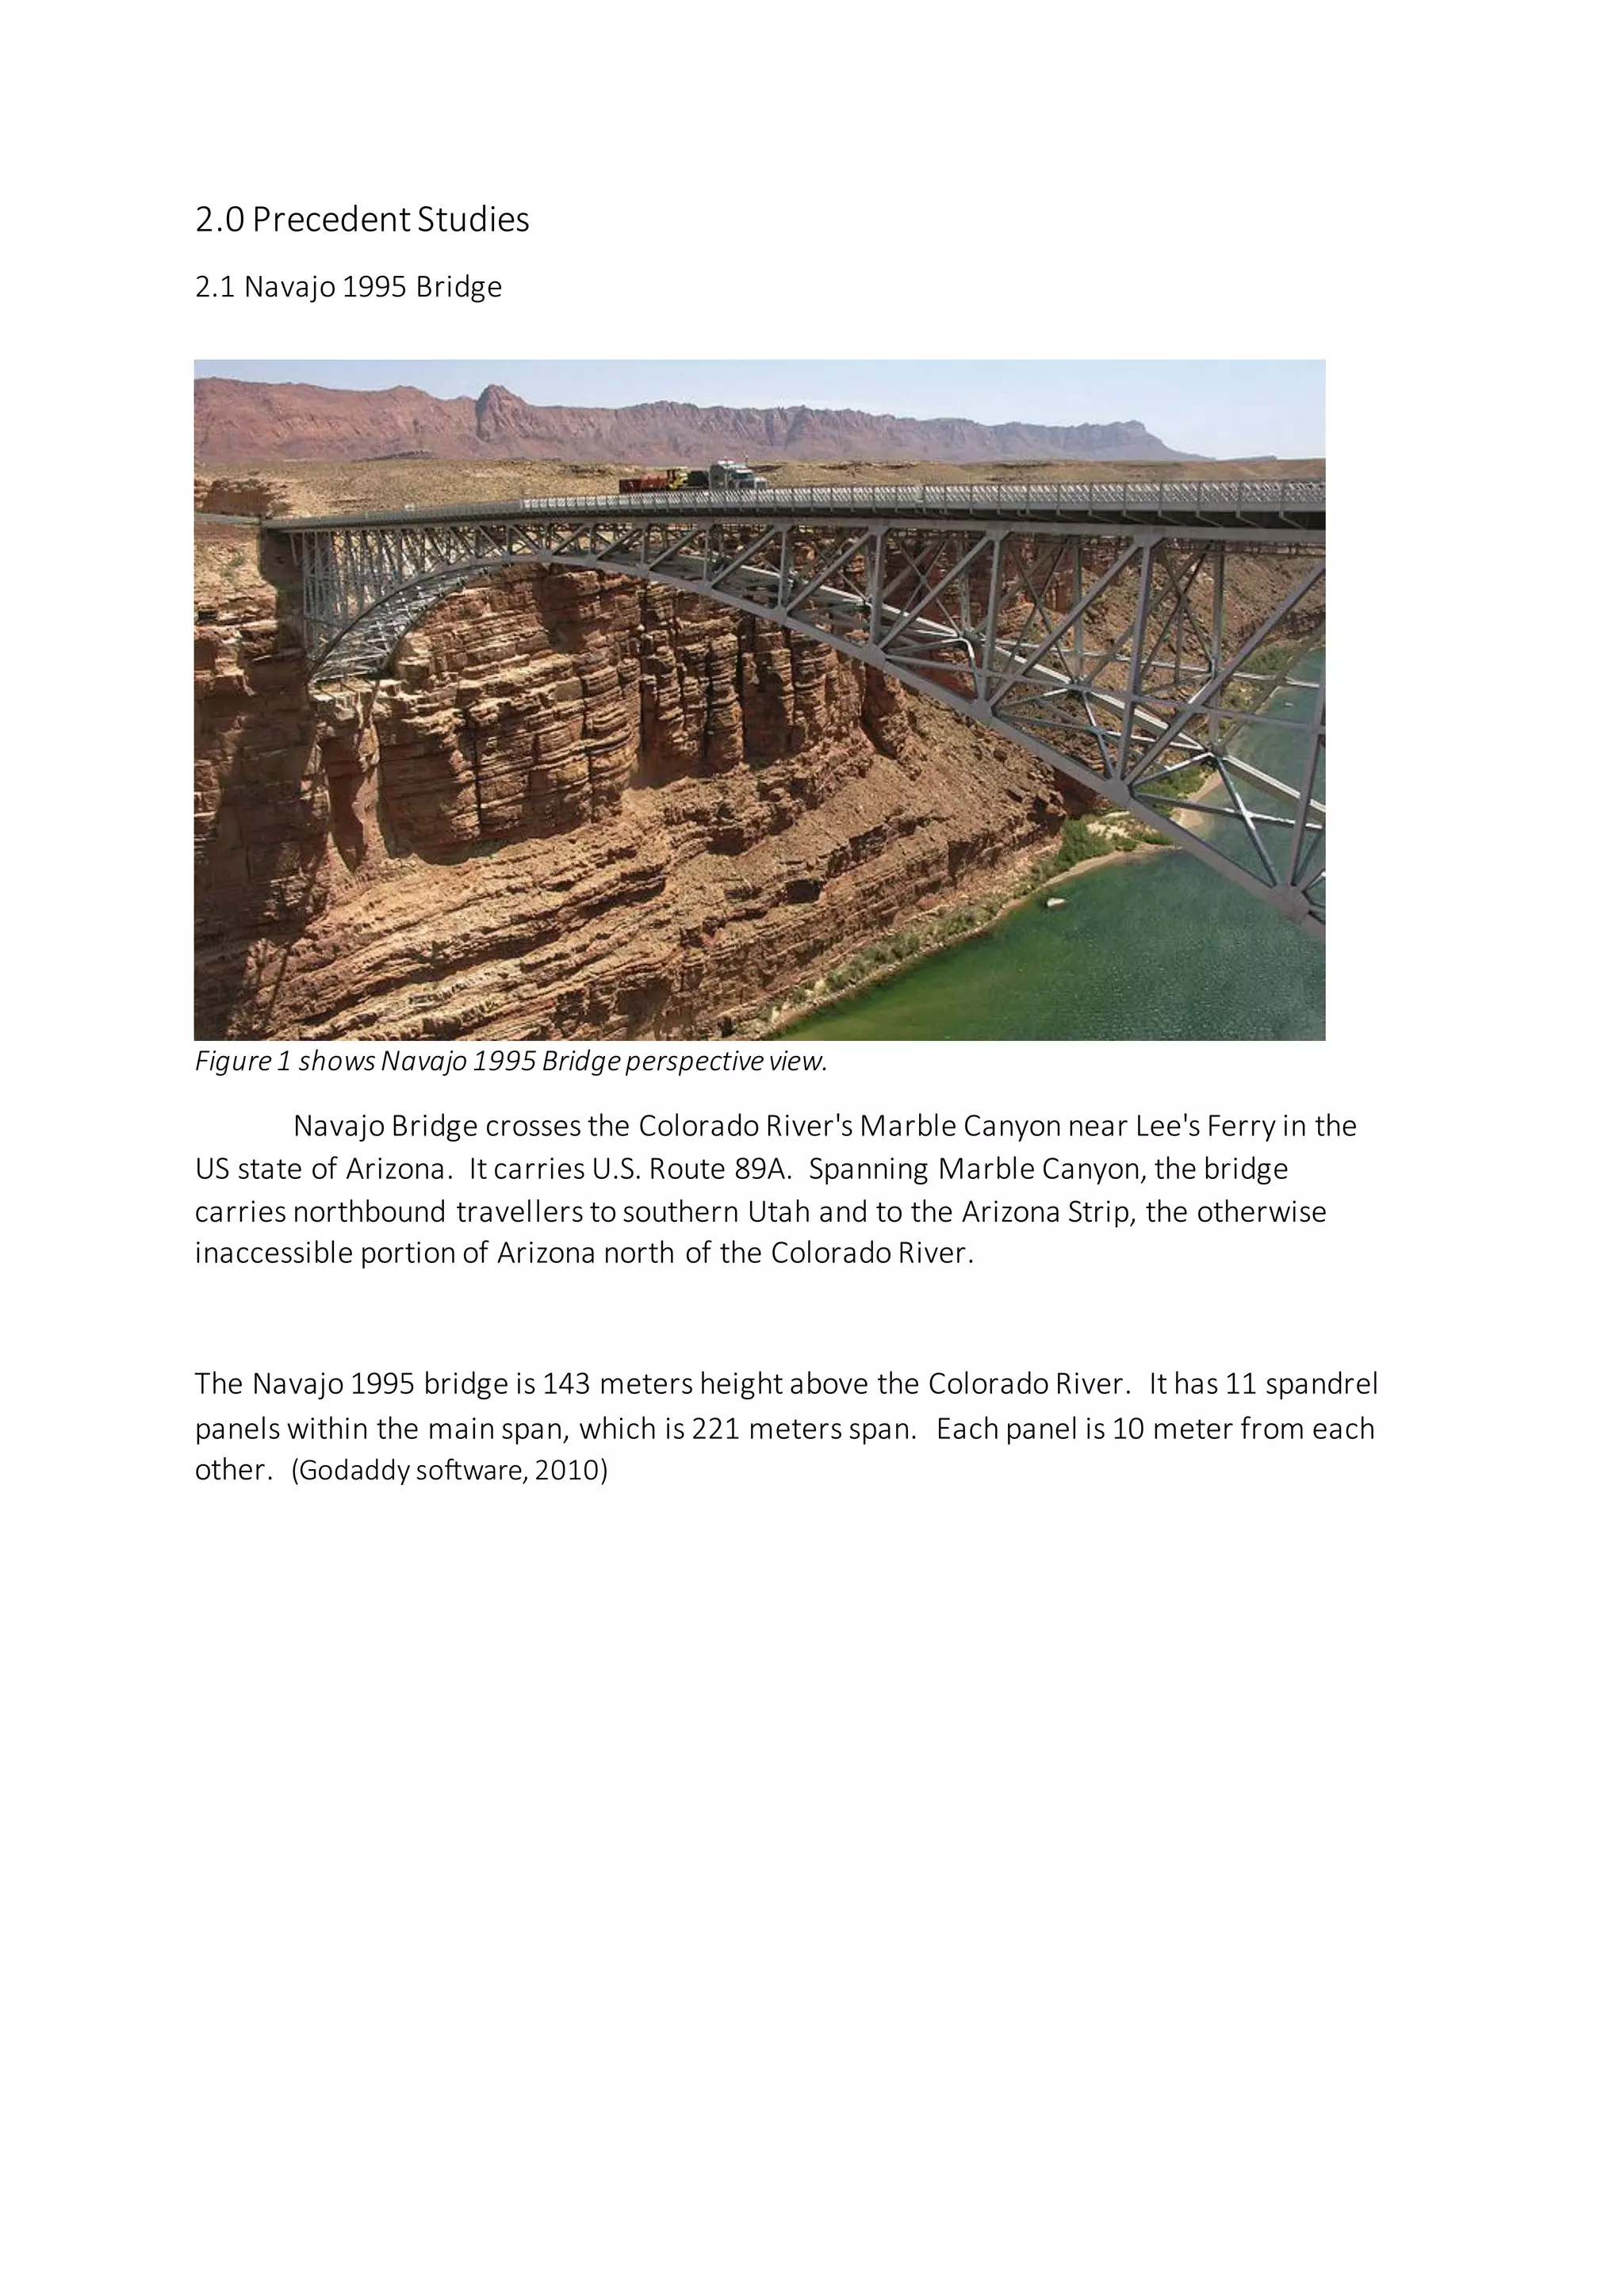
2. Precedent bridge studies and material tests were conducted to inform the design process. Several bridge designs were developed and tested, with refinements made to designs that did not meet requirements.
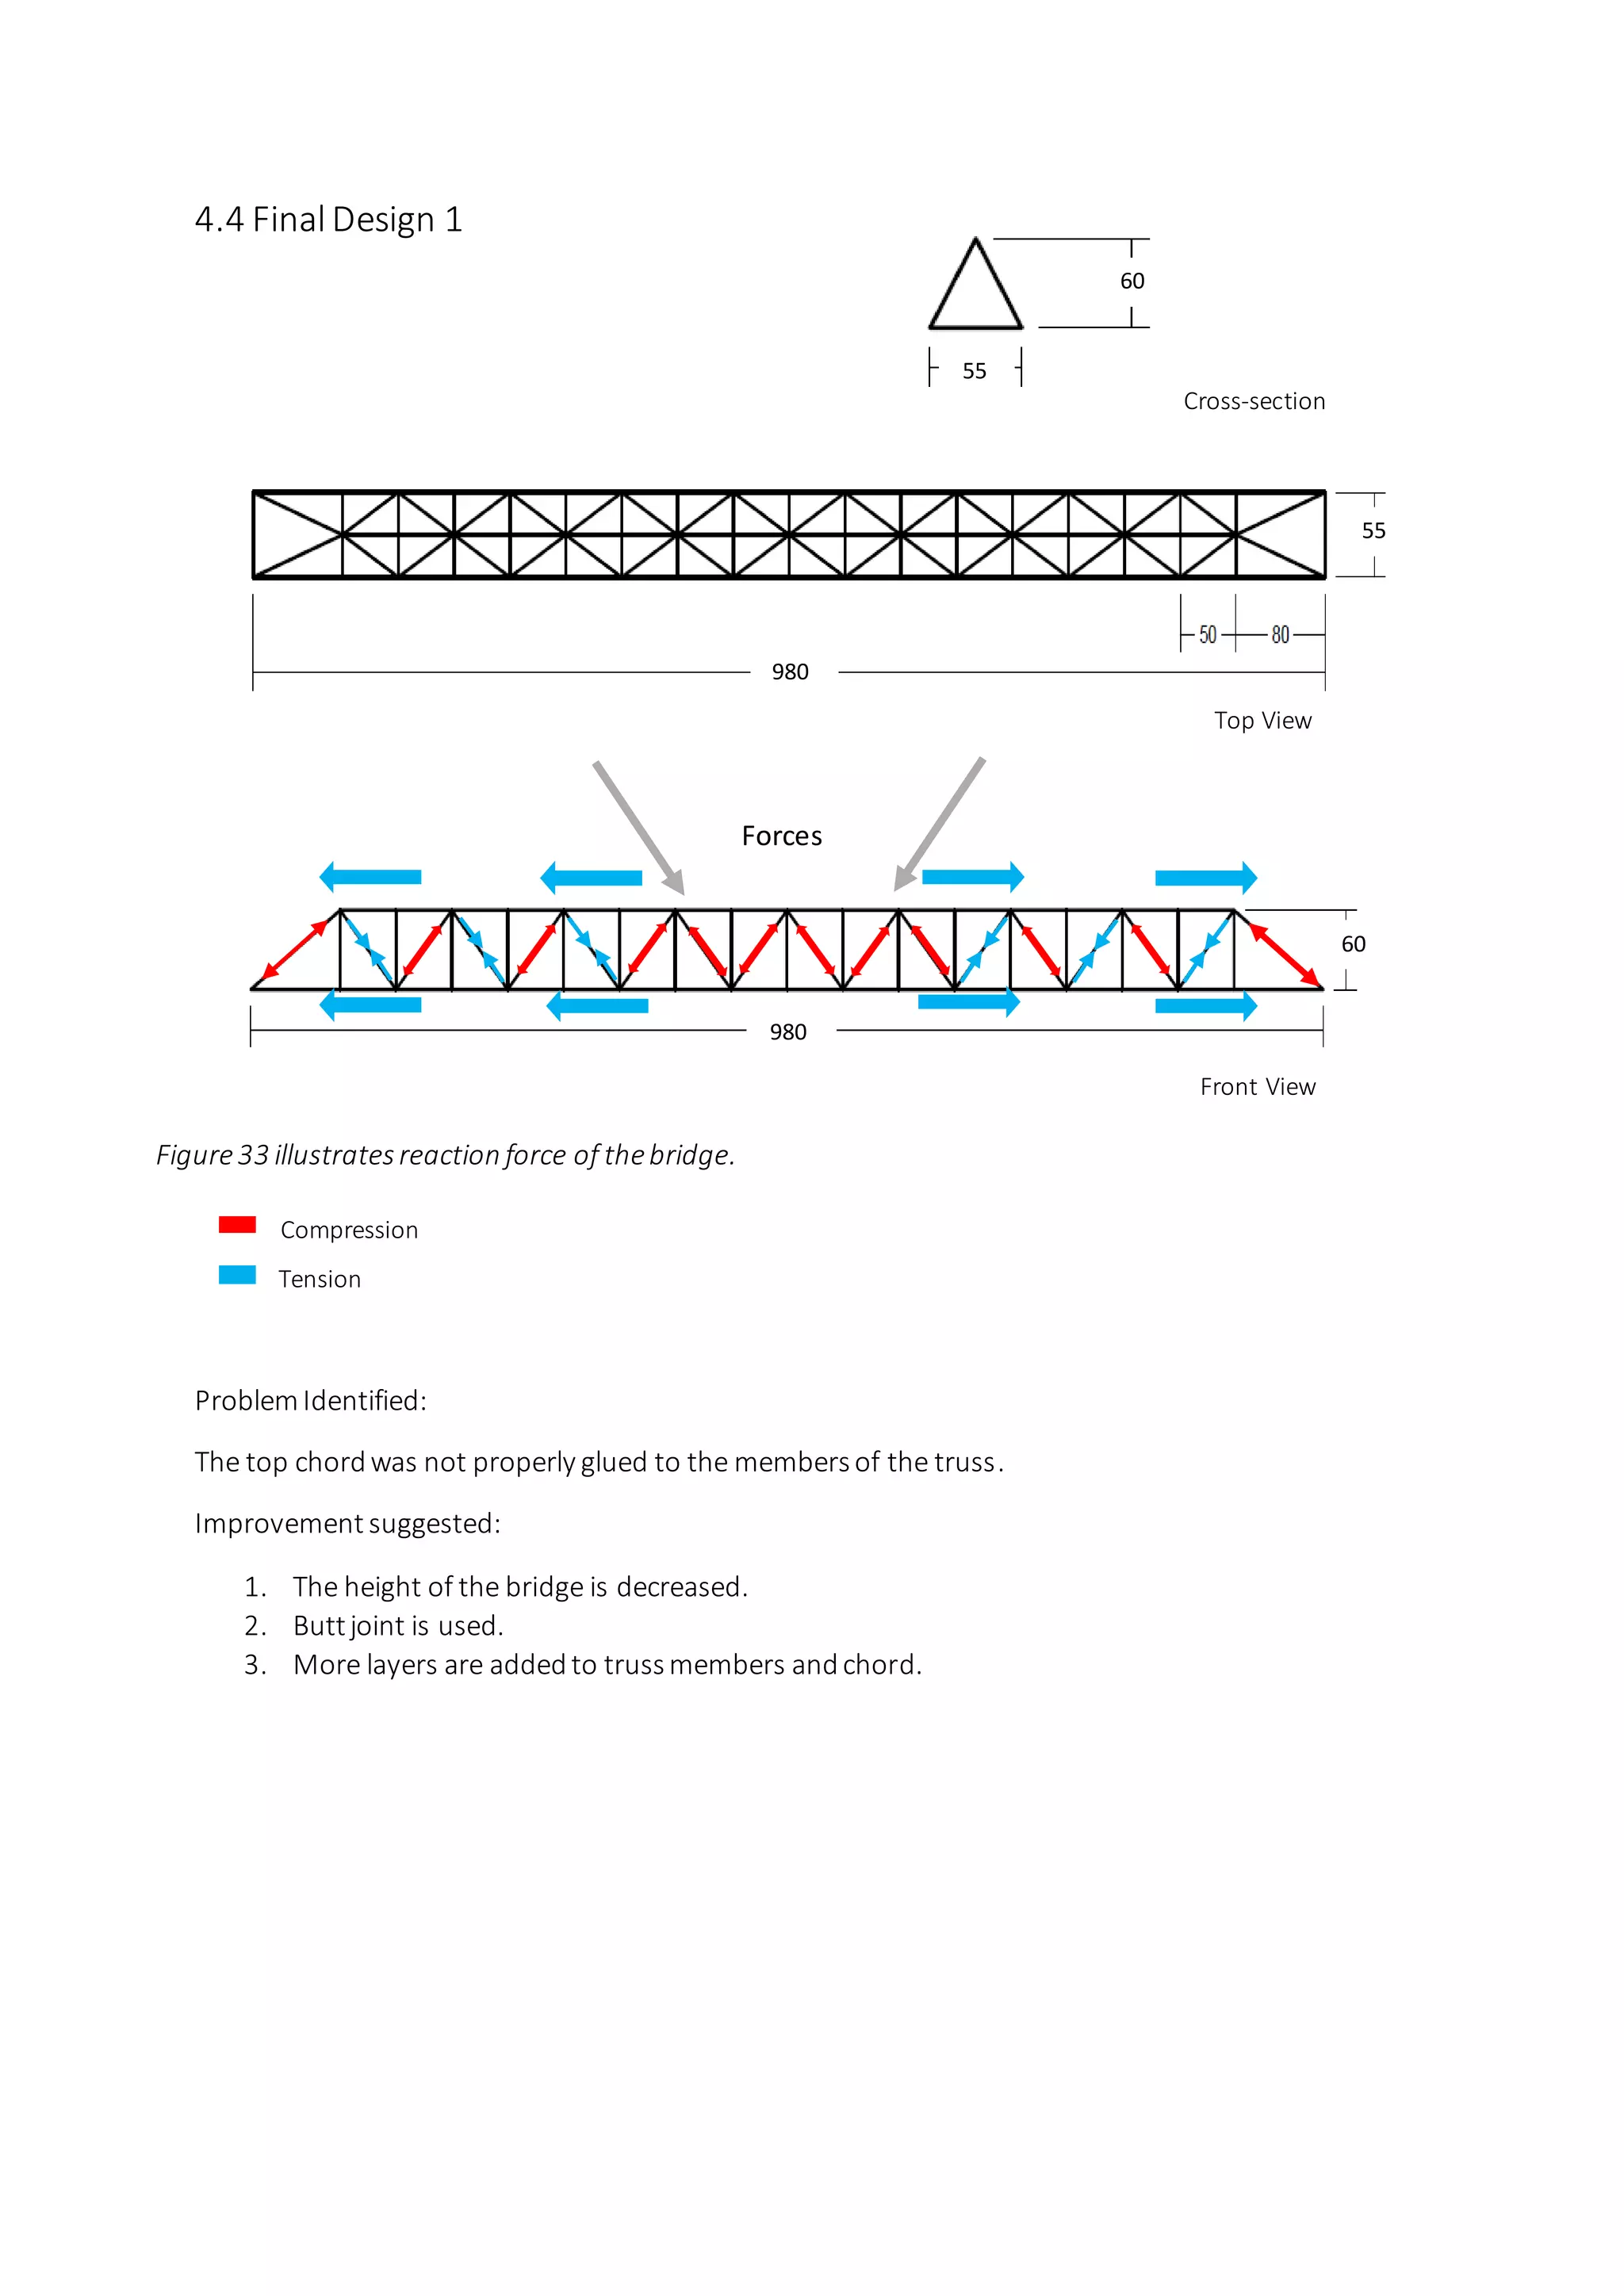
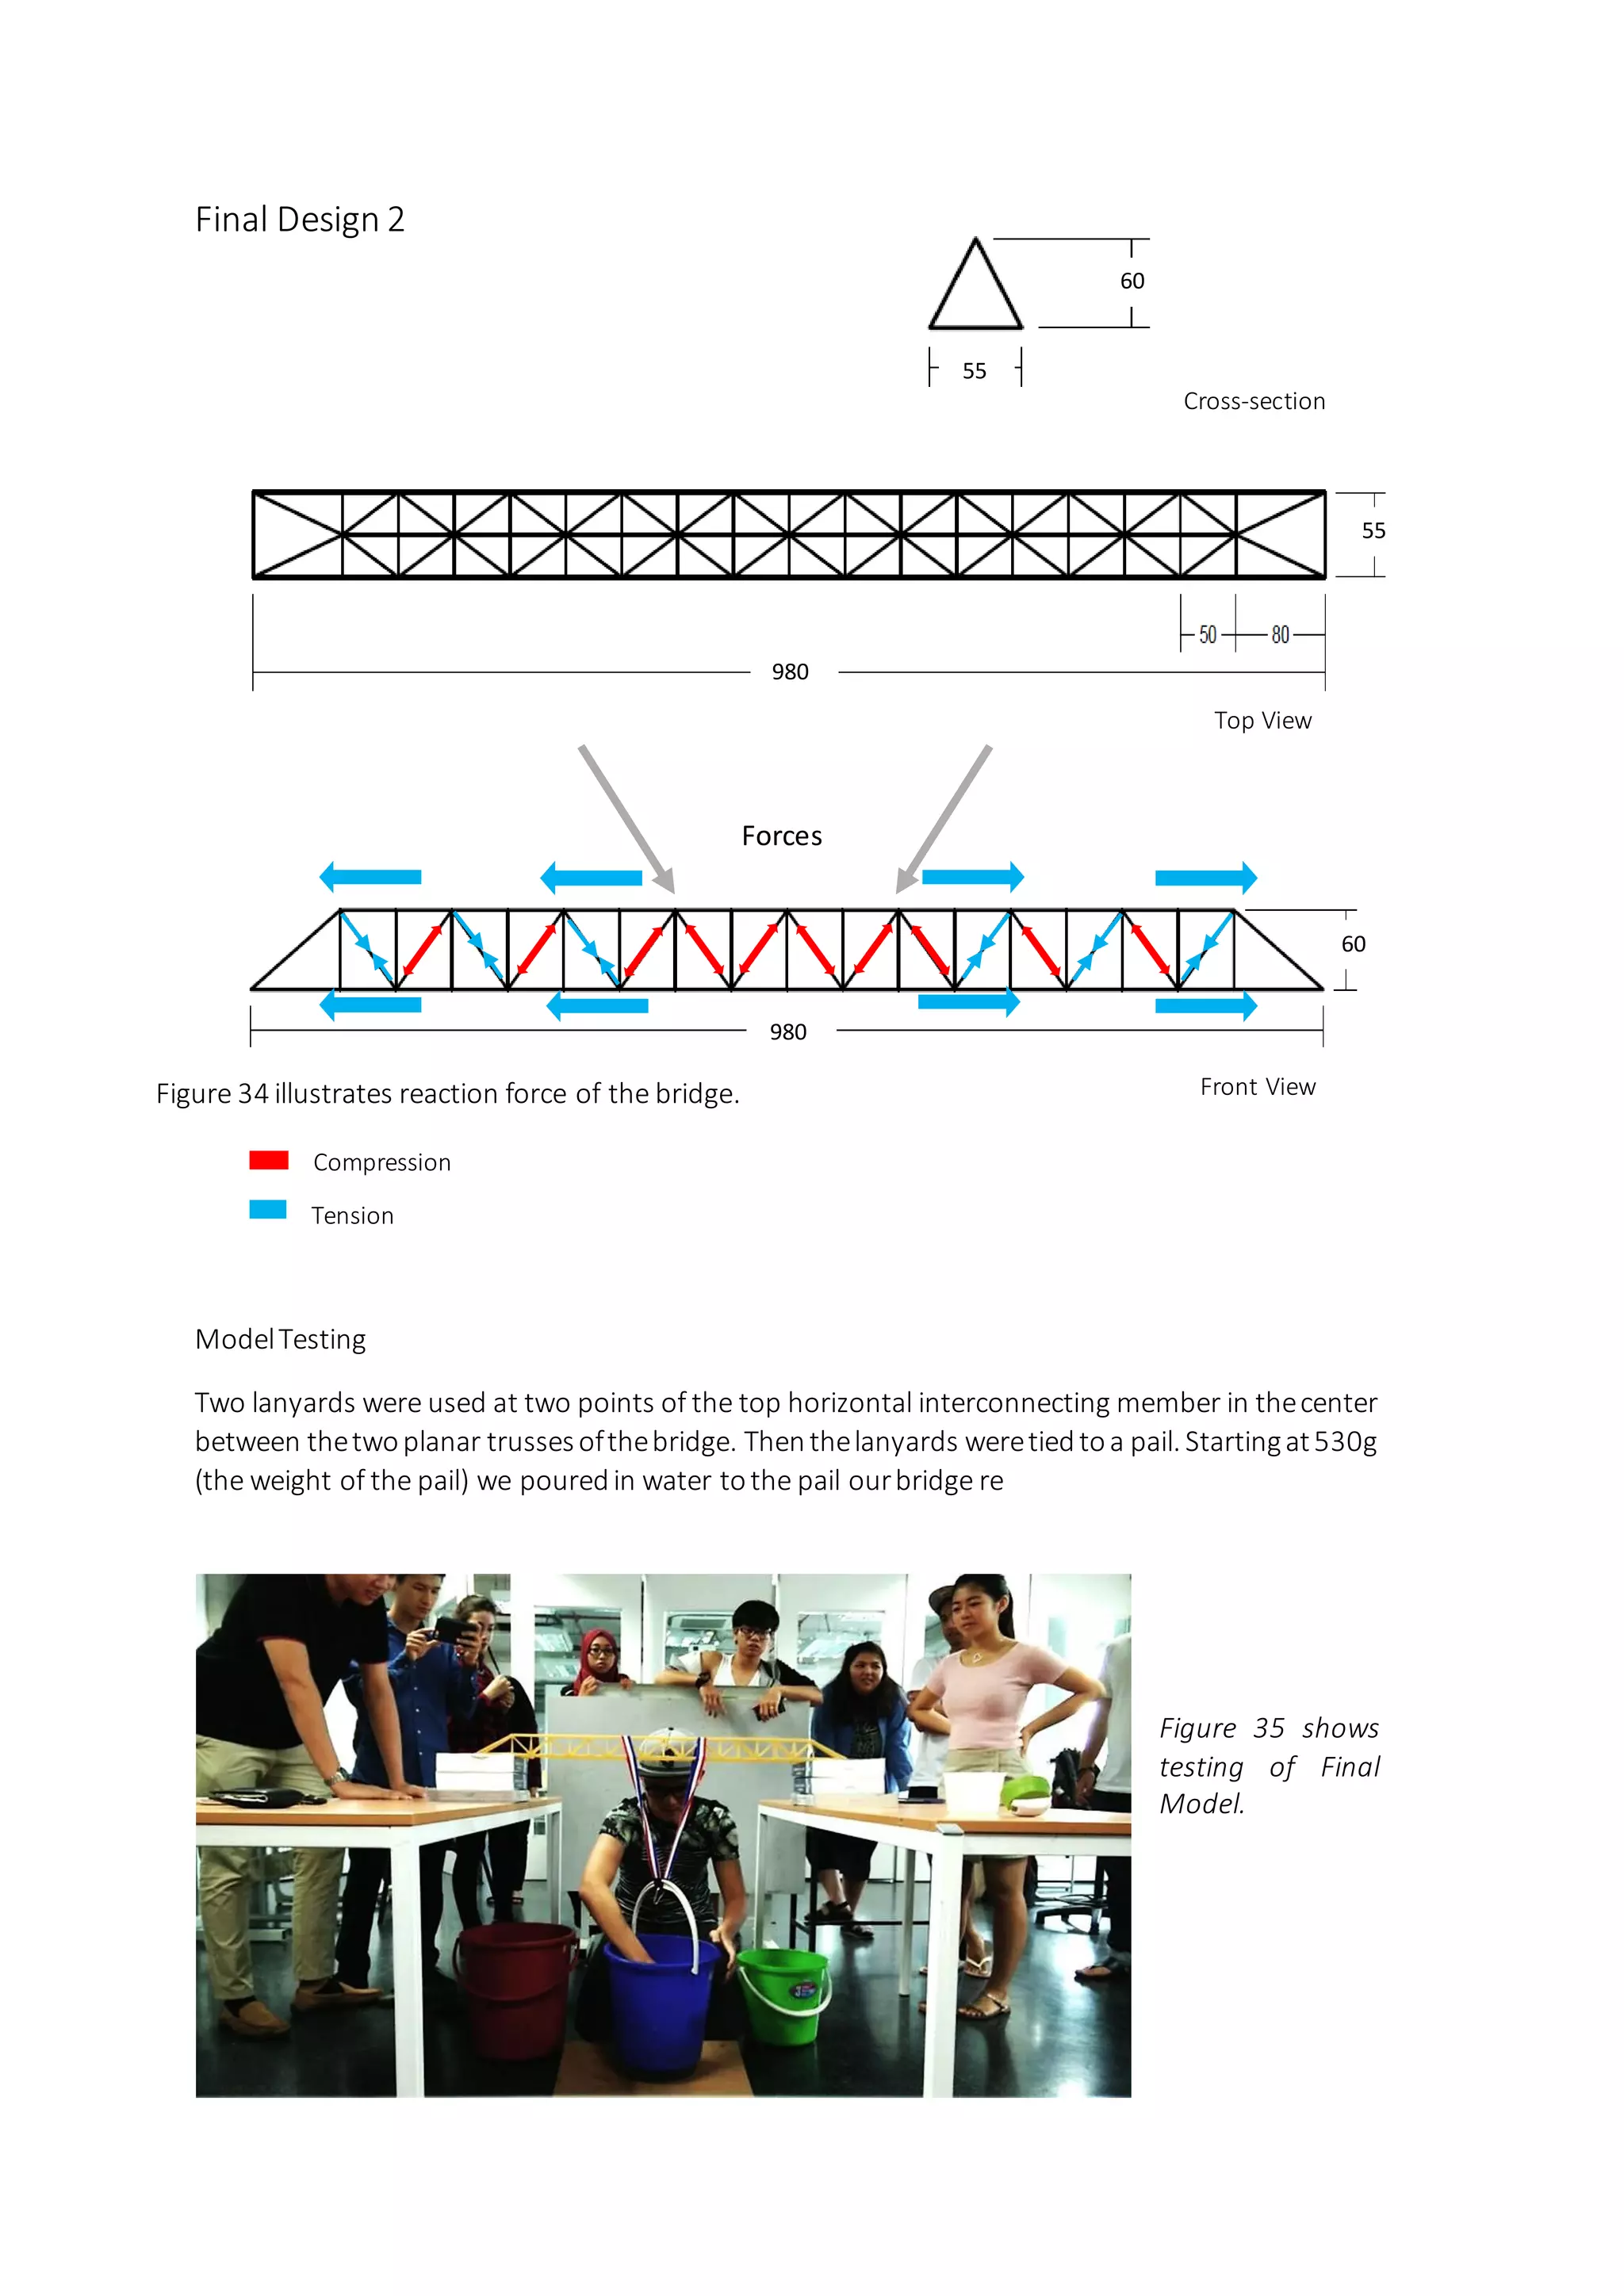
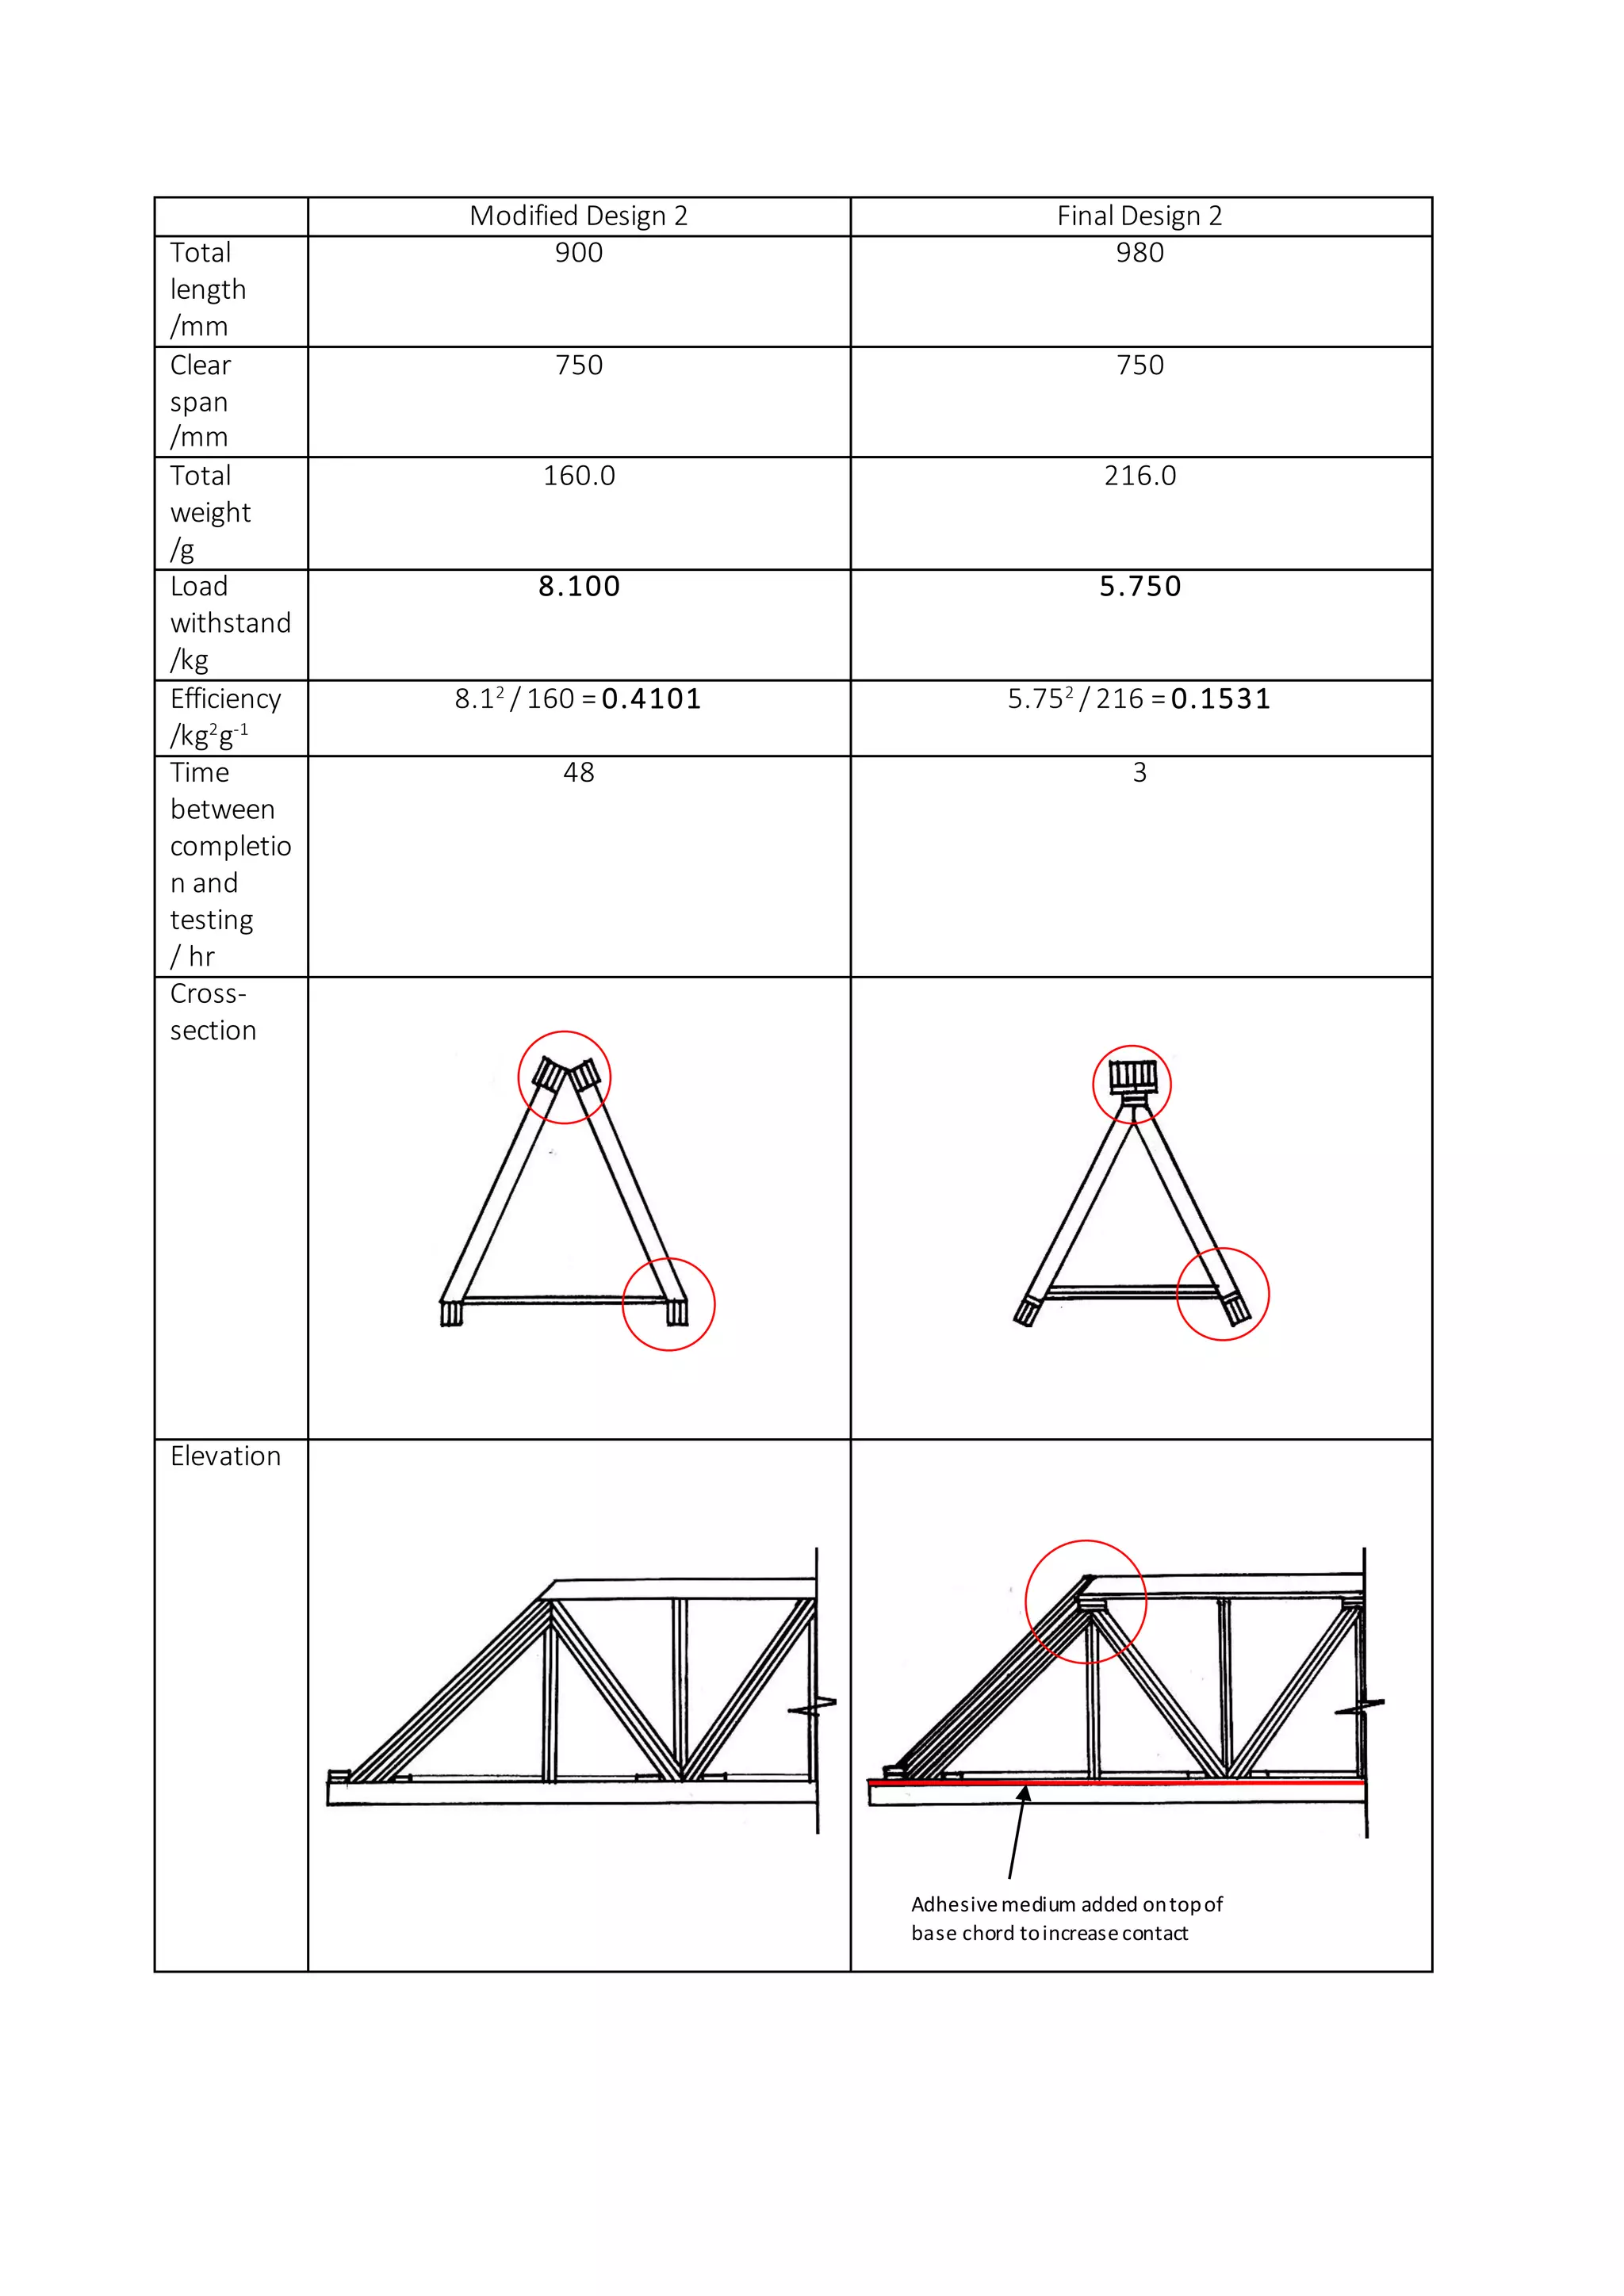
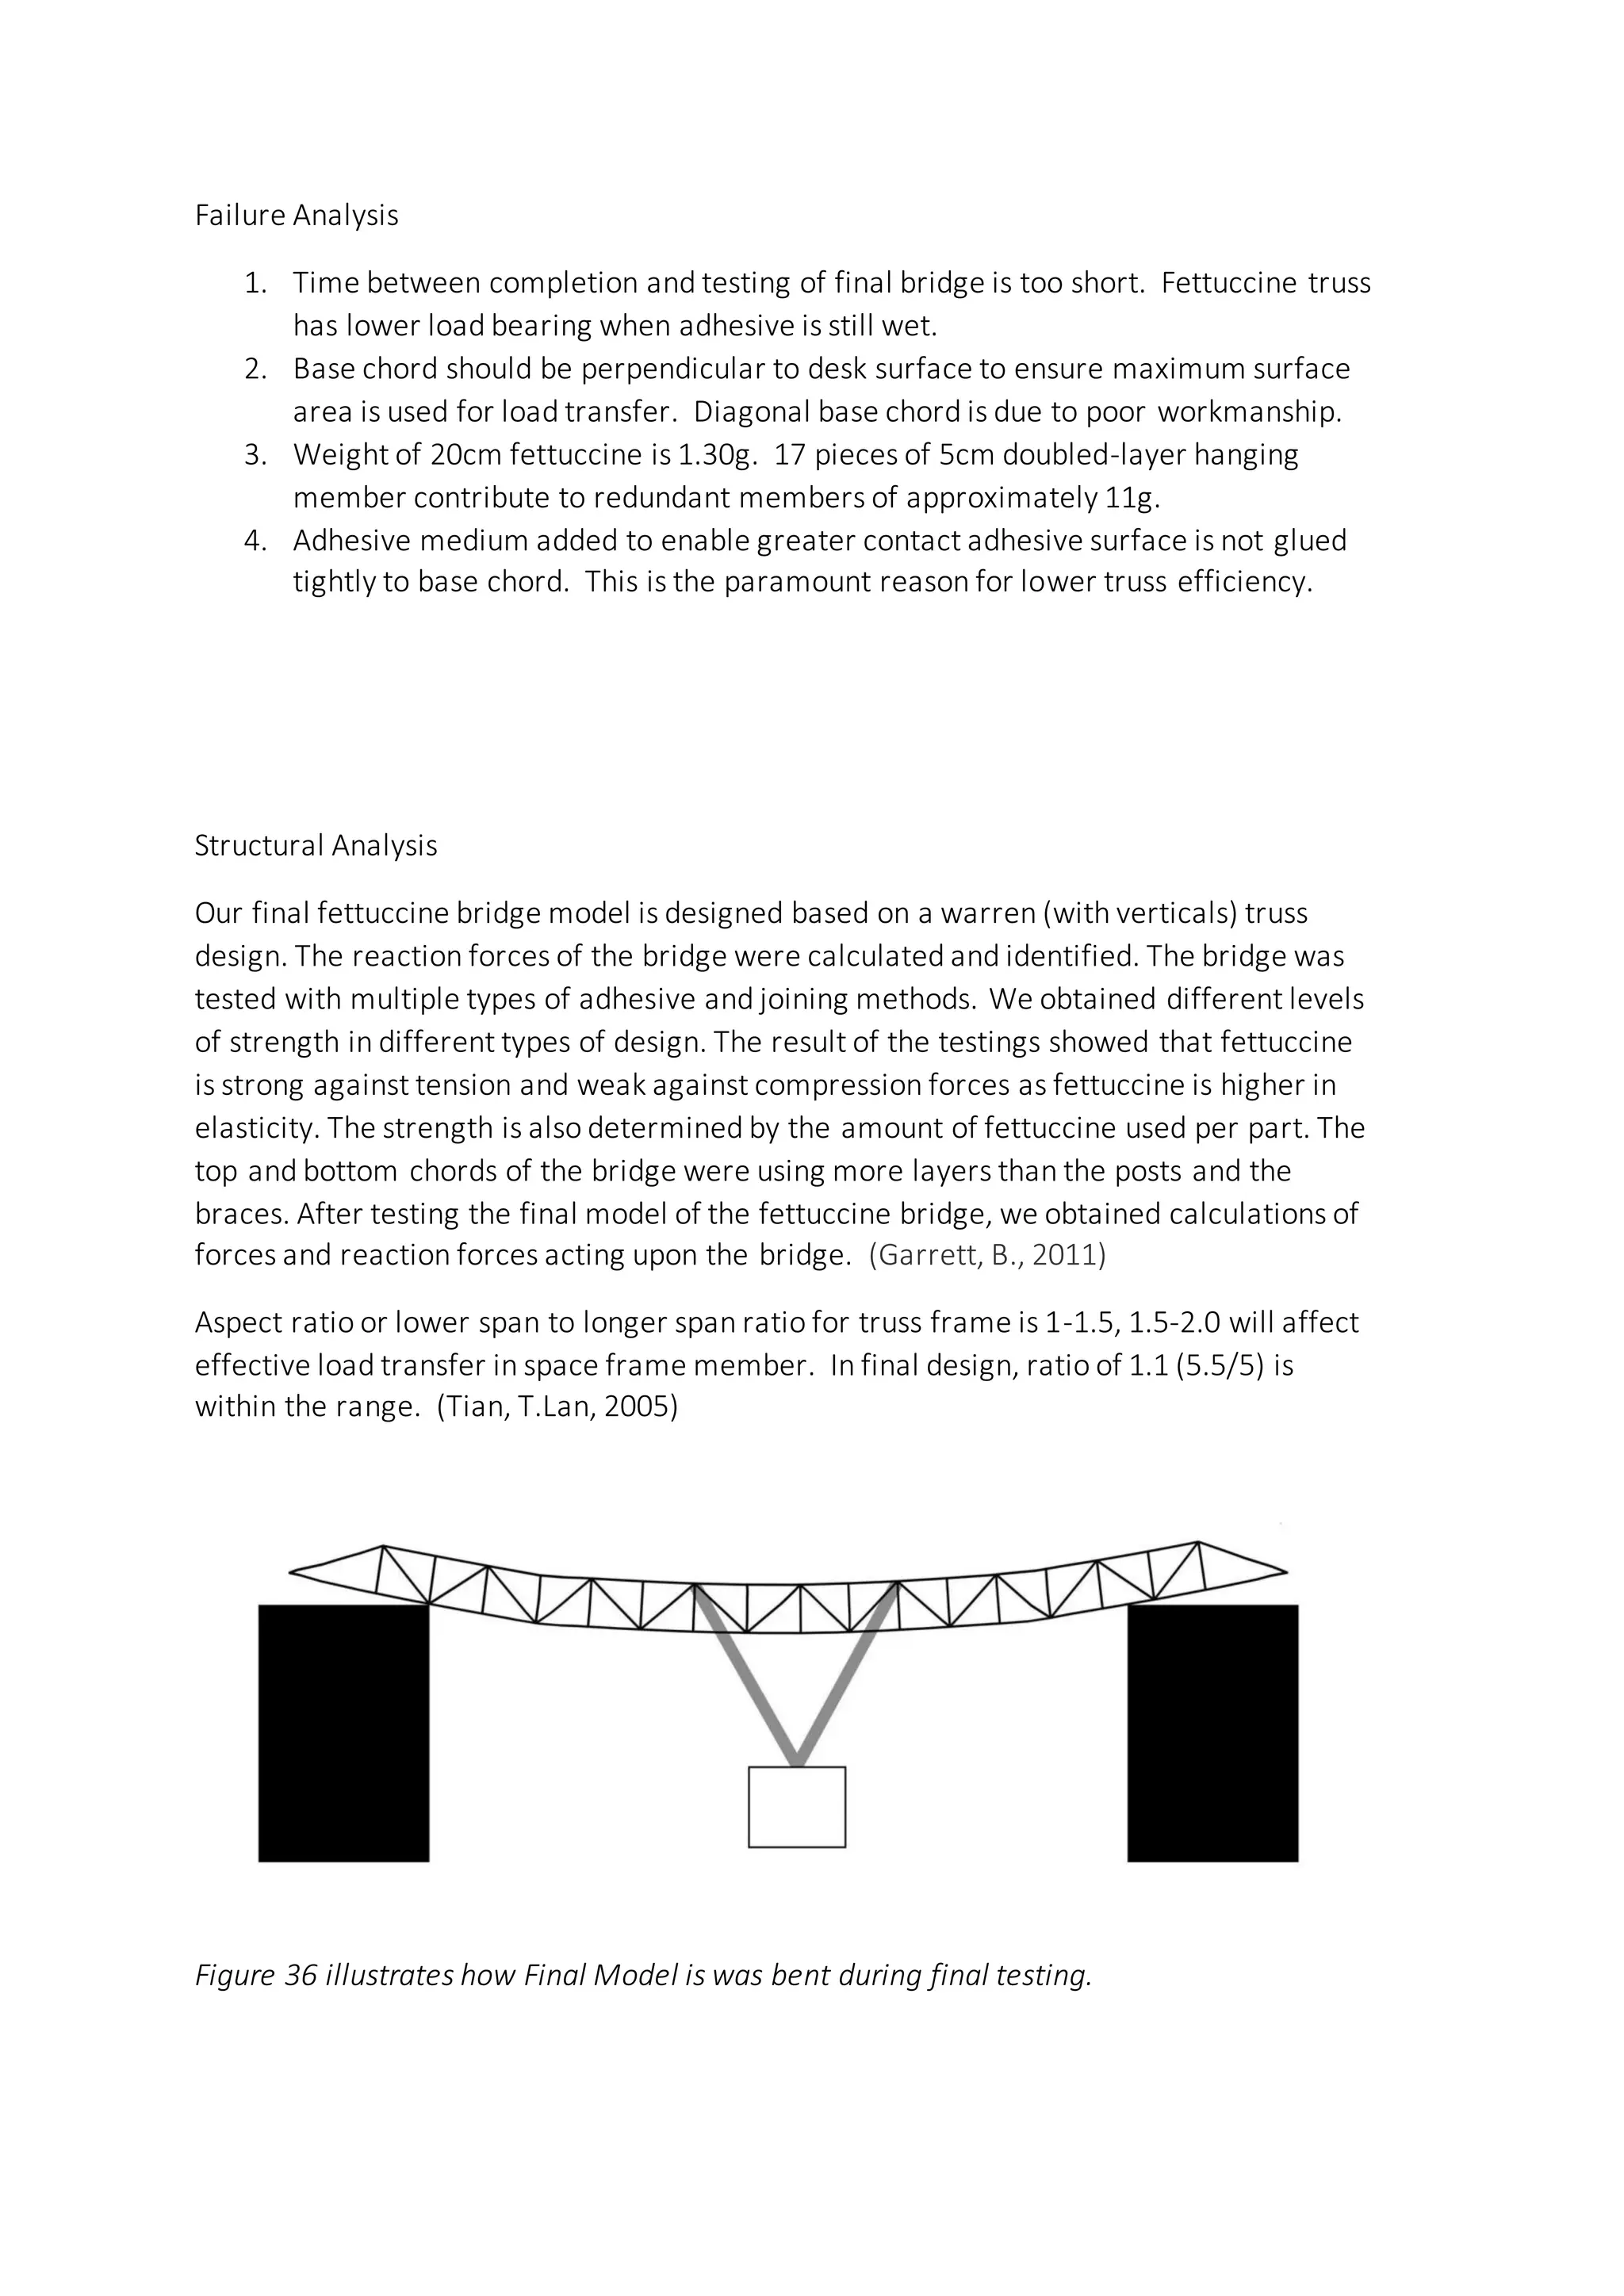
3. A final design was a warren truss bridge with a 980mm length, 216g weight, and efficiency of 0.1531. Failure analysis found issues with workmanship, redundant members, and insufficient adhesive bonding contributed to its lower efficiency than expected.
![Schoolof Architecture, Building & Design
Research Unit for Modern Architecture Studiesin SoutheastAsia
Bachelor of Science (Honours) (Architecture)
Building Structures[ARC2523]
Project1: Fettuccine Truss Bridge
Tutor: Mr. Mohd. Adib Ramli
Groupmember:
Tan Wei How 0310707
Teh Xue Kai 0317021
How Pei Ngoh 0316929
Ang Jia Pin 0315506
Lucas WongKok Hoe 0309421
WongKah Voon 0317510](https://image.slidesharecdn.com/carbonara-cd-completed-150711090119-lva1-app6892/75/Building-structure-project-1-Fettuccine-Truss-Bridge-1-2048.jpg)
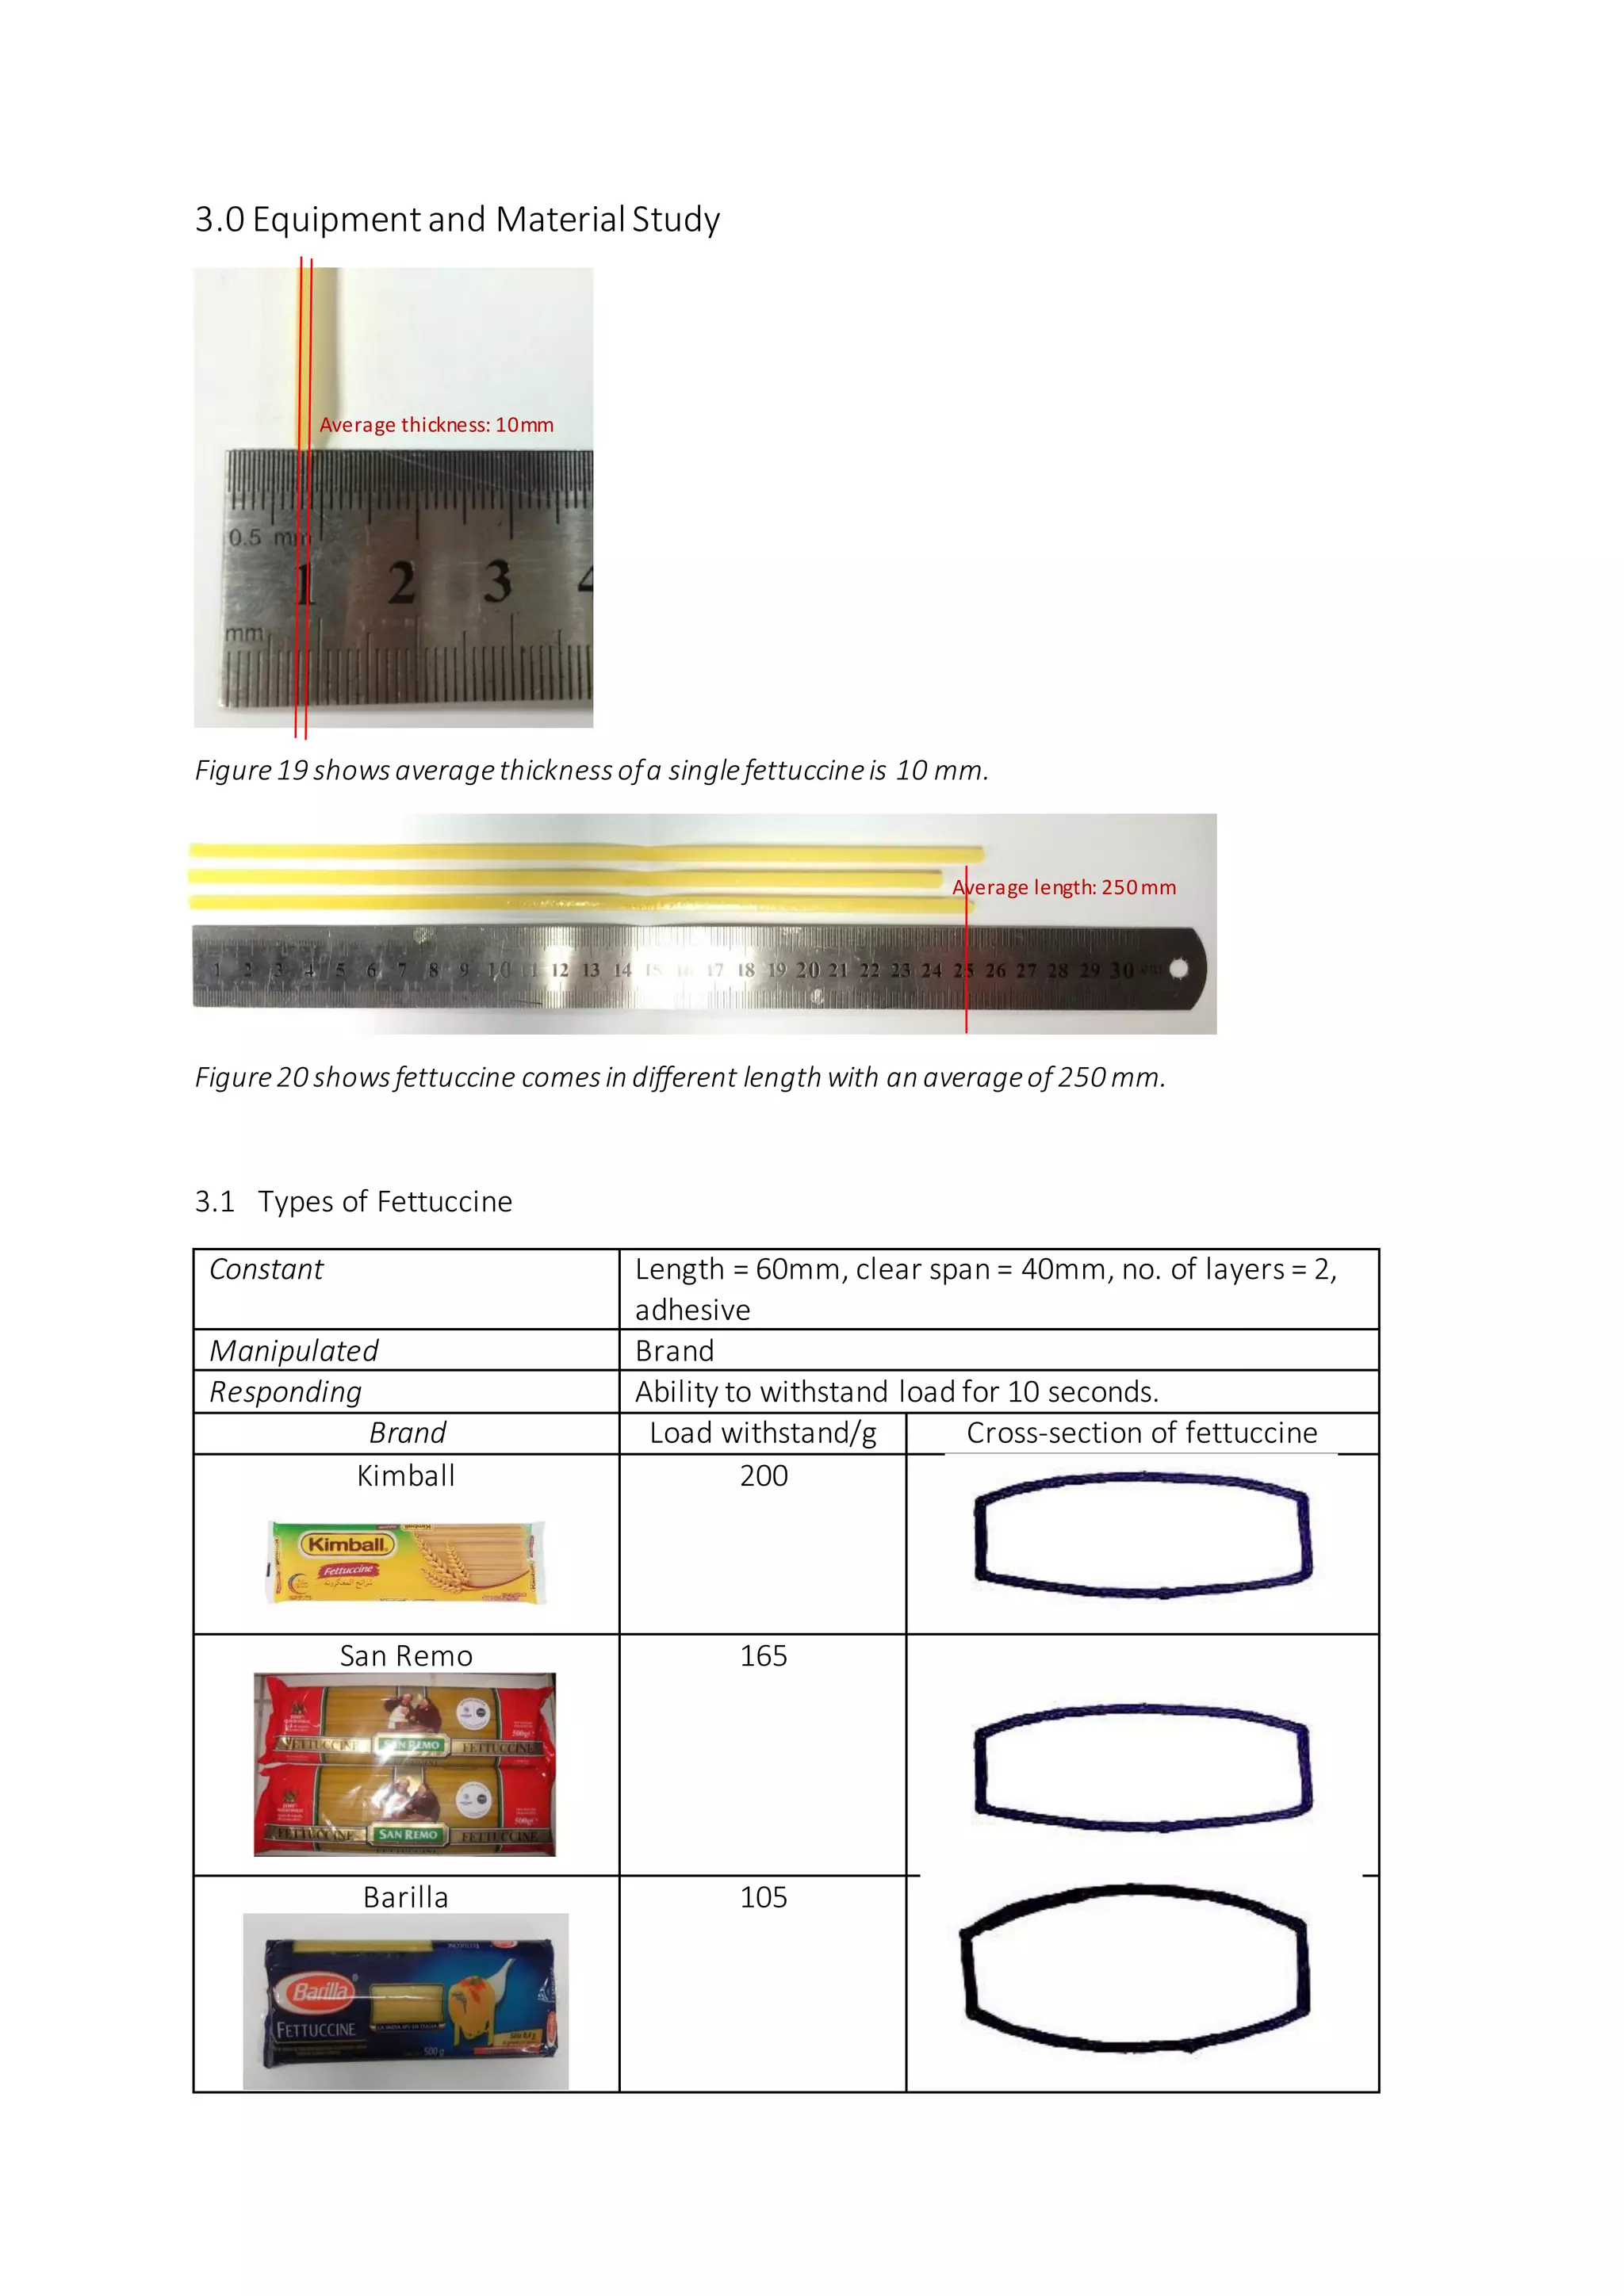
![Conclusion: Barilla fettuccine is the strongest, but San Remo is the most
suitable for bridge making as it has flatter surface which enables larger contact
adhesive surface.
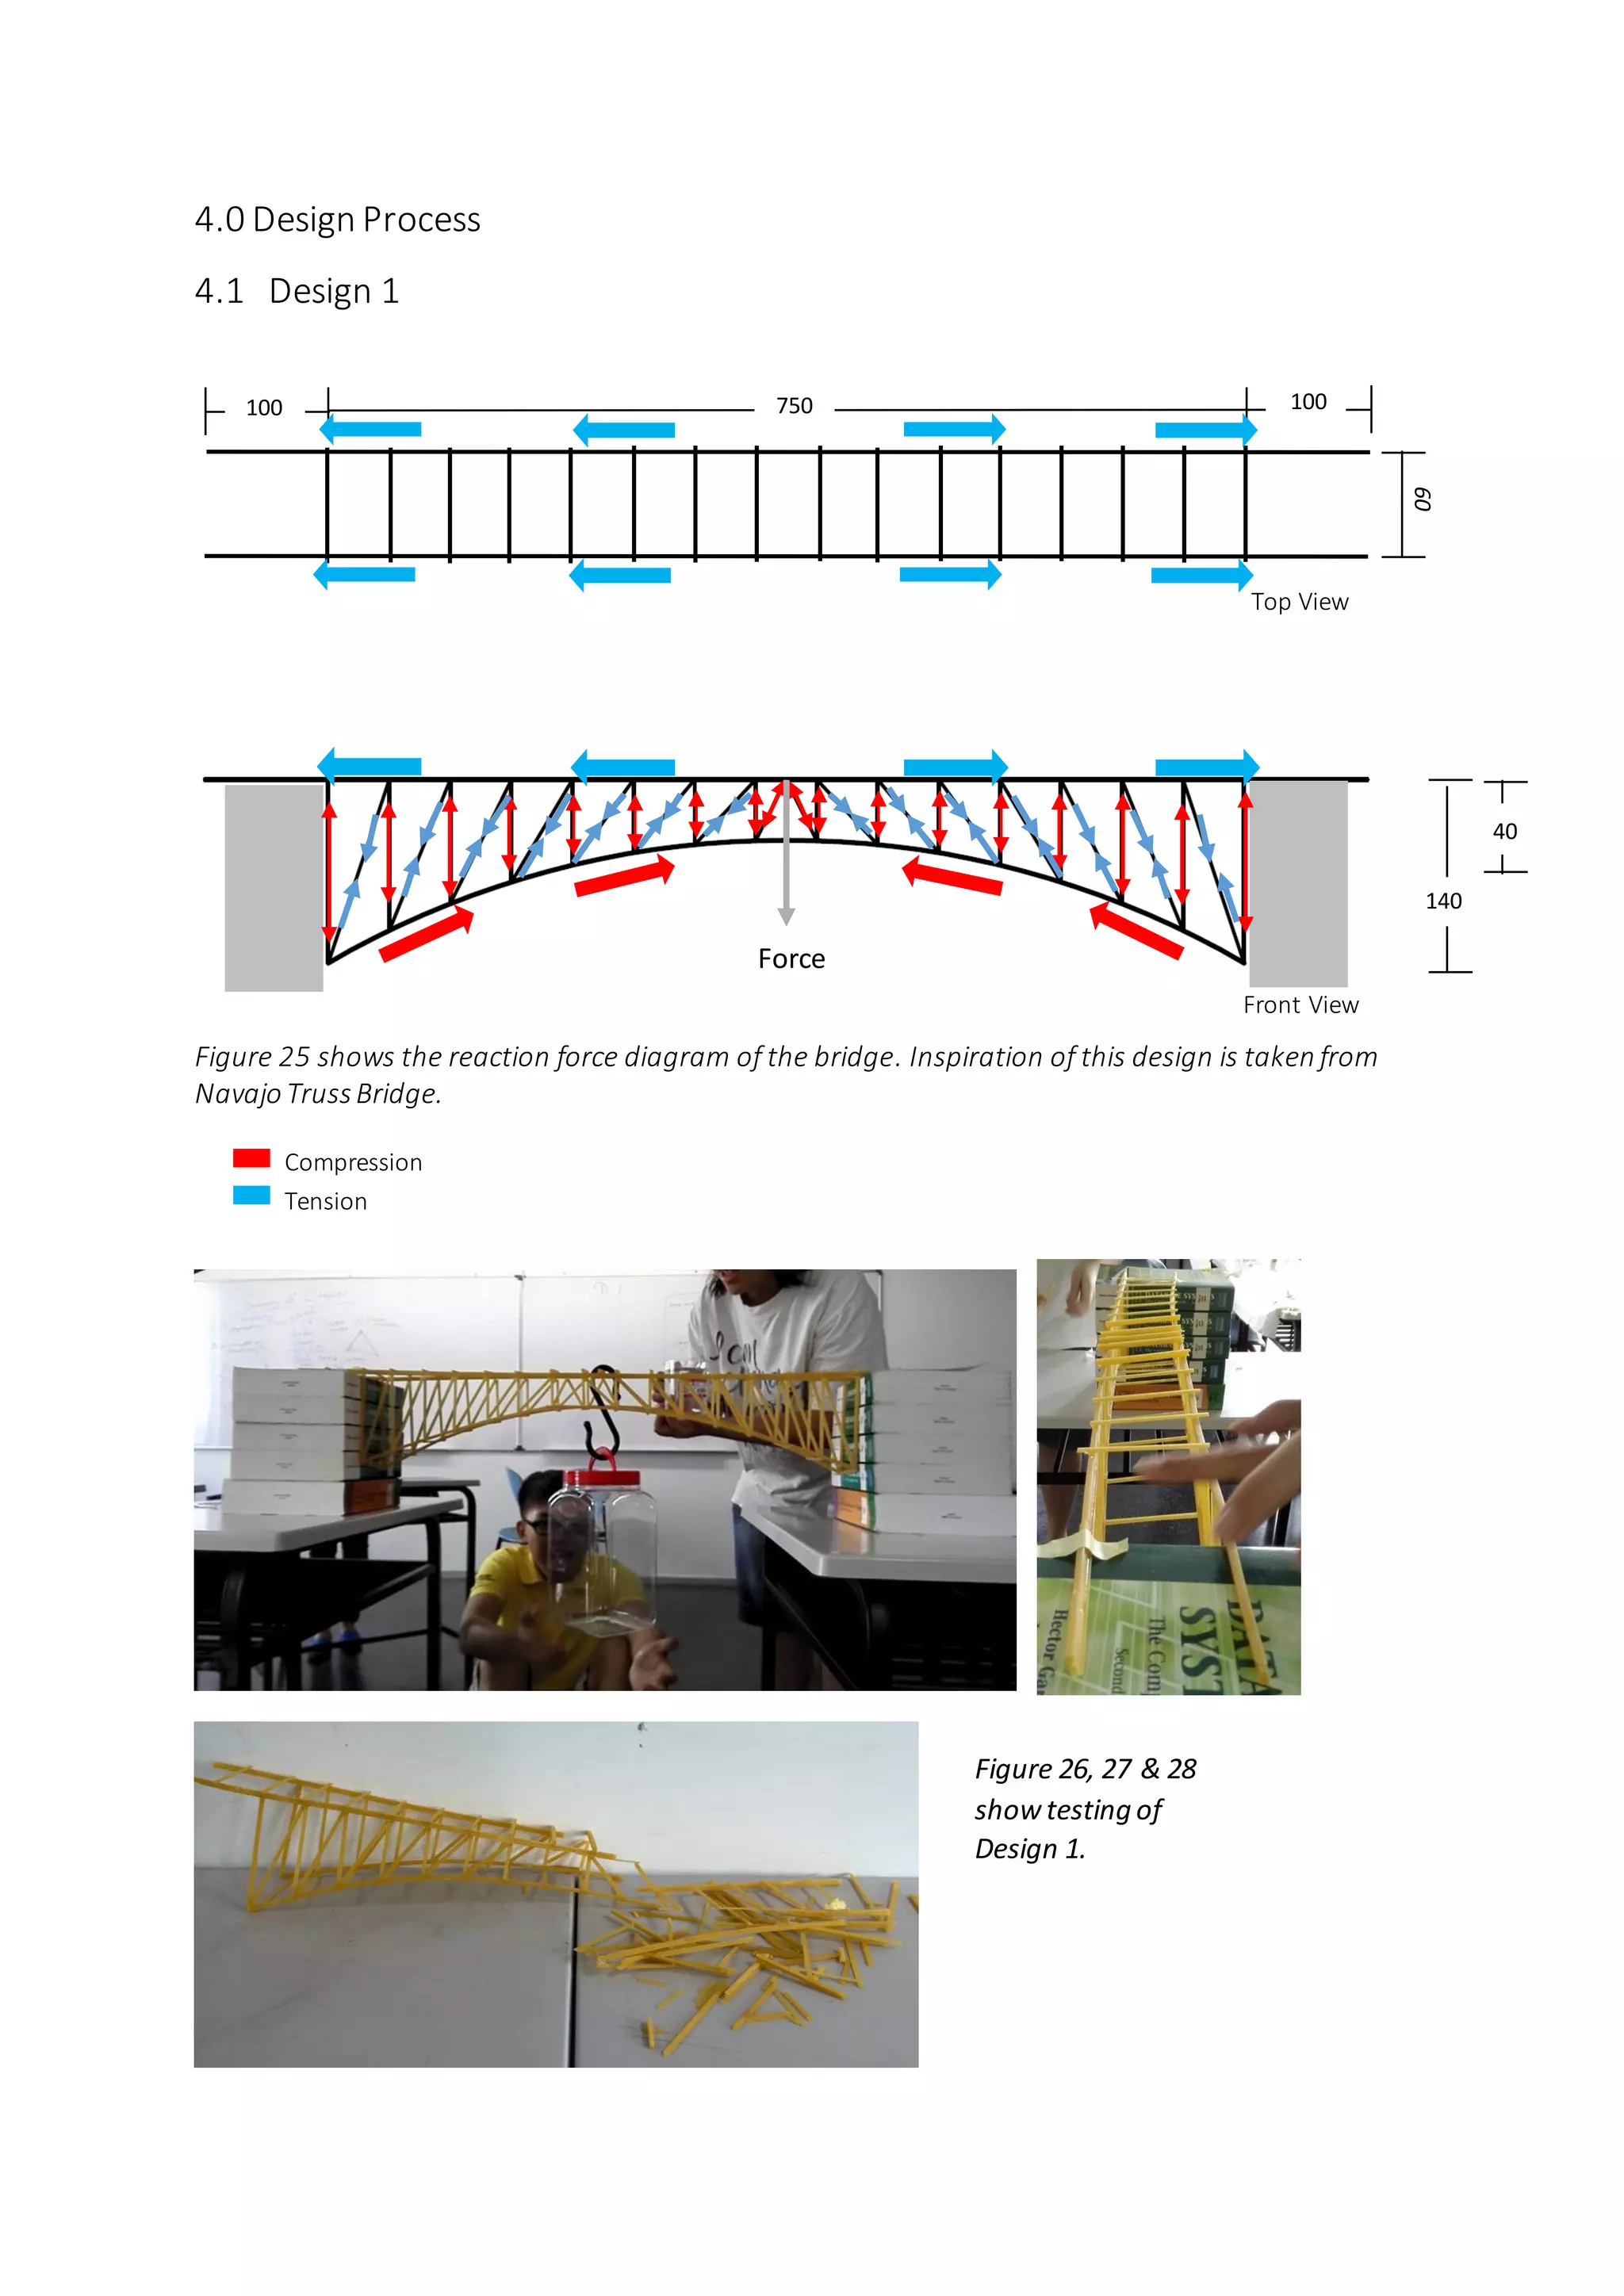
Figure 21 illustrates how surface condition influences strength of fettuccine.
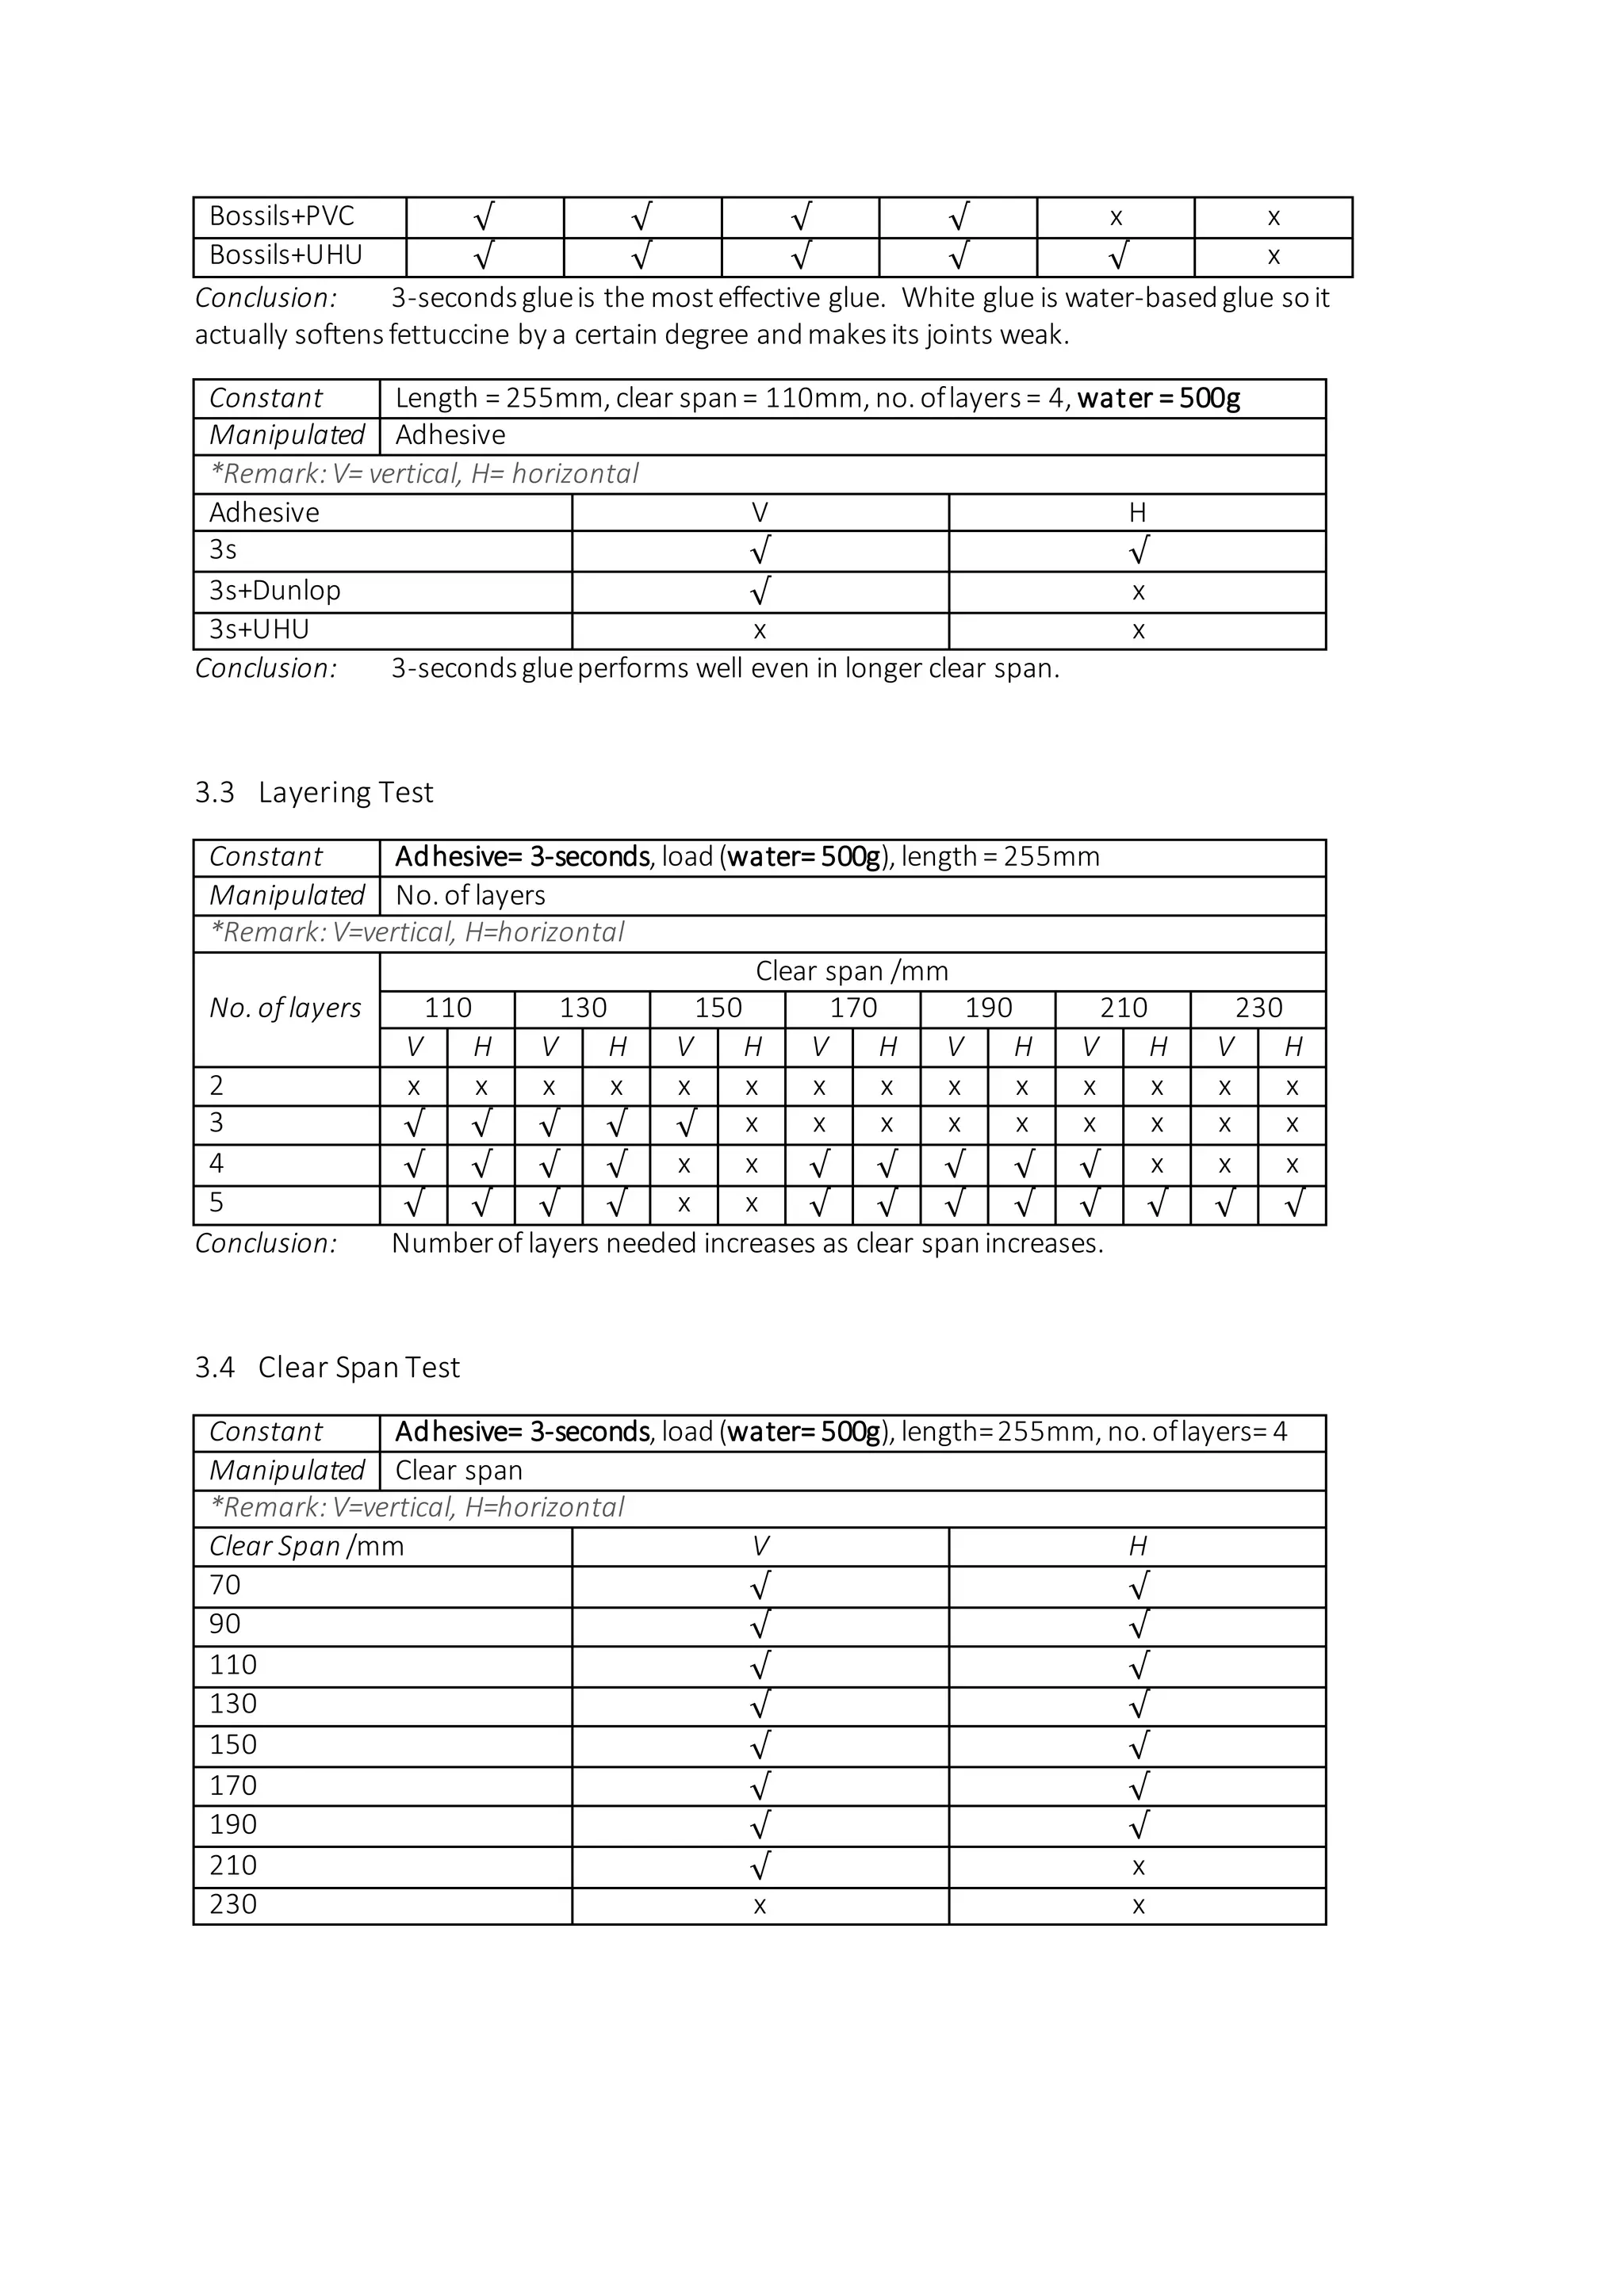
3.2 Adhesive Test
Figure 22 shows how test is being carried out.
Constant Length = 60mm, clear span= 40mm, no. of layers = 2
Manipulated Adhesive
Responding Ability to withstandthe load for 10 seconds
*Remark:V=vertical, H=horizontal, load [=water+150g (container+hook + thread)]
Adhesive
Water /g
300 800 1300
V H V H V H
3-seconds √ √ √ √ √ √
Bossils √ √ √ √ √ x
Dunlop √ √ √ x x x
PVC √ √ √ x x x
Super glue √ √ √ √ √ x
UHU √ √ √ x √ x
White glue √ √ √ x x x
3s+Dunlop √ √ √ √ √ x
3s+PVC √ √ √ √ √ x
3s+UHU √ √ √ √ √ x
Bossils+Dunlop √ √ √ √ √ x](https://image.slidesharecdn.com/carbonara-cd-completed-150711090119-lva1-app6892/75/Building-structure-project-1-Fettuccine-Truss-Bridge-12-2048.jpg)
![3.5 Joint test
Figure 23 shows three different typesof joint. They are commonly used
in timberconstruction and fettuccine comesin shapesimilar to timber. No
fixture is required for thesejoint thusdamageto fettuccineisavoided.
Figure 24 shows how test is being carried out using frame, strap with
chain and plastic bag filled with water. Water is weighed using electric
balance.
Constant Dimension offrame =50 x50 mm, no. oflayers =3, adhesive=3-seconds
Manipulated load [= water +80g(plastic bag + strap)]
Responding Ability to withstandthe load for 10 seconds
*Remark:fettuccineframe is tested vertically, load [= water+80g (plasticbag + strap)]
Joint
Load /g
500 1100 1500 2000 2400
Butt
√ X (2.60s) X X X
Lap
√ √ √ √ X (1.00s)
Mortiseand tenon
√ √ √ X (3.93s) X
Conclusion: Lap joint has less contact adhesive surface than mortise and tenon but it is the
strongest.
Butt Joint Lap Joint Mortise andTenon](https://image.slidesharecdn.com/carbonara-cd-completed-150711090119-lva1-app6892/75/Building-structure-project-1-Fettuccine-Truss-Bridge-14-2048.jpg)