Download to read offline
![International Journal of Data Mining & Knowledge Management Process (IJDKP) Vol.7, No.2, March 2017
DOI: 10.5121/ijdkp.2017.7204 51
BUILDING A CLASSIFIER EMPLOYING PRISM
ALGORITHM WITH FUZZY LOGIC
Ishrat Nahar Farhana, A.H.M. Sajedul Hoque , Rashed Mustafa and Mohammad
Sanaullah Chowdhury
Department of Computer Science and Engineering, University of Chittagong, Chittagong,
Bangladesh
ABSTRACT
Classification in data mining is receiving immense interest in recent times. As the knowledge is based on
historical data, classifications of data are essential for discovering the knowledge. To decrease the
classification complexity, the quantitative attributes of data need splitting. But the splitting using the
classical logic is less accurate. This can be overcome by the use of fuzzy logic. This paper illustrates how to
build up the classification rules using the fuzzy logic. The fuzzy classifier is built on by using the prism
decision tree algorithm. This classifier produces more realistic results than the classical one. The
effectiveness of this method is justified over a sample dataset.
KEYWORDS
Data Mining, Classification, Prism algorithm, Fuzzy logic , Membership Degree
1. INTRODUCTION
Data are big power for an organization to make better decisions. All knowledge of any
organization is hidden in its historical data. Data mining is the process of analyzing data from
different perspectives and summarizing it into useful information. We have a lot of raw data
around us which has no meaning or use until they are given into a form that is useful and familiar
to human. This helpful form is knowledge which can be derived from data and information. Thus
data mining is are necessary to discover that latent knowledge. Data mining has different
tasks.The primary data mining tasks are : Classification, Clustering, Regression, Summarization,
Dependency Modeling, Change and Deviation Detection [1]. Among those tasks, classification
assigns items in a collection to target classes and accurately predicts the target classes for each
case in the data [2] . Generally classification task generates a set of rules from training data set for
future prediction and decision tree is a widely used technique for that purpose. There are many
specific decision-tree algorithms, Prism algorithm is one of them. Prism algorithm is a rule based
algorithm that induces modular rules using ‘separate and conquer’ approach [3]. Training data set
may have both or either categorical or numerical attribute. For categorical attributes classification
model can be built easily. But if the data set has any numerical attribute, it should be converted
into categorical attribute by splitting the numeric range through classical logic or fuzzy logic.
Fuzzy logic refers to better performance due to the overestimation and under estimation problem](https://image.slidesharecdn.com/7217ijdkp04-170411103120/85/Building-a-Classifier-Employing-Prism-Algorithm-with-Fuzzy-Logic-1-320.jpg)
![International Journal of Data Mining & Knowledge Management Process (IJDKP) Vol.7, No.2, March 2017
DOI: 10.5121/ijdkp.2017.7204 51
BUILDING A CLASSIFIER EMPLOYING PRISM
ALGORITHM WITH FUZZY LOGIC
Ishrat Nahar Farhana, A.H.M. Sajedul Hoque , Rashed Mustafa and Mohammad
Sanaullah Chowdhury
Department of Computer Science and Engineering, University of Chittagong, Chittagong,
Bangladesh
ABSTRACT
Classification in data mining is receiving immense interest in recent times. As the knowledge is based on
historical data, classifications of data are essential for discovering the knowledge. To decrease the
classification complexity, the quantitative attributes of data need splitting. But the splitting using the
classical logic is less accurate. This can be overcome by the use of fuzzy logic. This paper illustrates how to
build up the classification rules using the fuzzy logic. The fuzzy classifier is built on by using the prism
decision tree algorithm. This classifier produces more realistic results than the classical one. The
effectiveness of this method is justified over a sample dataset.
KEYWORDS
Data Mining, Classification, Prism algorithm, Fuzzy logic , Membership Degree
1. INTRODUCTION
Data are big power for an organization to make better decisions. All knowledge of any
organization is hidden in its historical data. Data mining is the process of analyzing data from
different perspectives and summarizing it into useful information. We have a lot of raw data
around us which has no meaning or use until they are given into a form that is useful and familiar
to human. This helpful form is knowledge which can be derived from data and information. Thus
data mining is are necessary to discover that latent knowledge. Data mining has different
tasks.The primary data mining tasks are : Classification, Clustering, Regression, Summarization,
Dependency Modeling, Change and Deviation Detection [1]. Among those tasks, classification
assigns items in a collection to target classes and accurately predicts the target classes for each
case in the data [2] . Generally classification task generates a set of rules from training data set for
future prediction and decision tree is a widely used technique for that purpose. There are many
specific decision-tree algorithms, Prism algorithm is one of them. Prism algorithm is a rule based
algorithm that induces modular rules using ‘separate and conquer’ approach [3]. Training data set
may have both or either categorical or numerical attribute. For categorical attributes classification
model can be built easily. But if the data set has any numerical attribute, it should be converted
into categorical attribute by splitting the numeric range through classical logic or fuzzy logic.
Fuzzy logic refers to better performance due to the overestimation and under estimation problem](https://image.slidesharecdn.com/7217ijdkp04-170411103120/75/Building-a-Classifier-Employing-Prism-Algorithm-with-Fuzzy-Logic-1-2048.jpg)
![International Journal of Data Mining & Knowledge Management Process (IJDKP) Vol.7, No.2, March 2017
52
of classical logic which has been shown in this paper. Moreover, classical classifier assigns one
item in one and only one class, where fuzzy classifier supports multiple existence of one item
among different classes with some membership values. This paper describes the way of building
fuzzy classifier employing fuzzy logic on prism decision tree approach.
The rest of the paper is organized as follows. Section 2 provides a summary of related works.
Classification using prism algorithm is discussed in section 3. Section 4 illustrates classical Prism
algorithm. Generating rules using Fuzzy Prism classifier is presented in section 5. Section 6
illustrates the experimental result. Finally, section 7 concludes the paper.
2. RELATED WORK
The main objective of this research is to propose a new way of building classifiers using fuzzy
logic. We apply prism algorithm to classify training data set in fuzzy logic system. We focus on
building classifiers or rules using fuzzy logic which gives more accurate result than classical logic
system.
Some author proposed learning algorithm generates fuzzy rules from “soft” instances, which
differ from conventional instances in that they have class membership values [4].
On the other hand, some author proposed fuzzy decision tree induction method, which is based on
the reduction of classification ambiguity with fuzzy evidence [5]. Cognitive uncertainties
involved in classification problems are explicitly represented, measured, and incorporated into the
knowledge induction process according to them.
Methods of fuzzy k-means is used to overcome the problem of class overlap but their usefulness
maybe reduced when data sets are large and when the data include artefacts introduced by the
derivation of landform attributes from gridded digital elevation models. ‘High-resolution
landform classification using fuzzy k-means’ presents ways to overcome these limitations using
spatial sampling methods, statistical modelling of the derived stream topology, and fuzzy k-
means using the Distance metric [6].
Fuzzy decision trees represent classification knowledge more naturally to the way of human
thinking and are more robust in tolerating imprecise, conflict, and missing information.
3. CLASSIFICATION: A TASK OF DATA MINING
Data mining using classification goes through supervised learning approach where labelled
training data are used. The goal of classification is to accurately predict the target class for each
case in the data. Classification consists of two steps: building the classifier and using classifier
for classification [7]. Building the classifier phase trains the machine according to the given
classes in training data set. Then the second phase which is the testing phase tests the input data
from testing data set and put them into a class using classifier formed in first phase.
Different classification algorithms use different techniques for finding relationships. These
relationships are summarized in a model, which can then be applied to a different data set in
which the class assignments are unknown. Classification models are tested by comparing the
predicted values to known target values in a set of test data. Different techniques of data mining
are Decision Tree, Naive Bayes method, Support Vector Machine, Neural network, Kernel](https://image.slidesharecdn.com/7217ijdkp04-170411103120/85/Building-a-Classifier-Employing-Prism-Algorithm-with-Fuzzy-Logic-2-320.jpg)
![International Journal of Data Mining & Knowledge Management Process (IJDKP) Vol.7, No.2, March 2017
53
Estimation. Different algorithms are used to produce modular classification rules to construct
regular decision tree. A decision tree is a flowchart-like structure in which each internal node
represents a "test" on an attribute, each branch represents the outcome of the test and each leaf
node represents a class label where decision is taken after computing all attributes. The paths
from root to leaf represent classification rules. Prism algorithms generate modular classification
rules that cannot necessarily be represented in the form of a decision tree and provide higher
classification accuracy [3].
Classification can be classified into two categories: Classical Classification and Fuzzy
Classification. Training data set may have vagueness which makes confusion to classify. That is it
seems an item may belong to different classes with some percentage. In that scenario, fuzzy
classification is used where an item can be classified into more than one class with some
membership degree.
4. CLASSICAL PRISM ALGORITHM
There are two general approaches to the induction of classification rules, the ‘divide and conquer’
approach, also known as TDIDT and the ‘separate and conquer’ approach. ‘Divide and conquer’
induces classification rules in the intermediate representation of a decision tree. ‘Separate and
conquer’ induces a set of IF..THEN rules. However the most notable development using the
‘separate and conquer’ approach is the Prism family of algorithms [8].
The prism algorithm was introduced by Cendrowska in 1987. The aim is to induce modular
classification rules directly from the training set. The algorithm assumes that all the attributes are
categorical. When there are continuous attributes they can first be converted to categorical one.
Alternatively the algorithm can be extended to deal with continuous attributes.Prism uses the
‘take the first rule fires’ conflict resolution strategy when the resulting rules are applied to the
unseen data, so it is important that as far as possible the most important rules are generated first.
The algorithm generates the rules concluding each of the possible classes in turn. Each rule is
generated term by term with each term of the form ‘attribute = value ’. The attribute/value pair
added at each step is chosen to maximize the probability of the target ‘outcome class ’ [9]. The
basic Prism algorithm is shown in Algorithm 1 [9].
Algorithm 1 (Classical Prism Algorithm)
Input: A training dataset with n classes Ci , i = 1,2,3.......n
Output: Generated rules for all classes
Method: The rules are generated in the following steps:
1. For each class Ci start with the complete training set each time
2. Compute the probability of each attribute/value pair for the class, Ci
3. Select the pair with the largest probability and create a subset of the training set
comprising all the instances with the selected attribute/value combination for each class, Ci
4. Repeat steps 2 and 3 for this subset until a subset is reached that contain only instances of
Ci.
5. The rule is induced by the conjunction of all the attribute/value pairs selected.
6. Remove all instances covered by this rule from the training set.
7. Repeat step 2 through 6 until all instances of Ci have been removed
8. Go to step 1 until all classes are examined.](https://image.slidesharecdn.com/7217ijdkp04-170411103120/85/Building-a-Classifier-Employing-Prism-Algorithm-with-Fuzzy-Logic-3-320.jpg)
![International Journal of Data Mining & Knowledge Management Process (IJDKP) Vol.7, No.2, March 2017
55
5.1 Fuzzy Prism Algorithm
Fuzzy logic is the multi-valued logic in which truth values of variables may have any real number
between 0 and 1, where for classical logic it would be either 0 or 1 [10]. For example, Age =
{(young,1), (young, .5), (middle aged, .5), (middle age,1), (middle aged, .1), (old, .4), (old, .7),
(old,1)}, where every Cartesian product consists of linguistic variables and membership degree.
The cardinality of the fuzzy set is computed by summing all membership values. So the
cardinality of Age is (1+.5+.5+1+.1+.4+.7+1) or 5.2. Similarly |young|, |middle aged| and |old| are
1.5, 1.6 and 2.1 respectively. The probability in Fuzzy Prism algorithm is calculated using this
cardinality shown in equation (1).
)1()(
AoftyCardinaaliTotal
LoftyCardinaaliTotal
LP AL =∈
Here L is a fuzzy linguistic term and A is the set of all linguistic terms. For instance, the
probability of young using eq. 1 will be
29.0
2.5
5.1
)( ==∈ youngP Ageyoung
The modified prism algorithm using fuzzy logic is shown in Algorithm 2.
Algorithm 2 (Fuzzy Prism Algorithm)
Input: A training dataset with n classes , Ci ,i = 1,2,3.......n
Output: Fuzzy Classifier
Method: The rules are generated in the following steps:
1. Map the given training data set into the fuzzy training set by employing fuzzy login on
numeric attribute.
2. For each class Ci start with the complete training set
each time.
3. Compute the probability of each attribute/value pair using equation 1 for the class, Ci
4. Select the pair with the largest probability and create a subset of the training set
comprising all the instances with the selected attribute/value combination for each class, Ci
5. Repeat steps 3 and 4 for this subset until a subset contains only instances of Ci or covers
all the attributes.
6. The rule is induced by the conjunction of all the attribute/value pairs selected.
7. Remove all instances covered by this rule from the training set.
8. Repeat step 3 through 7 until all instances of Ci have been removed
9. Go to step 2 until all classes are examined.
5.2 Constructing Bins
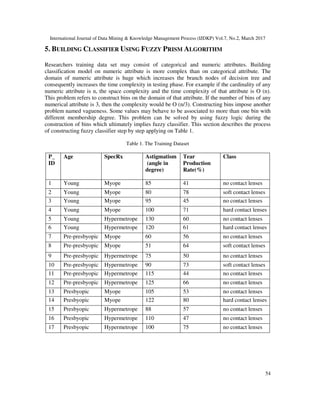
Due to the complexity of constructing decision tree on quantitative attributes: Astigmatism and
Tear Production Rate, these attributes must be split using either classical logic or fuzzy logic. The
constructed bins for Astigmatism is {Yes, No} and Tear Production Rate are is {Reduced,
Normal}. The range for Astigmatism is from 51 to 130 and for Tear Production Rate is from 41
to 80. If the intervals for Yes and No bins are from 51 to 90 and from 91 to 130, according to the](https://image.slidesharecdn.com/7217ijdkp04-170411103120/85/Building-a-Classifier-Employing-Prism-Algorithm-with-Fuzzy-Logic-5-320.jpg)
![International Journal of Data Mining & Knowledge Management Process (IJDKP) Vol.7, No.2, March 2017
56
classical logic each value under same interval has the same membership value that means either 0
or 1. For example, the membership degrees of 52 under Yes and No is 1 and 0 respectively.
Again for 92 it is vice versa. Here though the difference between 52 and 91 is 39, 52 and 91 both
belong to Yes. On the other hand, in spite of being 92 very closer to 91, it is associated to other
interval No. These are known as overestimation and underestimation problem in classical logic.
In order to remove these problems, fuzzy logic is applied. It needs to construct bins. This paper
addresses S-shaped membership function for No and Reduced and Z-shaped membership
function for Yes and Normal, which are shown in Figure 1.
Figure 1. S-shaped and Z-shaped membership function for No/Reduced and Yes/Normal
The mathematical equations for S and Z-shaped membership functions are also shown in (2) and
(3) respectively [11].
)2(cos
2
1
2
1
)( Π
−
−
+=
lbhb
xhb
xf S
)3(cos
2
1
2
1
)( Π
−
−
+=
lbhb
lbx
xf z
The classes are considered as:
Hard contact lens- Class 1(C1),
Soft contact lens- Class 2 (C2)
No contact lens- Class 3(C3).
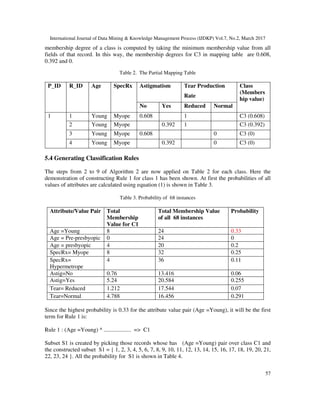
5.3 Constructing Mapping Table
Using equation (2) and equation (3) on astigmatism and tear production the mapping Table 2 has
been constructed. Though astigmatism and tear production rate both have 2 intervals each, the
mapping table get 4 pairs for each data or each patient. Thus the total dataset of Table 1 which
holds 17 patient’s data is converted to the mapping table which holds 68 records, 4 instances for
each patient. Here the mapping table with 4 mapped records is shown partially in Table 2. The
Yes/NormalNo/Reduced
Min Max](https://image.slidesharecdn.com/7217ijdkp04-170411103120/85/Building-a-Classifier-Employing-Prism-Algorithm-with-Fuzzy-Logic-6-320.jpg)
![International Journal of Data Mining & Knowledge Management Process (IJDKP) Vol.7, No.2, March 2017
61
7. CONCLUSION
In classical prism classifier, every rule belongs to one class only that means a rule either belongs
C1 or C2 or C3. So the classical result is not fully accurate. Because in real world, a single rule
cannot contain 100% characteristics of the features of a class. So it is not realistic. Because of
overestimation and underestimation problem testing data or patient (according to this paper)
contains some features of other classes but gives only one class as output, though it belongs more
than one class.
In this paper, Fuzzy classifier has been built using Prism algorithm successfully. It shows that a
single rule can contain more than one class with individual membership degree. So it gives more
accurate result than classical classification. It gives more realistic result than classical
classification by overcoming overestimation and underestimation problems of classical
classification. This fuzzy classifier has big application in industry. For example, bank authority
wants to give some incentive to the customers by classifying them into very committed,
committed and non committed customer. Some customer’s behavior is very confusing. Authority
cannot classify them in one class. It seems to the authority that those customers belong to
multiple classes with different percentage. In this circumstance, fuzzy classification is perfect.
The total calculation discussed in this paper has some difficulties. Fuzzy Prism classifier needs
huge calculation which increases time and space complexity. One can extend this work on Big
Data by inventing parallel algorithm on distributed computing platform such as hadoop or spark.
REFERENCES
[1] Fayyad, Piatetsky-Shapiro, Smyth , (1996) , “From Data Mining to Knowledge Discovery in
Databases”. AI Magazine.
[2] Bea Jiawei Han, Micheline Kamber and Jian Pei, (2012) , Data Mining Concepts and Techniques ,
3rd edition , Morgan Kaufmann, Waltham, USA .
[3] Frederic Stahl and Max Bramer, (2013) “Random Prism: A noise tolerant Alternative to Random
Forests ” , Expert Systems, Vol. 31, Issue 5, pp .411-420.
[4] Ching-Hung Wang , Jau-Fu Liu , Tzung-Pei Hong and Shian-Shyong , (1999) “A fuzzy inductive
learning strategy for modular rules”, Elsevier Science B.V. , Fuzzy Sets and Systems , Vol. 103,
Issue 1, pp 91-105.
[5] Yufei Yuan and Michael J. Shaw , (1995) , “Induction of fuzzy decision trees”, Elsevier Science
B.V. , Fuzzy Sets and Systems , Vol. 69, Issue 2, pp 125-139.
[6] P.A. Burrough, F.M. van Gaans, R.A. MacMillan , (2000), “High-resolution landform classification
using fuzzy k-means”, Elsevier Science B.V. , Fuzzy Sets and Systems , Vol. 113, Issue 1, pp 37-52.
[7] Data Mining-Classification & Prediction, Tutorials Point, [online],
http://www.tutorialspoint.com/data_mining/dm_classification_prediction.html(Accessed 27 February,
2017 ) .
[8] Frederic Stahl and Max Bramer , (2011), “Random Prism: An Alternative to Random Forests ” ,
Research and Development in Intelligent Systems XXVIII , Springer.](https://image.slidesharecdn.com/7217ijdkp04-170411103120/85/Building-a-Classifier-Employing-Prism-Algorithm-with-Fuzzy-Logic-11-320.jpg)
![International Journal of Data Mining & Knowledge Management Process (IJDKP) Vol.7, No.2, March 2017
62
[9] Max Bramer ,(2001), Principles of Data Mining , Springer, Berlin, Germany.
[10] Claudio Moraga , (2005), “Introduction to Fuzzy Logic”, Facta Universitatis, Series: Electronics and
Energetics, vol. 18, pp. 319-328 .
[11] Tassnim Manami Zaman, A. H. M. Sajedul Hoque, Md. Al-Amin Bhuiyan,(2011) “Knowledge
Discovery and Intelligent Query Employing Fuzzy Logic”, in Proc. ICMCS , Chennai, India..](https://image.slidesharecdn.com/7217ijdkp04-170411103120/85/Building-a-Classifier-Employing-Prism-Algorithm-with-Fuzzy-Logic-12-320.jpg)

The document discusses the development of a fuzzy classifier using the Prism algorithm to improve classification accuracy in data mining. It highlights the transition from classical logic to fuzzy logic, emphasizing the ability of fuzzy logic to handle uncertainties by allowing items to belong to multiple classes with varying membership degrees. The paper provides a detailed methodology for constructing the fuzzy classifier and demonstrates its efficacy through experiments on a sample dataset.