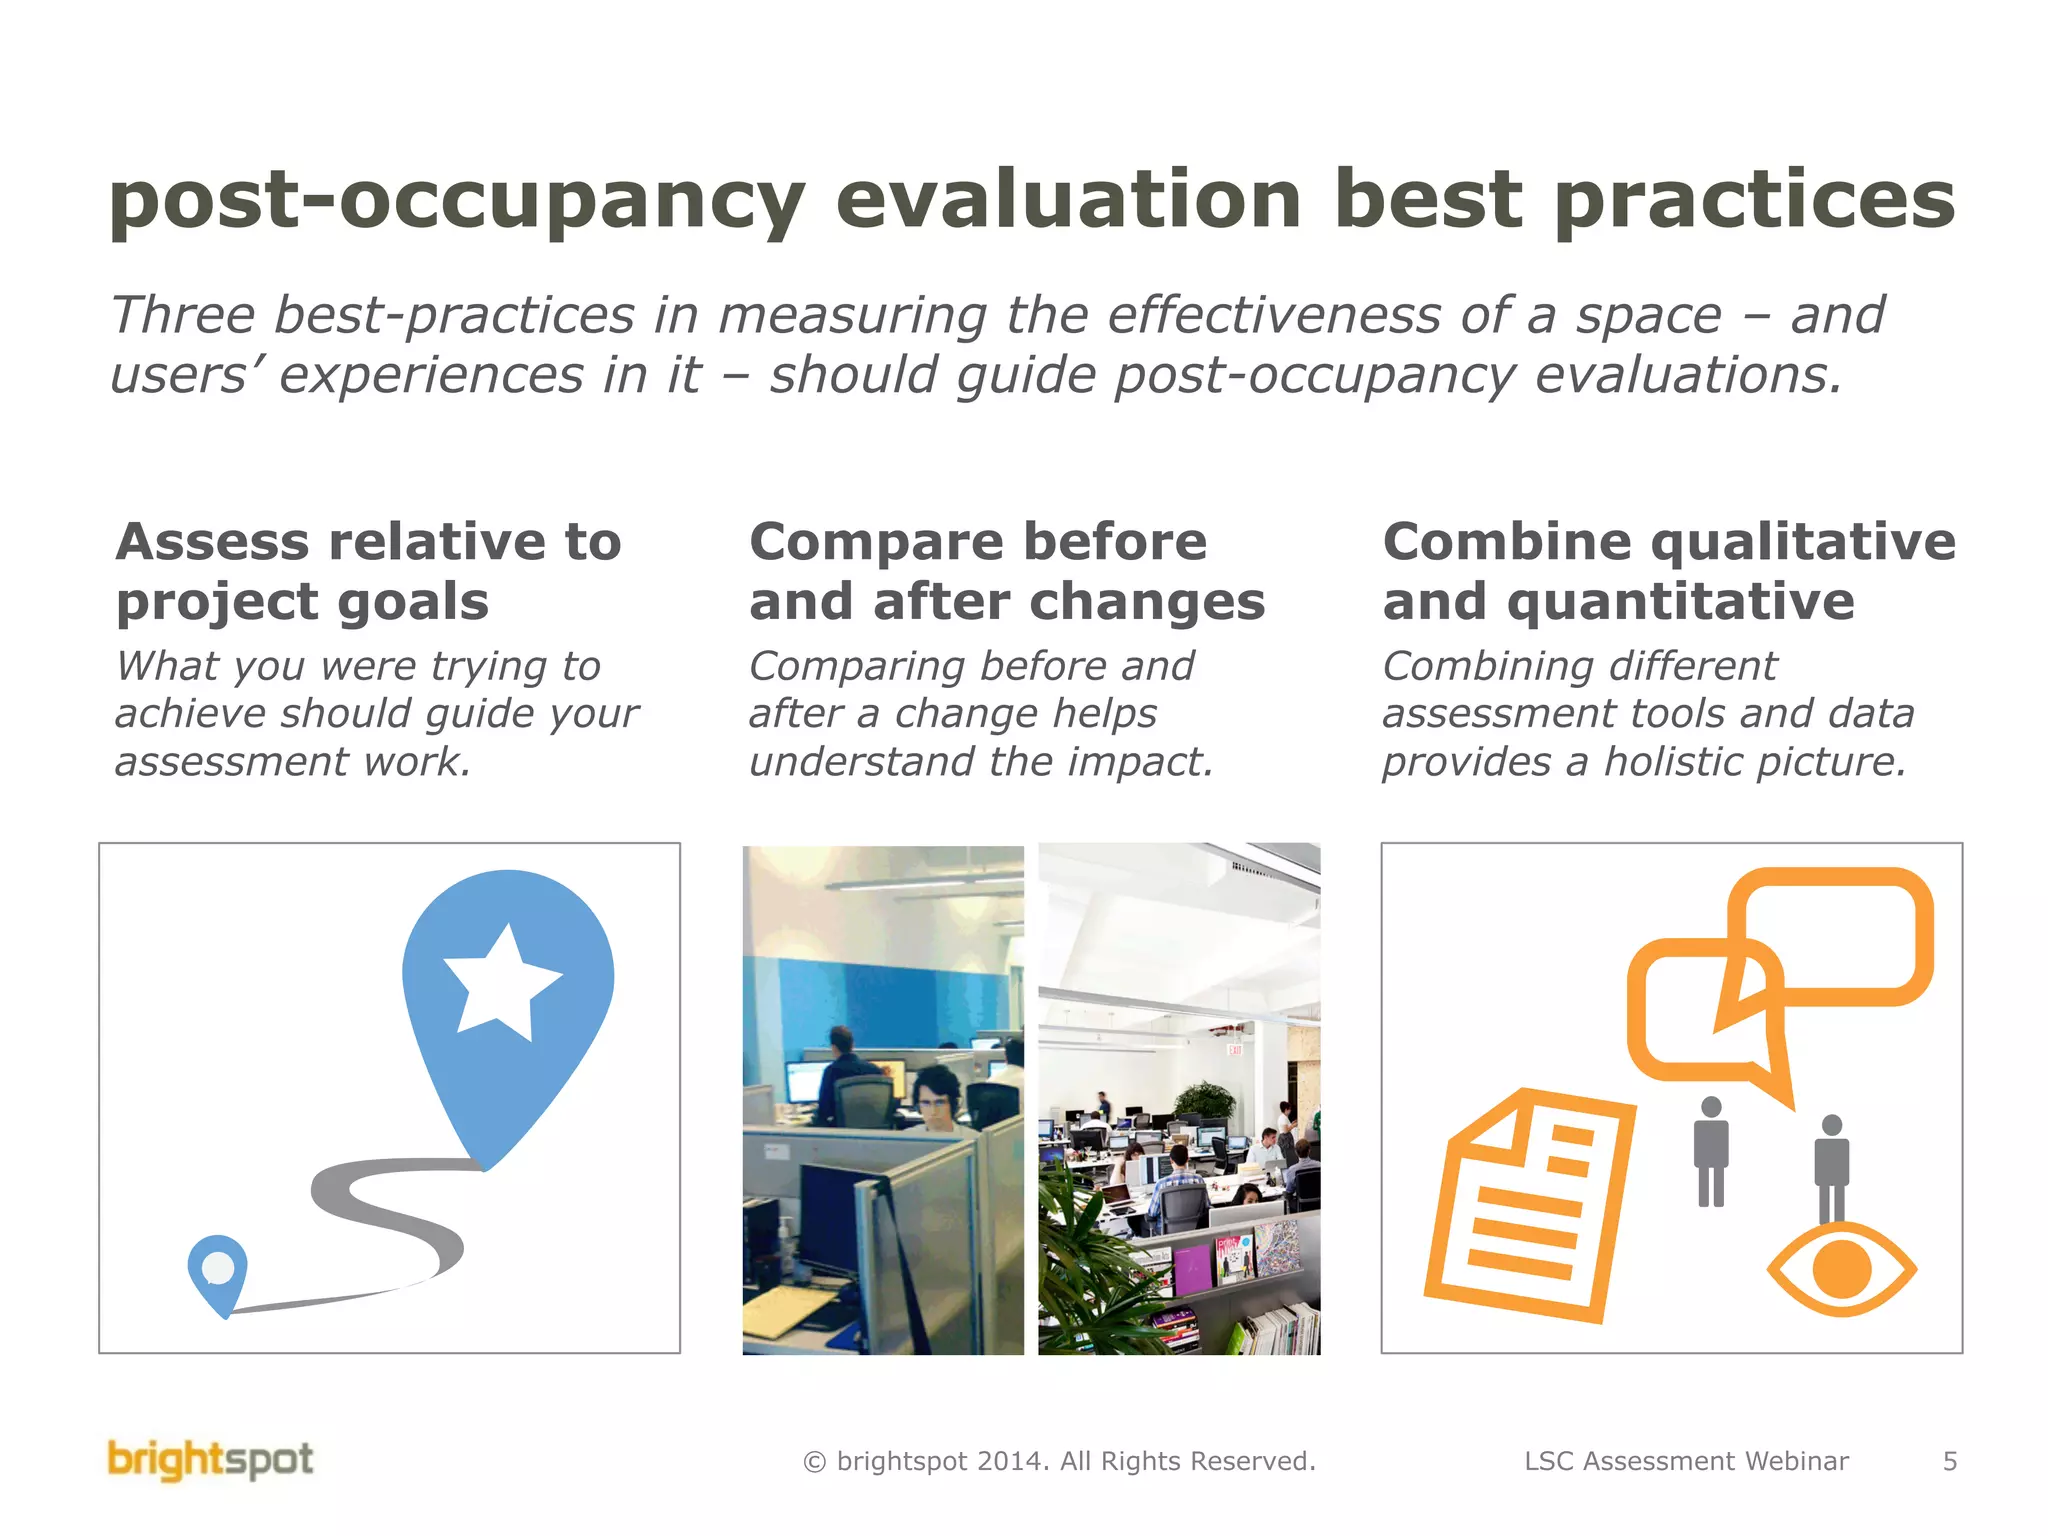
LSC Assessment Webinar 1© brightspot 2014. All Rights Reserved.
What is a Post-occupancy Evaluation?
November 2014
PKAL
LSC Assessment Webinar 2© brightspot 2014. All Rights Reserved.
what is a post-occupancy evaluation?
A post-occupancy evaluation measures the success of a space in
achieving goals and supporting specific activities, combining
quantitative and qualitative data drawn from surveys, interviews,
observations, workshops, and mining other sources of data.
.
LSC Assessment Webinar 3© brightspot 2014. All Rights Reserved.
why do post-occupancy evaluations?
Post-occupancy evaluations can help you measure success, better
communicate results, build momentum, and enable a culture of
evidence-based design and continuous improvement.
continuous
improvement
evidence-
based design
and decisions
better storytelling
building
momentum
measuring success
LSC Assessment Webinar 4© brightspot 2014. All Rights Reserved.
types of post-occupancy data
There are tiers of data used for assessment, with increasing value. But
the difficulty of data gathering / analysis also increases as you move up.
Utilization
Measuring how much a
service is used, with usage
as a proxy for value
Satisfaction
Measuring how satisfied
users and staff are with a
service or aspects of it
Impact
Measuring what the
service enabled users to
be able to do as a result
Examples: Logins, Gate counts,
Item checkouts, Logging
questions / tickets
Examples: Surveys (e.g.:
LibQUAL+), interviews,
observations, diaries
Examples: Value-added
analysis, engagement
More valuable
More difficult
LSC Assessment Webinar 5© brightspot 2014. All Rights Reserved.
post-occupancy evaluation best practices
Three best-practices in measuring the effectiveness of a space – and
users’ experiences in it – should guide post-occupancy evaluations.
Assess relative to
project goals
What you were trying to
achieve should guide your
assessment work.
Compare before
and after changes
Comparing before and
after a change helps
understand the impact.
Combine qualitative
and quantitative
Combining different
assessment tools and data
provides a holistic picture.
LSC Assessment Webinar 6© brightspot 2014. All Rights Reserved.
assess relative to goals
The goals you were trying to achieve should guide the assessment.
Users can be asked whether the environments is helping or hindering
the pursuit of these goals.
% respondents who think the workplace force, encourages, or enables the following 8 activities:
% positive response
Activity Forces Encourages Enables
Total %
positive
Change
from
pre-
Help someone else learn new skills 0% 77% 23% 100% +36%
Be recognized or rewarded 0% 23% 77% 100% +29%
Interact informally with colleagues 23% 69% 8% 100% +21%
Express your ideas 0% 62% 38% 100% +21%
Get and give feedback 8% 62% 31% 100% +15%
Have time to think 0% 23% 46% 70% +13%
Learn new skills and knowledge 15% 38% 38% 92% +6%
LSC Assessment Webinar 7© brightspot 2014. All Rights Reserved.
compare before and after
Comparing pre- and post-occupancy data can identify impacts that
are related to changes in the environment and organization.
The bars represent % change; change values are at the ends of the bars, units are stated in each bar label
-100% -80% -60% -40% -20% 0% 20%
Technology issues (hrs/wk)
Distractions (hrs/wk)
Meeting problems (hrs/wk)
Locating a colleague (hrs/wk)
Looking for / booking meeting room (hrs/wk)
Travelling between buildings for meetings (hrs/wk)
Getting feedback from peers (hrs)
Getting feedback from manager (hrs) .86
.89
.74
.52
.48
.57
2.45
1.17
% decrease# of hrs
LSC Assessment Webinar 8© brightspot 2014. All Rights Reserved.
combine qualitative and quantitative
To get a holistic picture of what’s working and what isn’t, you need to
combine different assessment methods and use them to validate each
other and uncover further questions and insights.
To solve a work question with
colleagues, the first thing I’ll
do is look around and see if
they’re on the floor.” -
interviewee
% respondents who are satisfied or very satisfied
Environmental comfort Pre- Post- Change
Natural light 37% 100% +63%
Temperature and air
quality
48% 85% +37%
Ergonomics and comfort 42% 79% +37%
Tools Pre- Post- Change
Furniture and equipment 26% 79% +53%
Technology 42% 78% +36%
Social environment Pre- Post- Change
Access to colleagues 79% 100% +21%
Sense of community 64% 93% +29%
Awareness of others 63% 86% +23%
LSC Assessment Webinar 9© brightspot 2014. All Rights Reserved.
tips for getting started
Here are some tips for getting started with post-occupancy
evaluations:
1.  Whenever possible, get baseline
data from before the change
2.  Work with experts on your campus,
such as your Office of Institutional
Assessment / Research
3.  Have a neutral party conduct the
analysis so you get honest
feedback from users and un-biased
analysis
4.  Report back to occupants to review,
validate, and act on findings, either
for that space or to inform
subsequent projects

brightspot Post-Occupancy Evaluation Webinar

  • 1.
    LSC Assessment Webinar1© brightspot 2014. All Rights Reserved. What is a Post-occupancy Evaluation? November 2014 PKAL
  • 2.
    LSC Assessment Webinar2© brightspot 2014. All Rights Reserved. what is a post-occupancy evaluation? A post-occupancy evaluation measures the success of a space in achieving goals and supporting specific activities, combining quantitative and qualitative data drawn from surveys, interviews, observations, workshops, and mining other sources of data. .
  • 3.
    LSC Assessment Webinar3© brightspot 2014. All Rights Reserved. why do post-occupancy evaluations? Post-occupancy evaluations can help you measure success, better communicate results, build momentum, and enable a culture of evidence-based design and continuous improvement. continuous improvement evidence- based design and decisions better storytelling building momentum measuring success
  • 4.
    LSC Assessment Webinar4© brightspot 2014. All Rights Reserved. types of post-occupancy data There are tiers of data used for assessment, with increasing value. But the difficulty of data gathering / analysis also increases as you move up. Utilization Measuring how much a service is used, with usage as a proxy for value Satisfaction Measuring how satisfied users and staff are with a service or aspects of it Impact Measuring what the service enabled users to be able to do as a result Examples: Logins, Gate counts, Item checkouts, Logging questions / tickets Examples: Surveys (e.g.: LibQUAL+), interviews, observations, diaries Examples: Value-added analysis, engagement More valuable More difficult
  • 5.
    LSC Assessment Webinar5© brightspot 2014. All Rights Reserved. post-occupancy evaluation best practices Three best-practices in measuring the effectiveness of a space – and users’ experiences in it – should guide post-occupancy evaluations. Assess relative to project goals What you were trying to achieve should guide your assessment work. Compare before and after changes Comparing before and after a change helps understand the impact. Combine qualitative and quantitative Combining different assessment tools and data provides a holistic picture.
  • 6.
    LSC Assessment Webinar6© brightspot 2014. All Rights Reserved. assess relative to goals The goals you were trying to achieve should guide the assessment. Users can be asked whether the environments is helping or hindering the pursuit of these goals. % respondents who think the workplace force, encourages, or enables the following 8 activities: % positive response Activity Forces Encourages Enables Total % positive Change from pre- Help someone else learn new skills 0% 77% 23% 100% +36% Be recognized or rewarded 0% 23% 77% 100% +29% Interact informally with colleagues 23% 69% 8% 100% +21% Express your ideas 0% 62% 38% 100% +21% Get and give feedback 8% 62% 31% 100% +15% Have time to think 0% 23% 46% 70% +13% Learn new skills and knowledge 15% 38% 38% 92% +6%
  • 7.
    LSC Assessment Webinar7© brightspot 2014. All Rights Reserved. compare before and after Comparing pre- and post-occupancy data can identify impacts that are related to changes in the environment and organization. The bars represent % change; change values are at the ends of the bars, units are stated in each bar label -100% -80% -60% -40% -20% 0% 20% Technology issues (hrs/wk) Distractions (hrs/wk) Meeting problems (hrs/wk) Locating a colleague (hrs/wk) Looking for / booking meeting room (hrs/wk) Travelling between buildings for meetings (hrs/wk) Getting feedback from peers (hrs) Getting feedback from manager (hrs) .86 .89 .74 .52 .48 .57 2.45 1.17 % decrease# of hrs
  • 8.
    LSC Assessment Webinar8© brightspot 2014. All Rights Reserved. combine qualitative and quantitative To get a holistic picture of what’s working and what isn’t, you need to combine different assessment methods and use them to validate each other and uncover further questions and insights. To solve a work question with colleagues, the first thing I’ll do is look around and see if they’re on the floor.” - interviewee % respondents who are satisfied or very satisfied Environmental comfort Pre- Post- Change Natural light 37% 100% +63% Temperature and air quality 48% 85% +37% Ergonomics and comfort 42% 79% +37% Tools Pre- Post- Change Furniture and equipment 26% 79% +53% Technology 42% 78% +36% Social environment Pre- Post- Change Access to colleagues 79% 100% +21% Sense of community 64% 93% +29% Awareness of others 63% 86% +23%
  • 9.
    LSC Assessment Webinar9© brightspot 2014. All Rights Reserved. tips for getting started Here are some tips for getting started with post-occupancy evaluations: 1.  Whenever possible, get baseline data from before the change 2.  Work with experts on your campus, such as your Office of Institutional Assessment / Research 3.  Have a neutral party conduct the analysis so you get honest feedback from users and un-biased analysis 4.  Report back to occupants to review, validate, and act on findings, either for that space or to inform subsequent projects