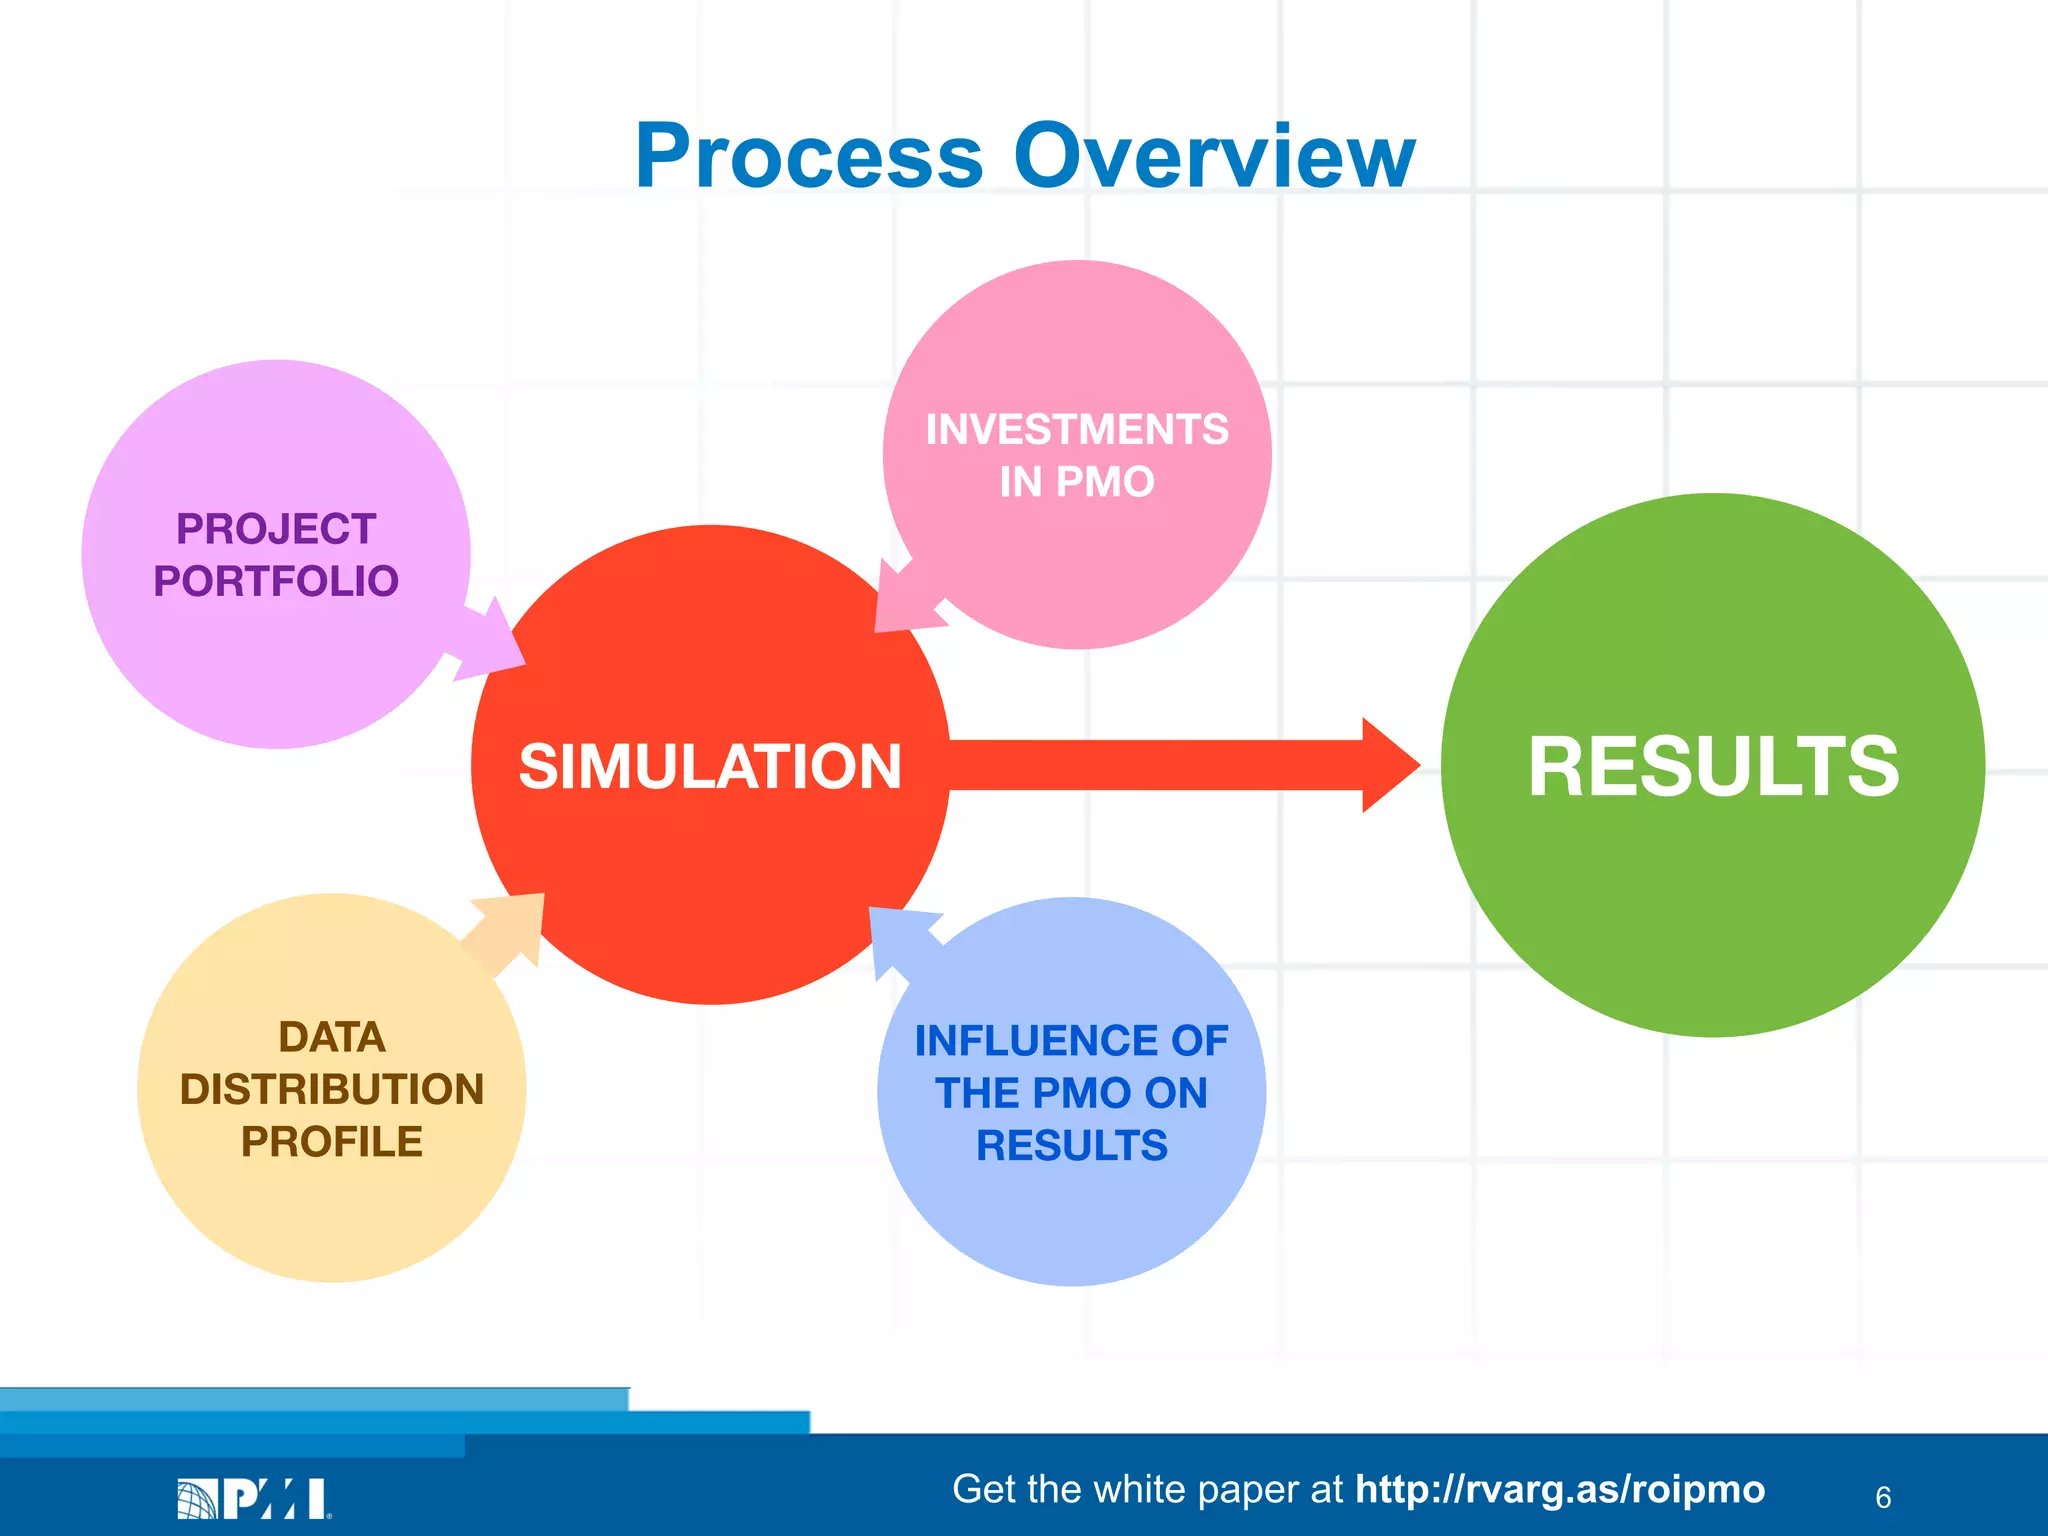
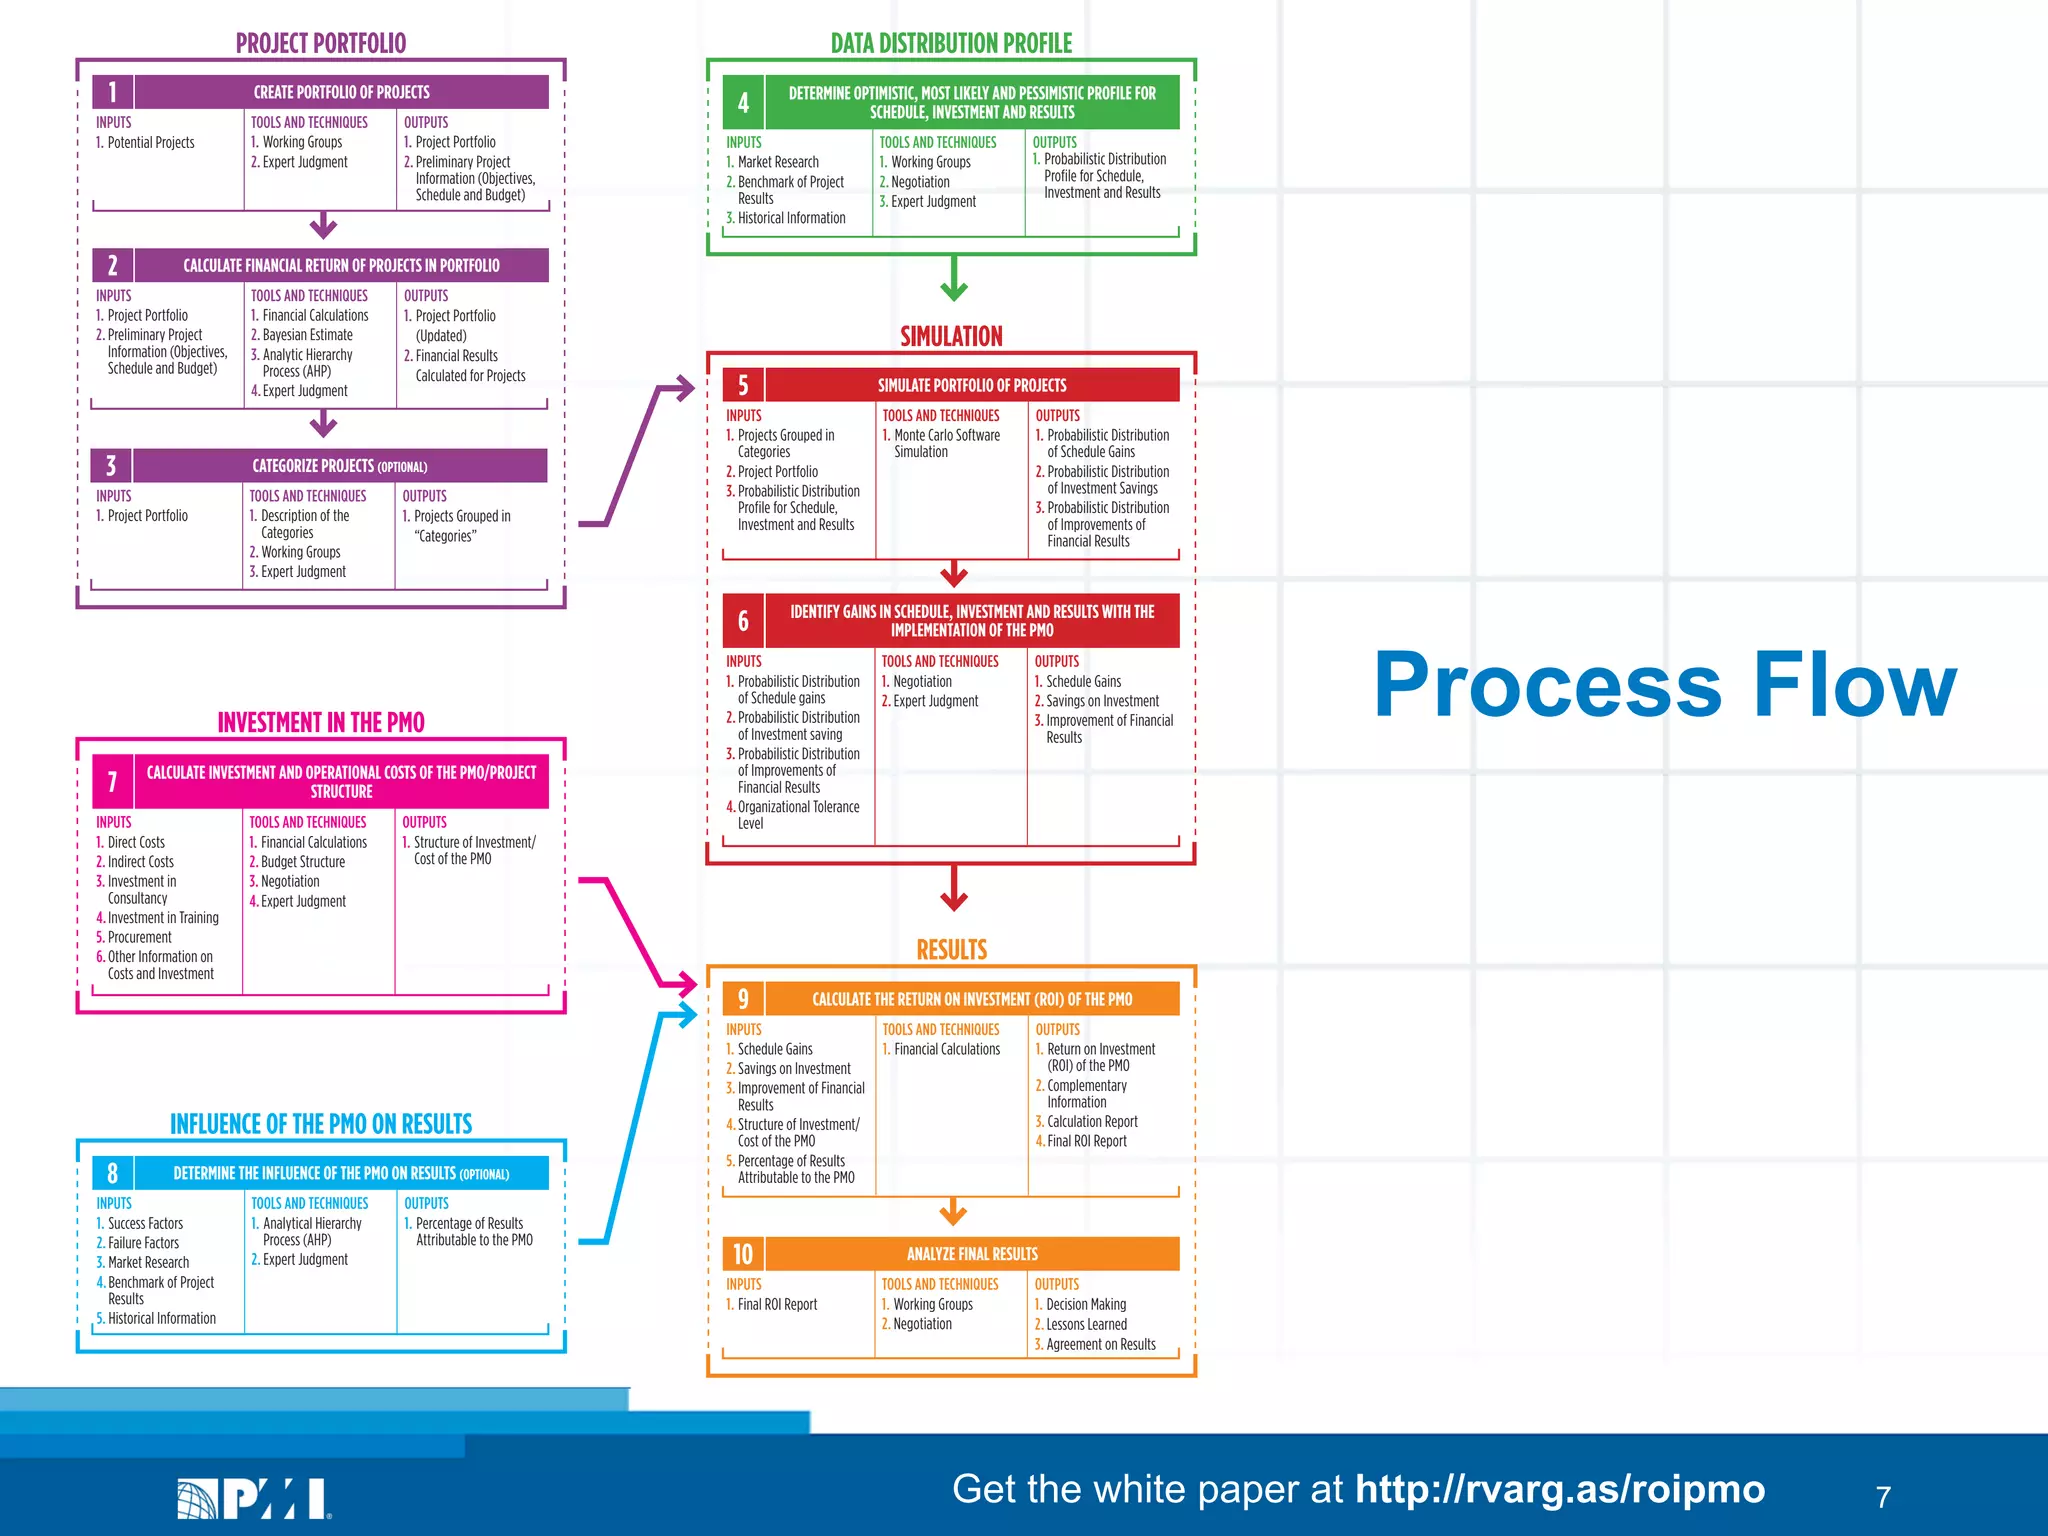
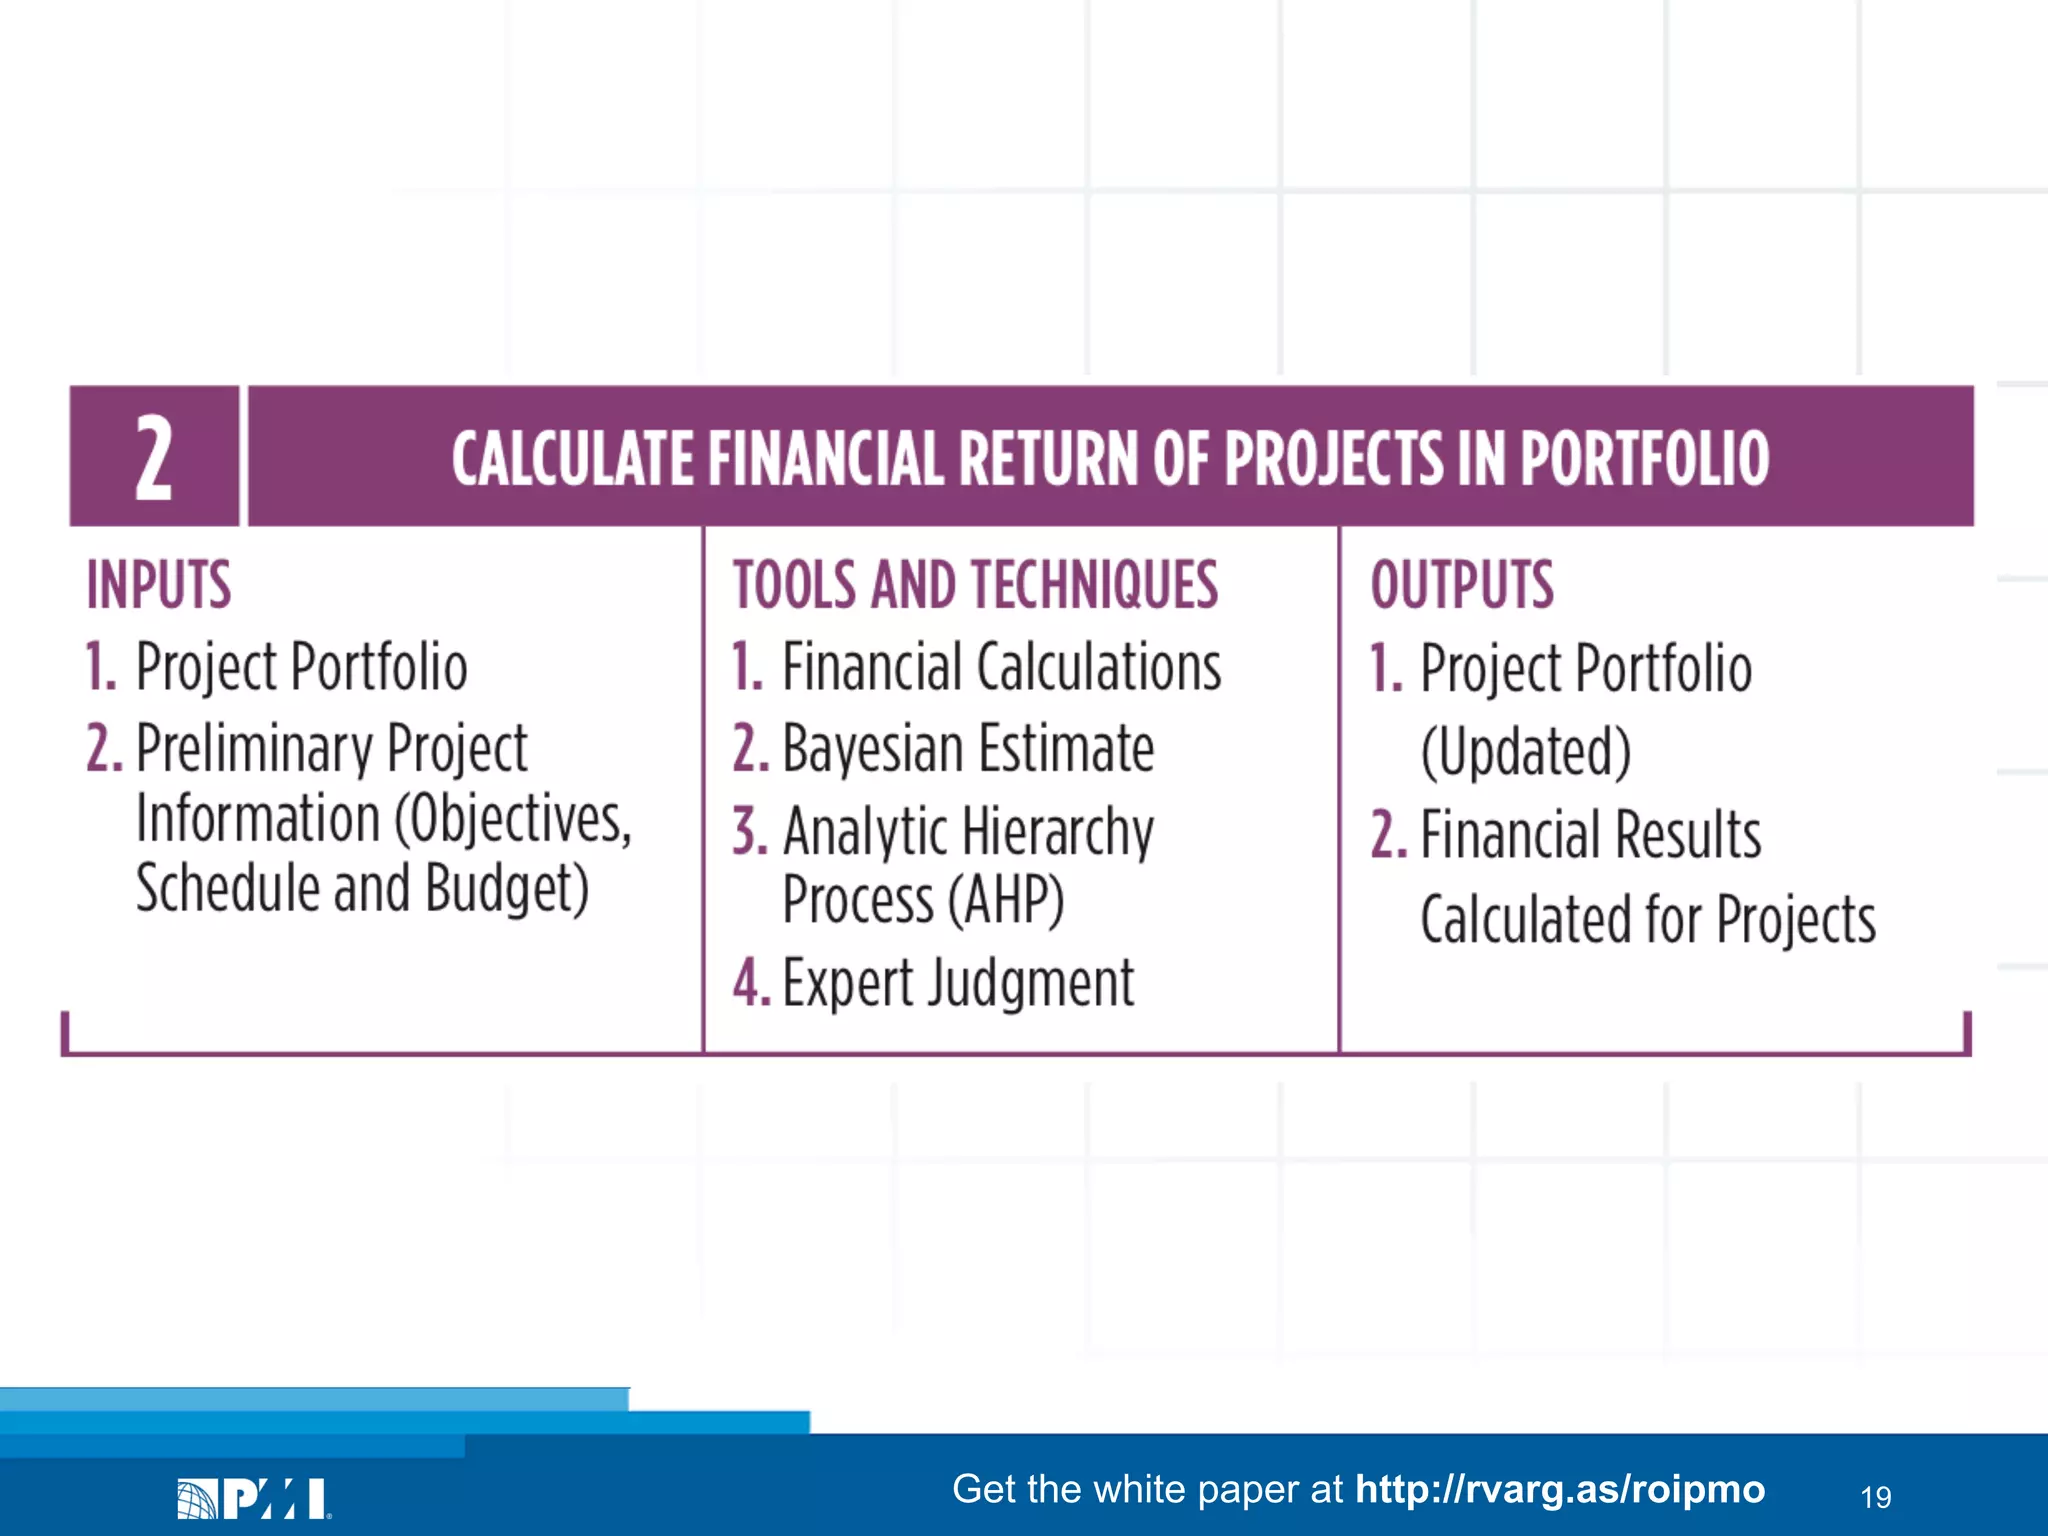
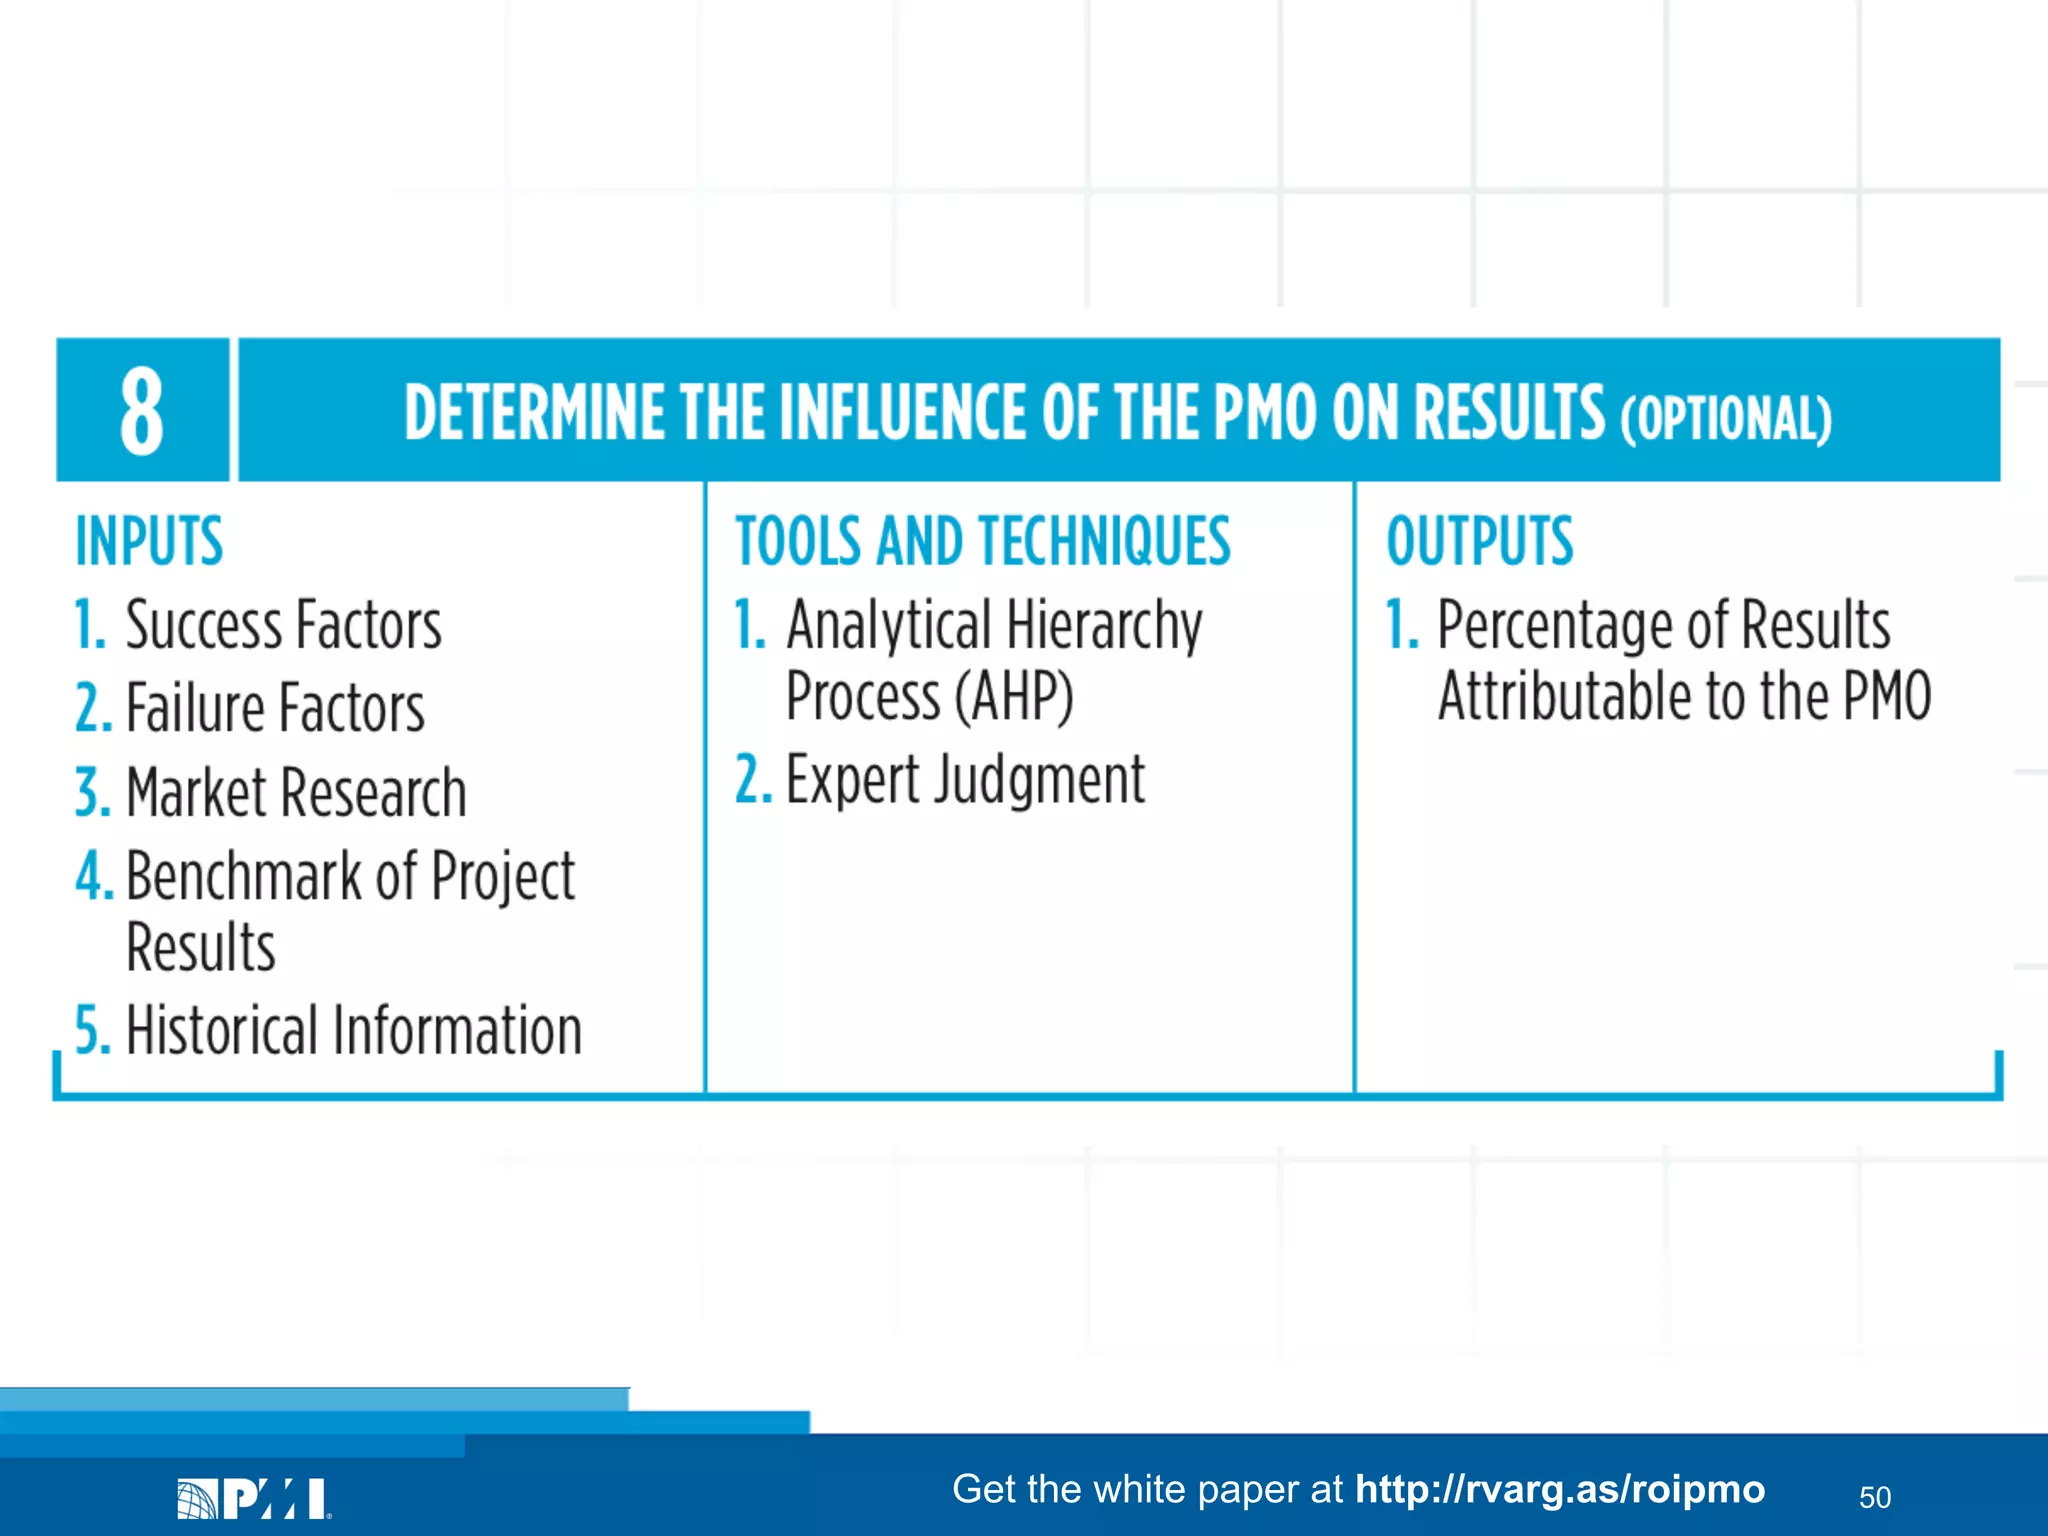
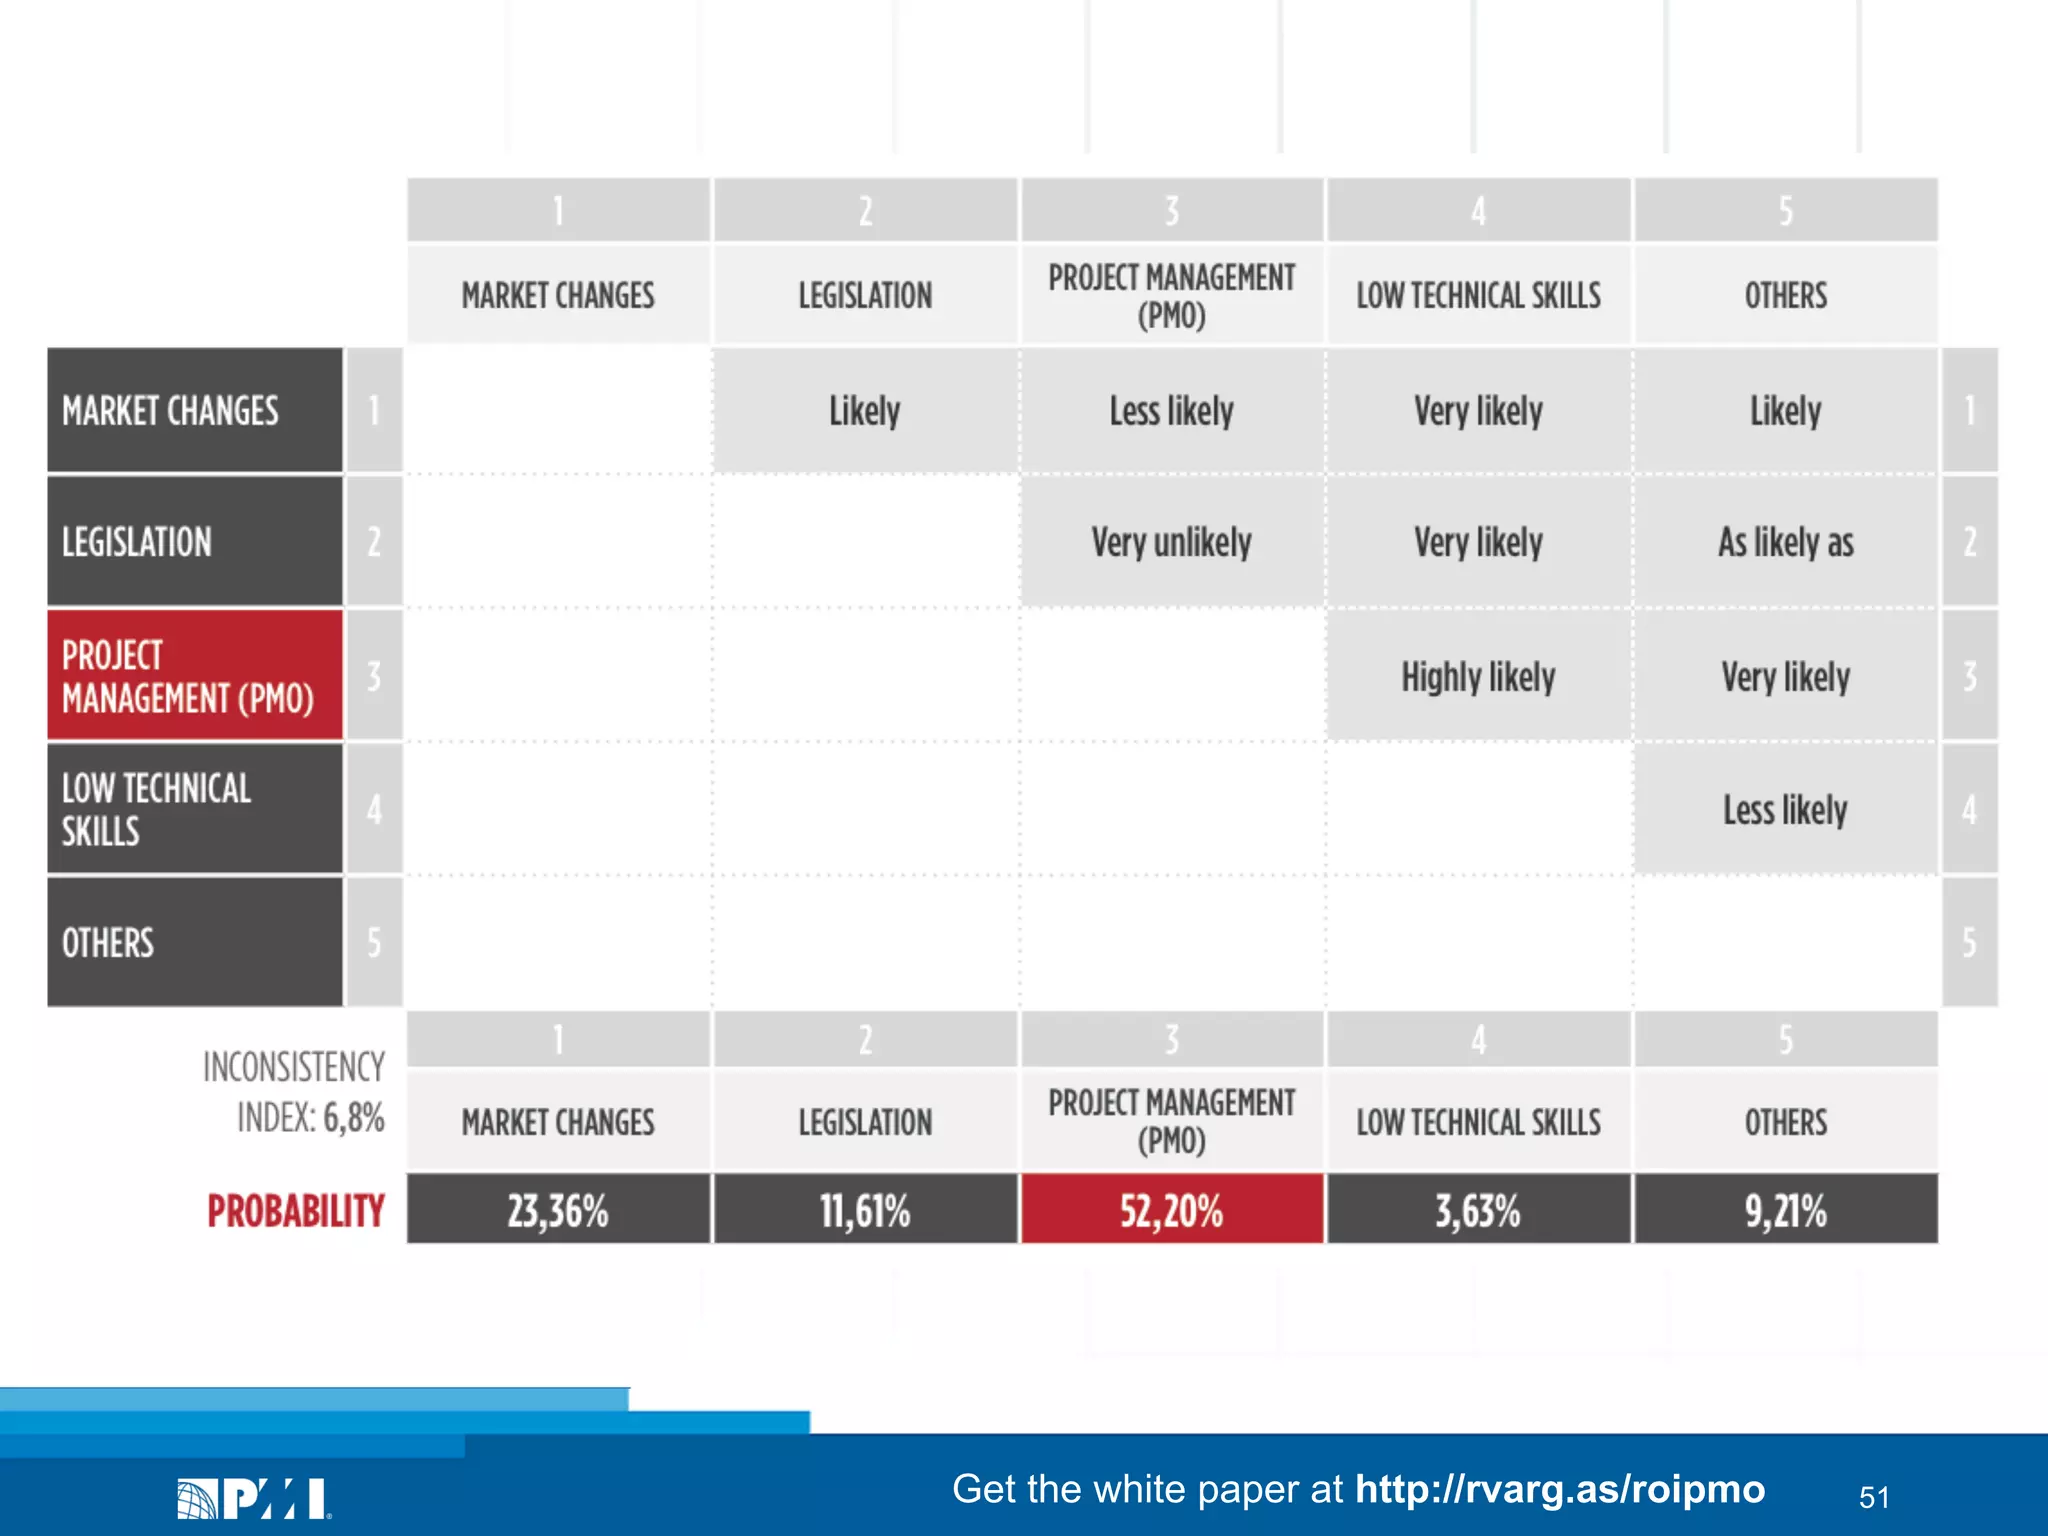
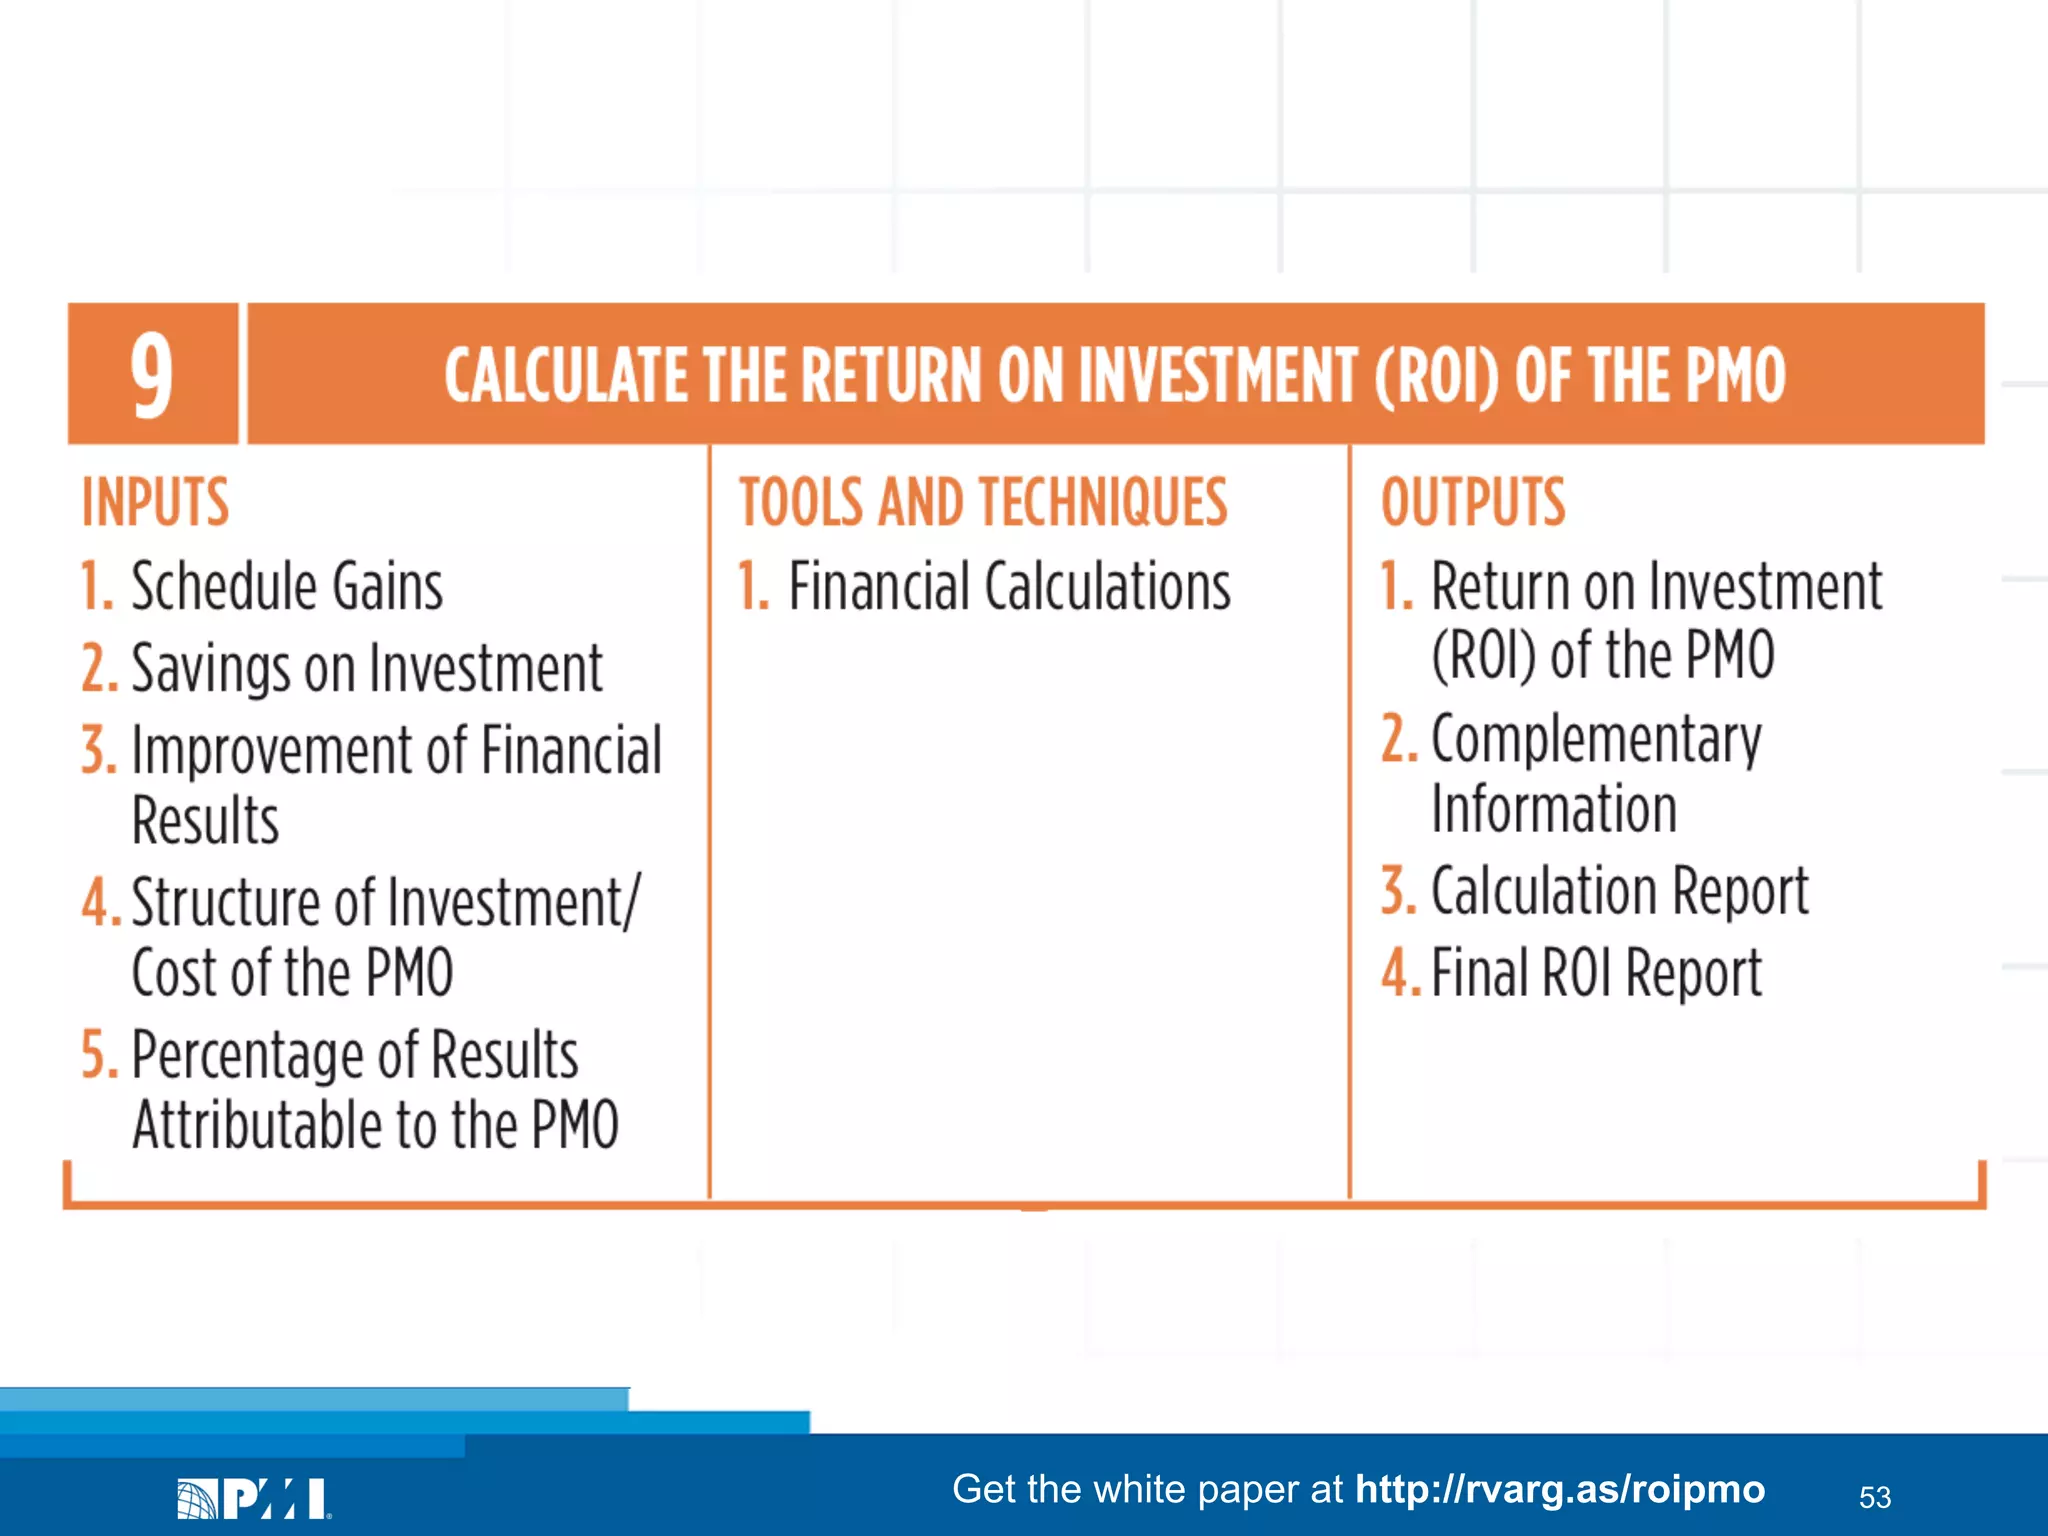
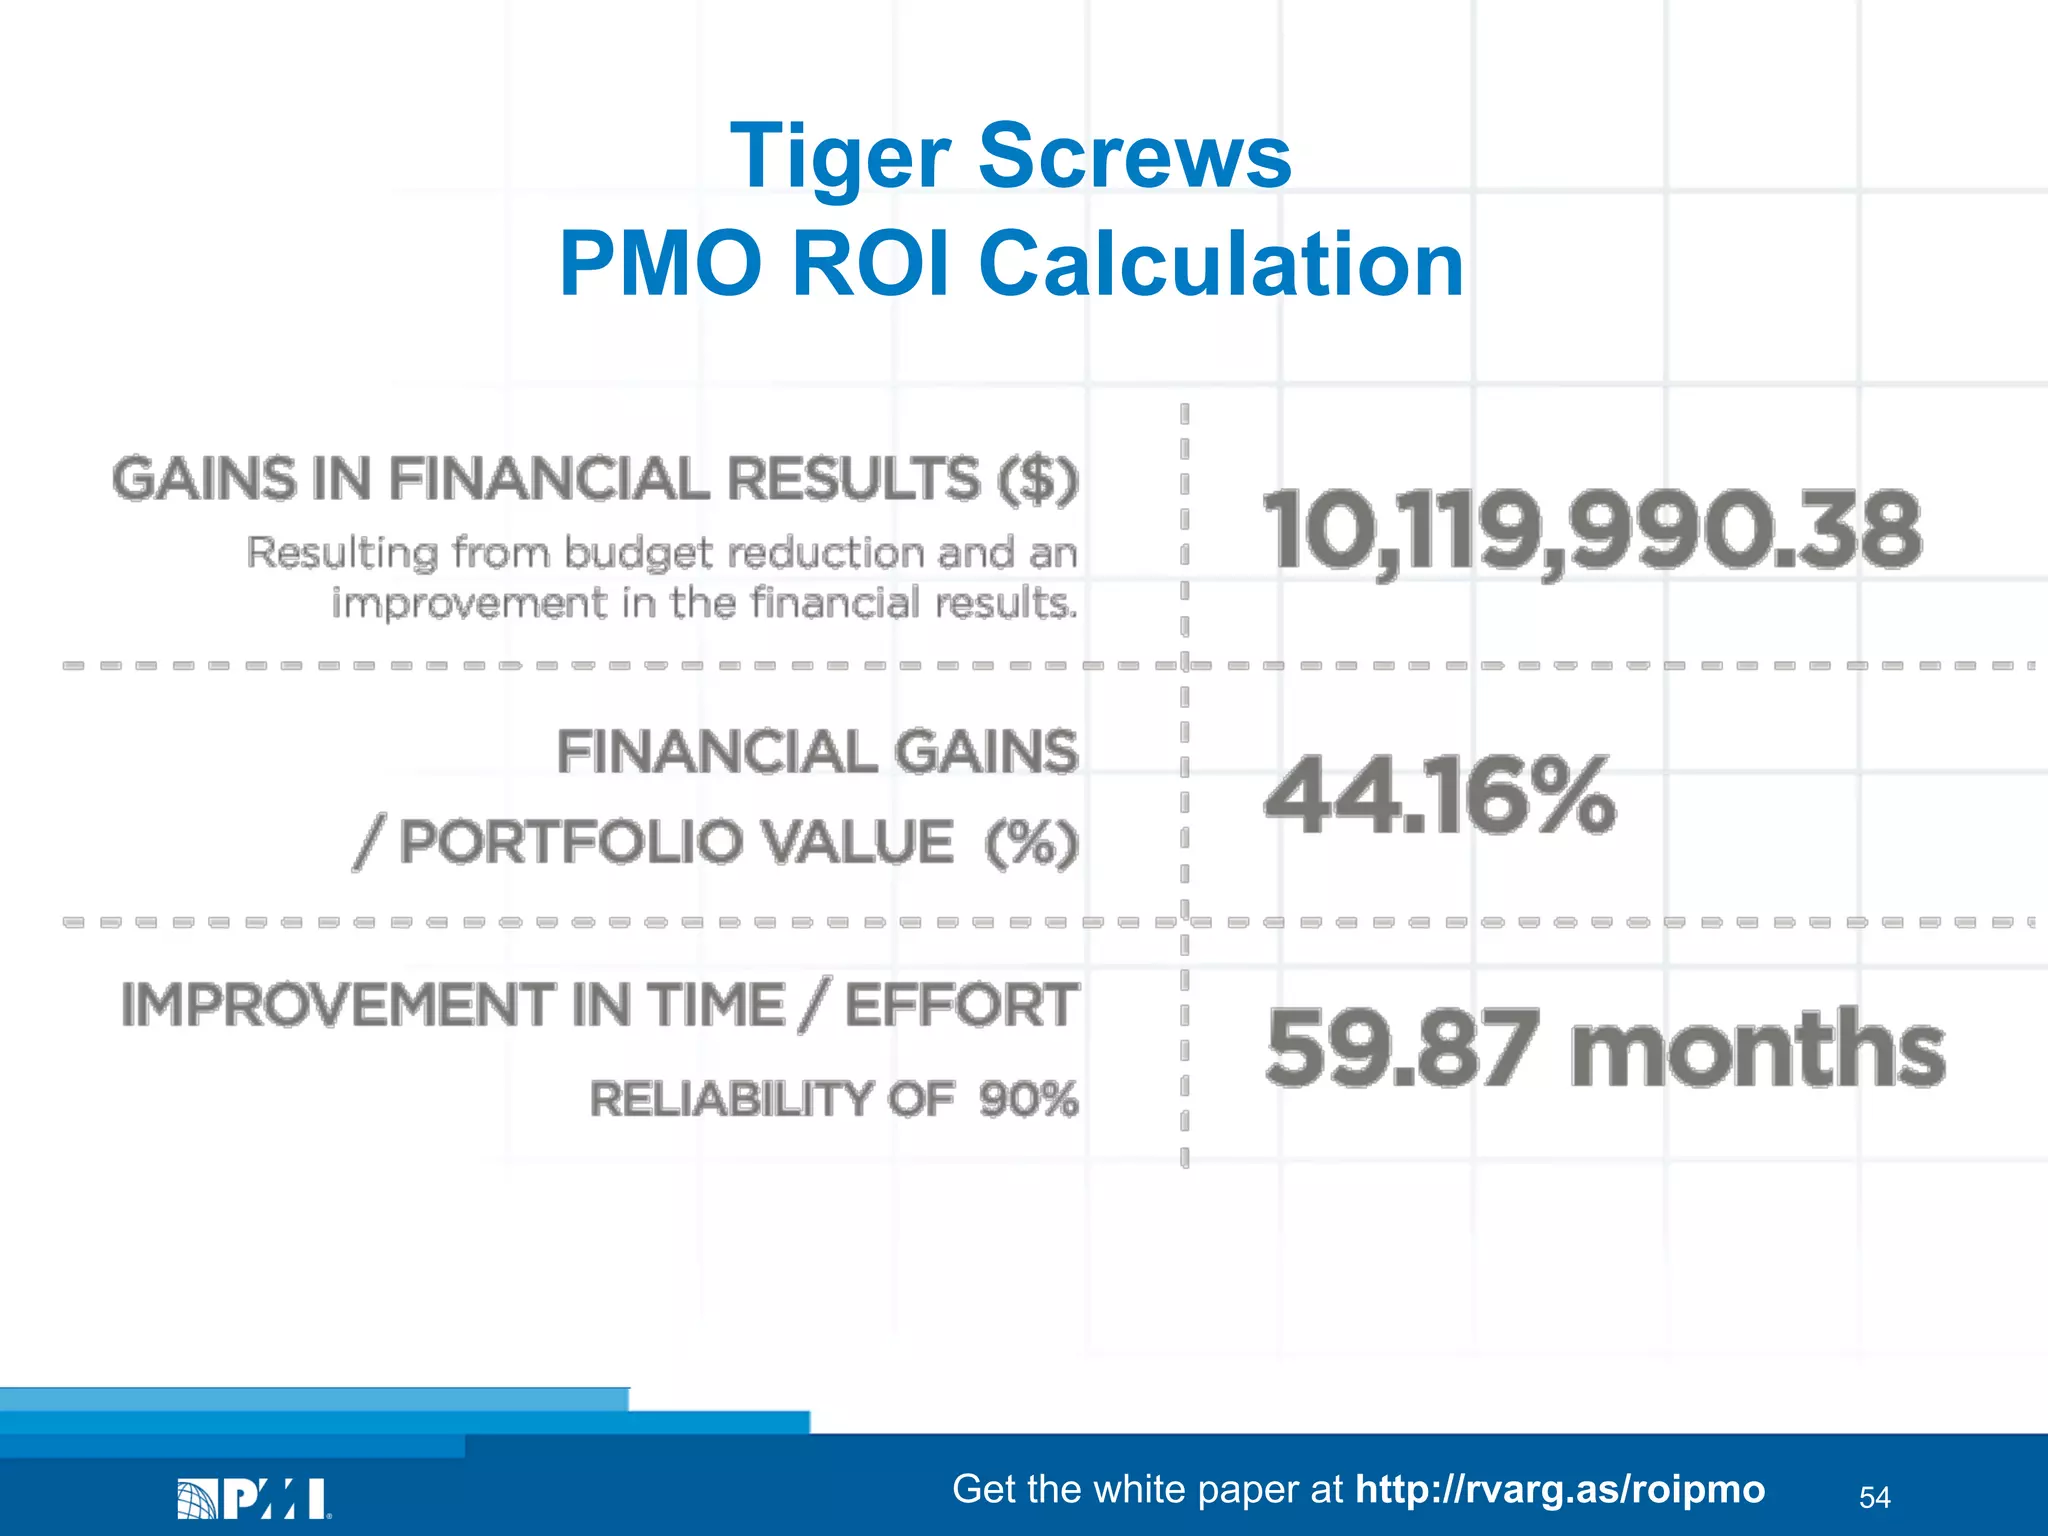
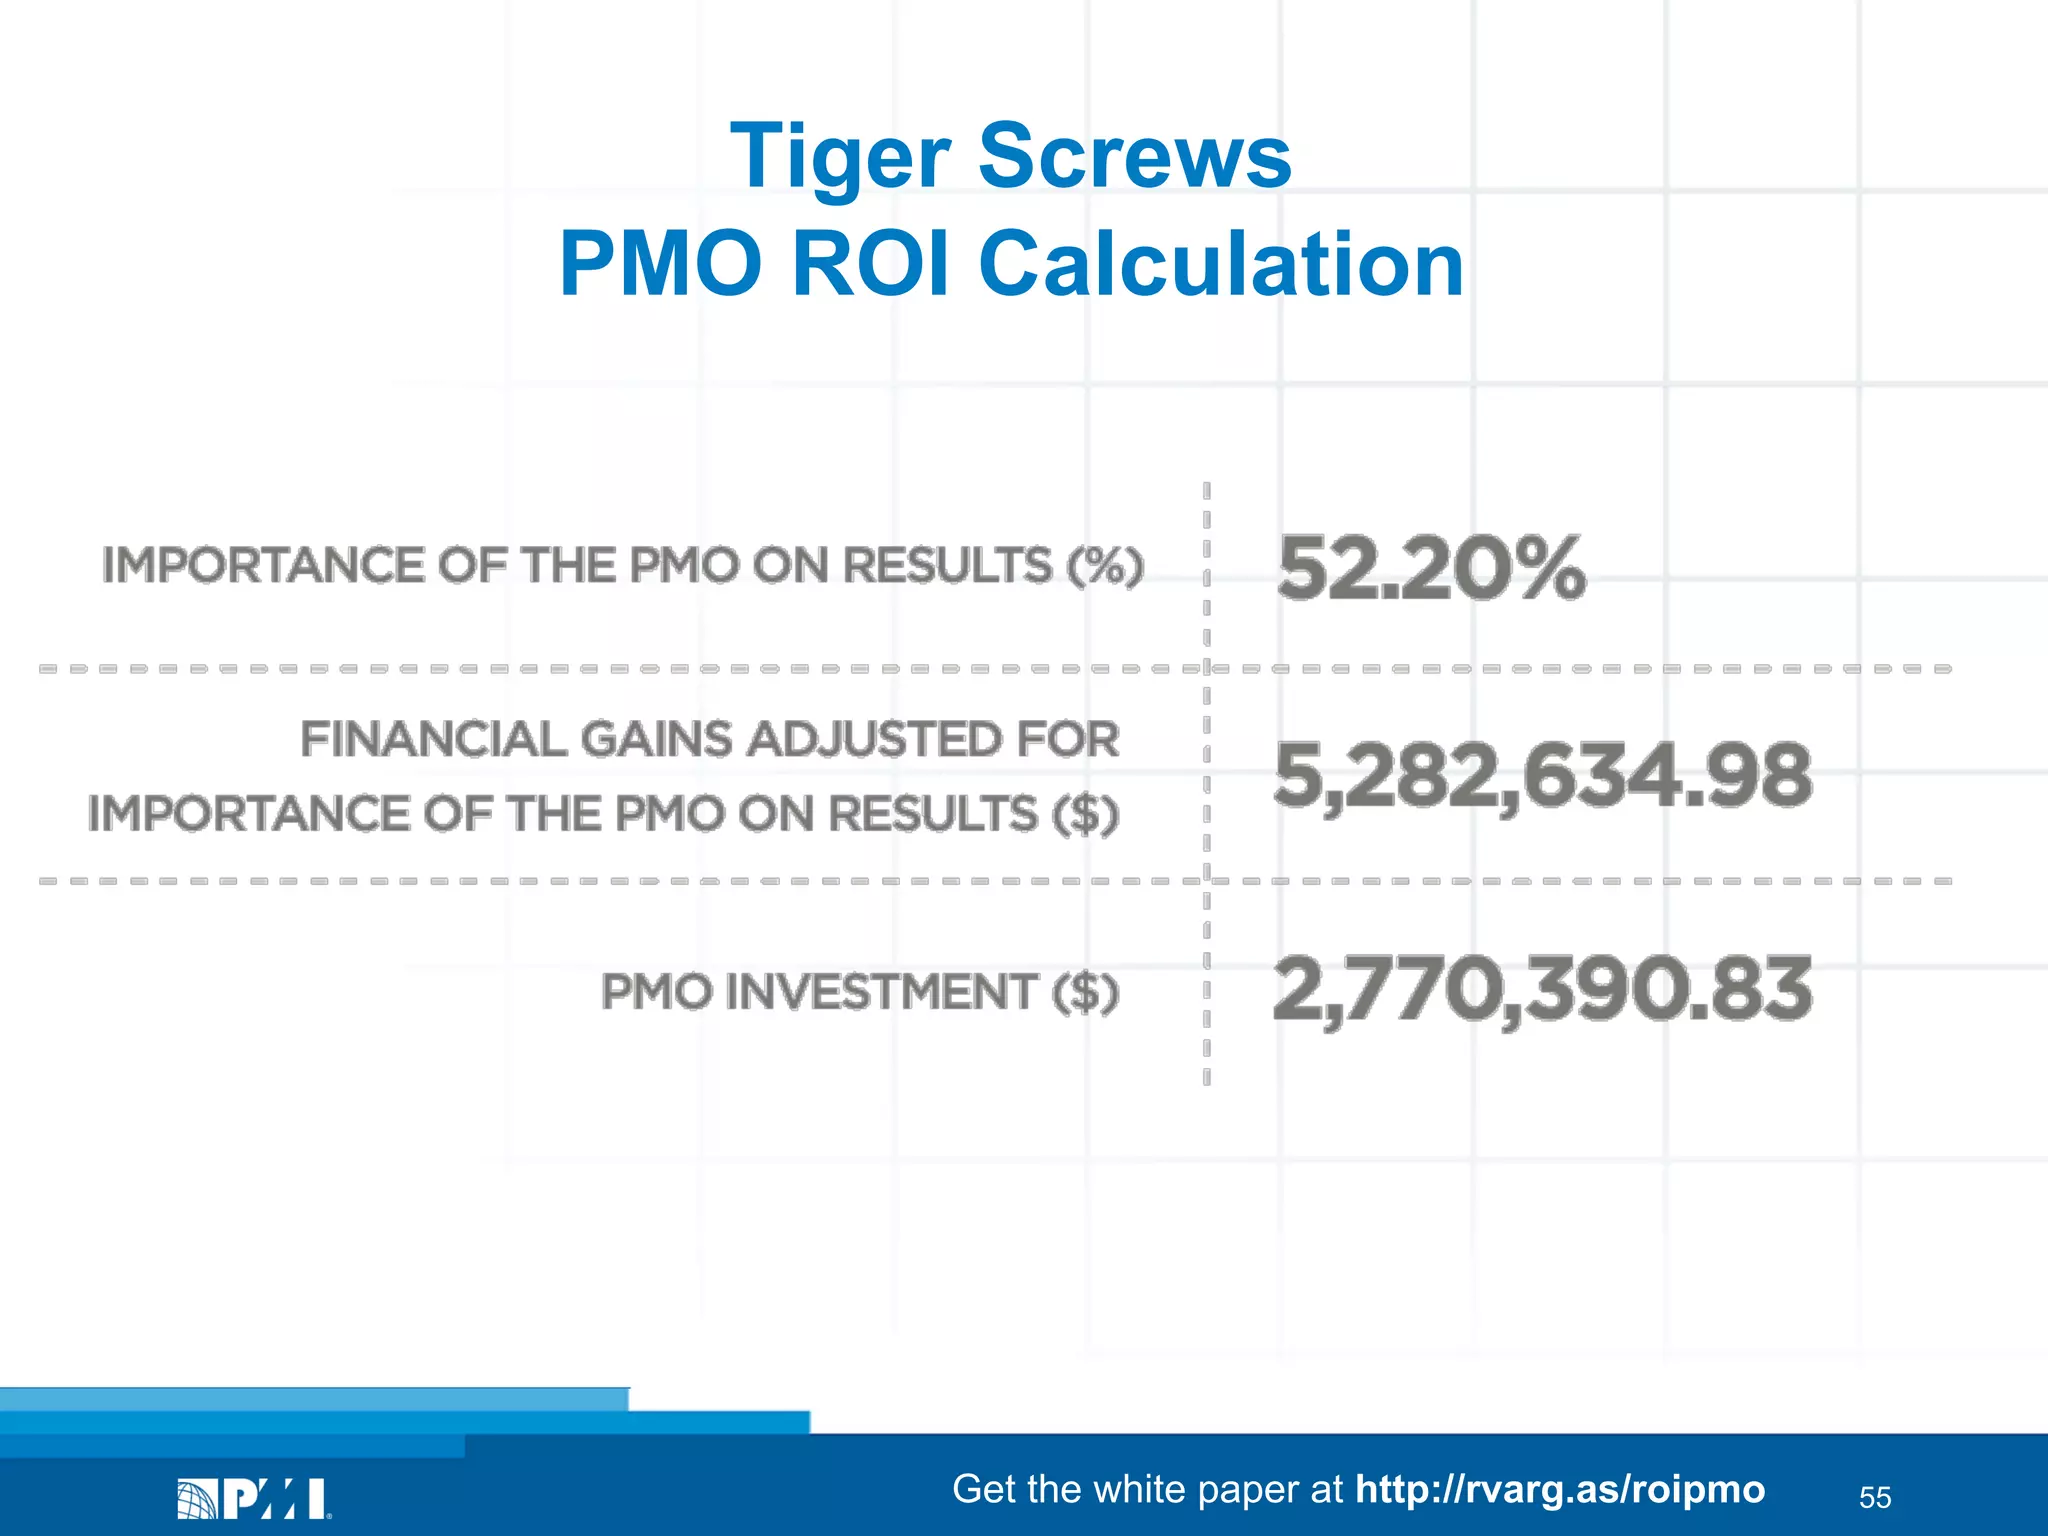
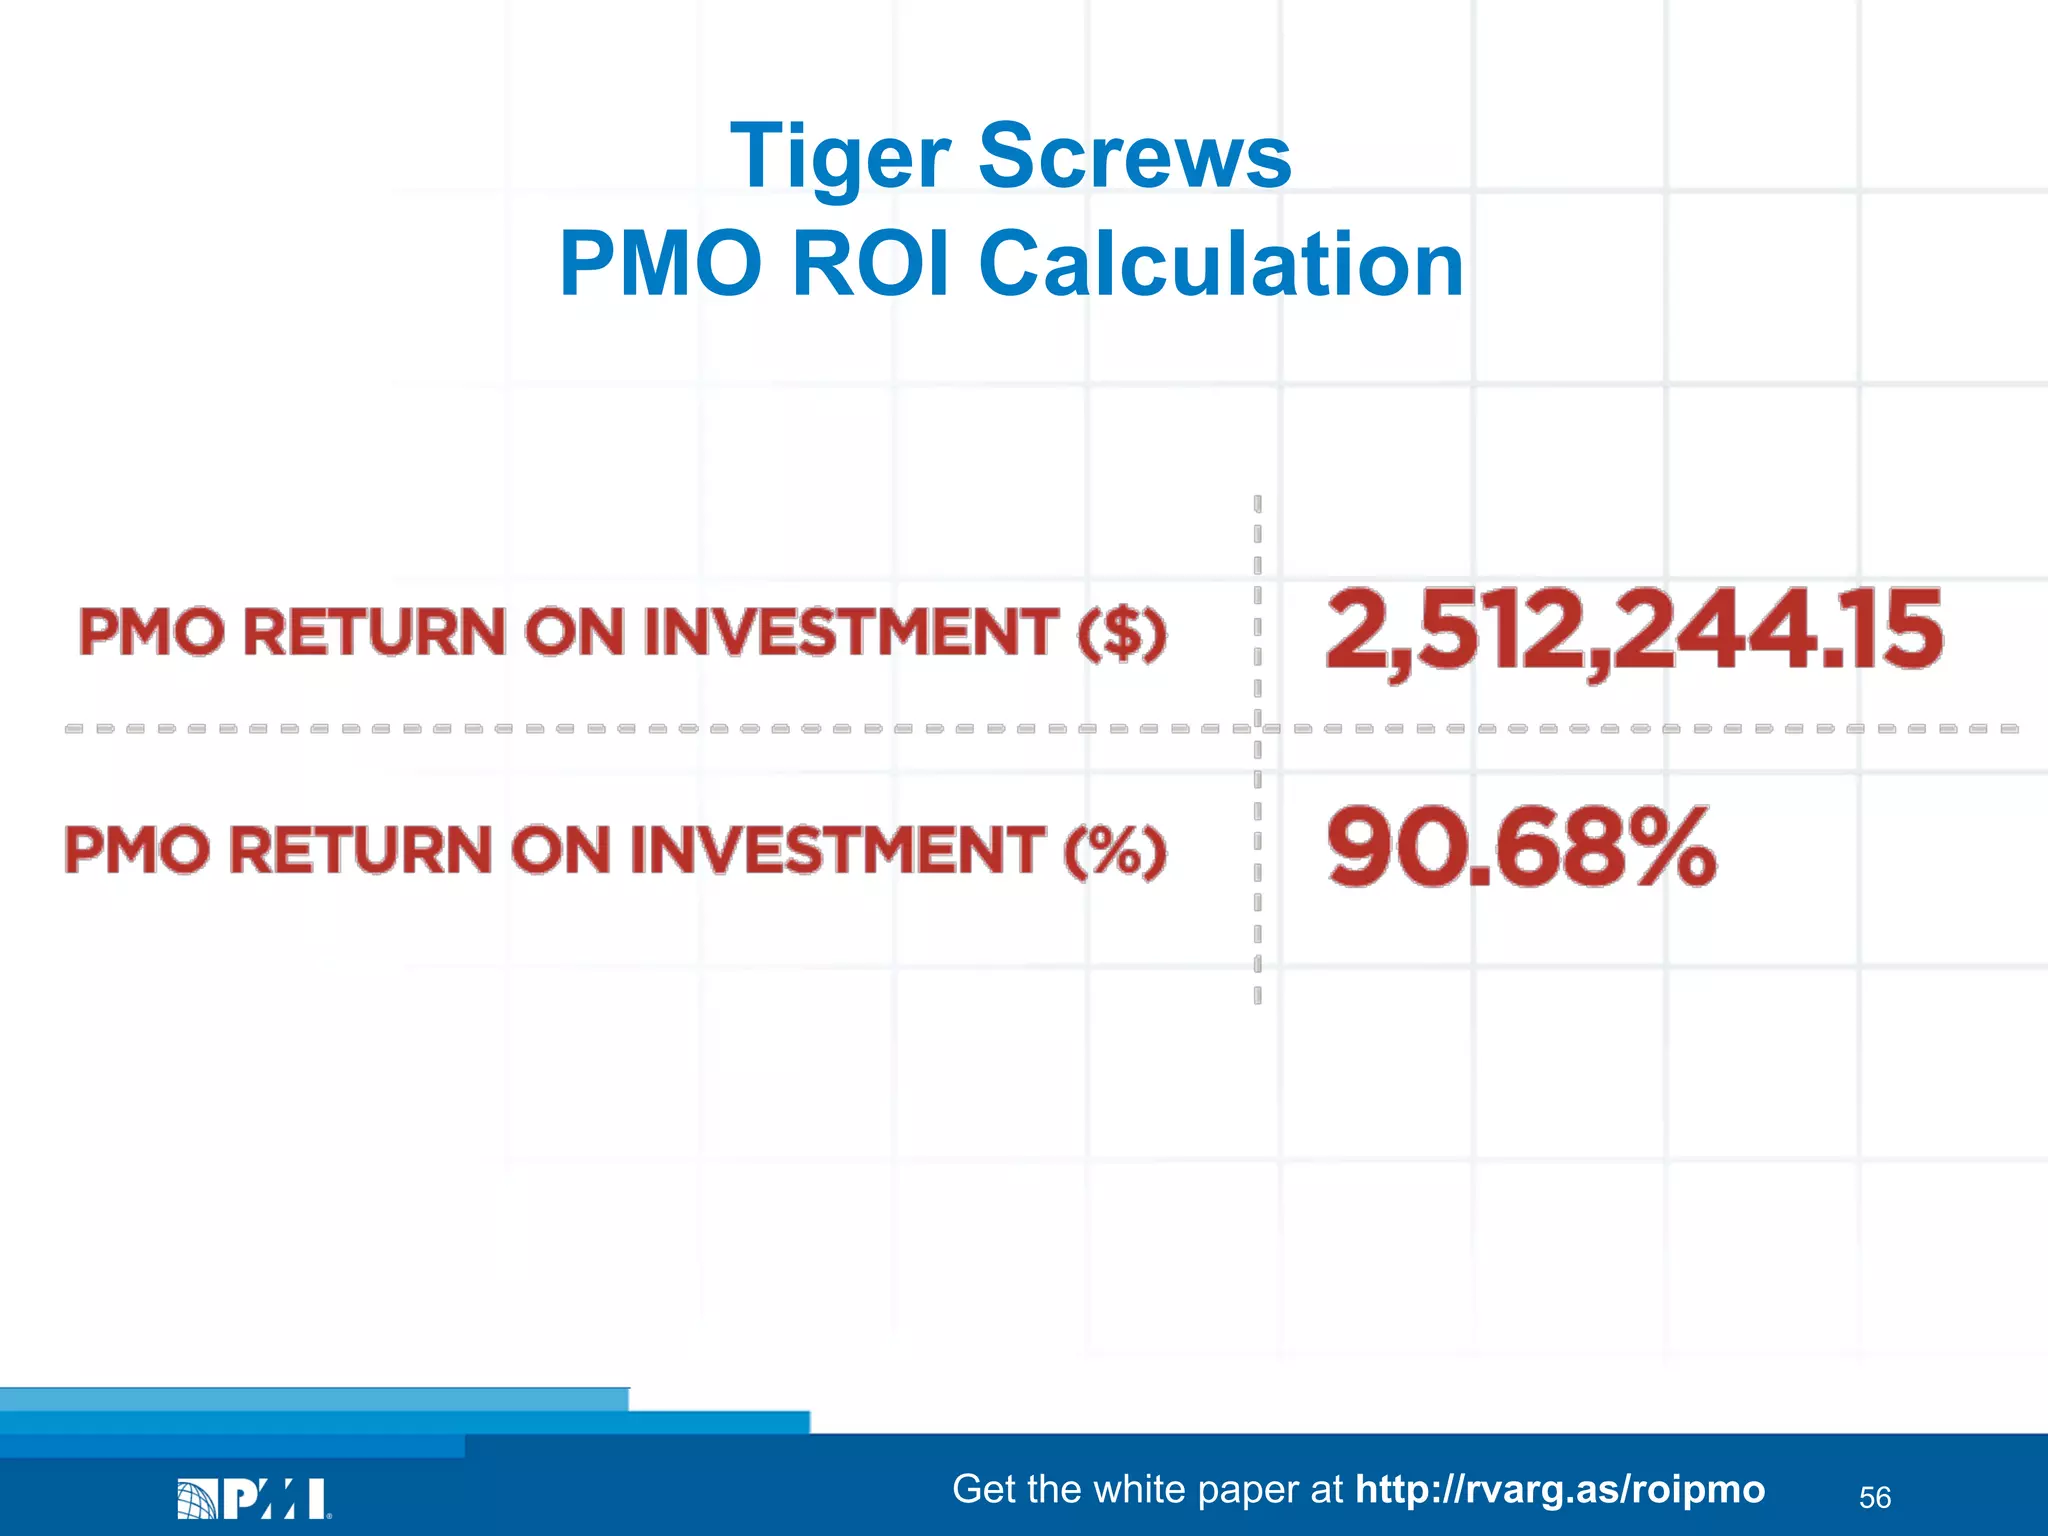
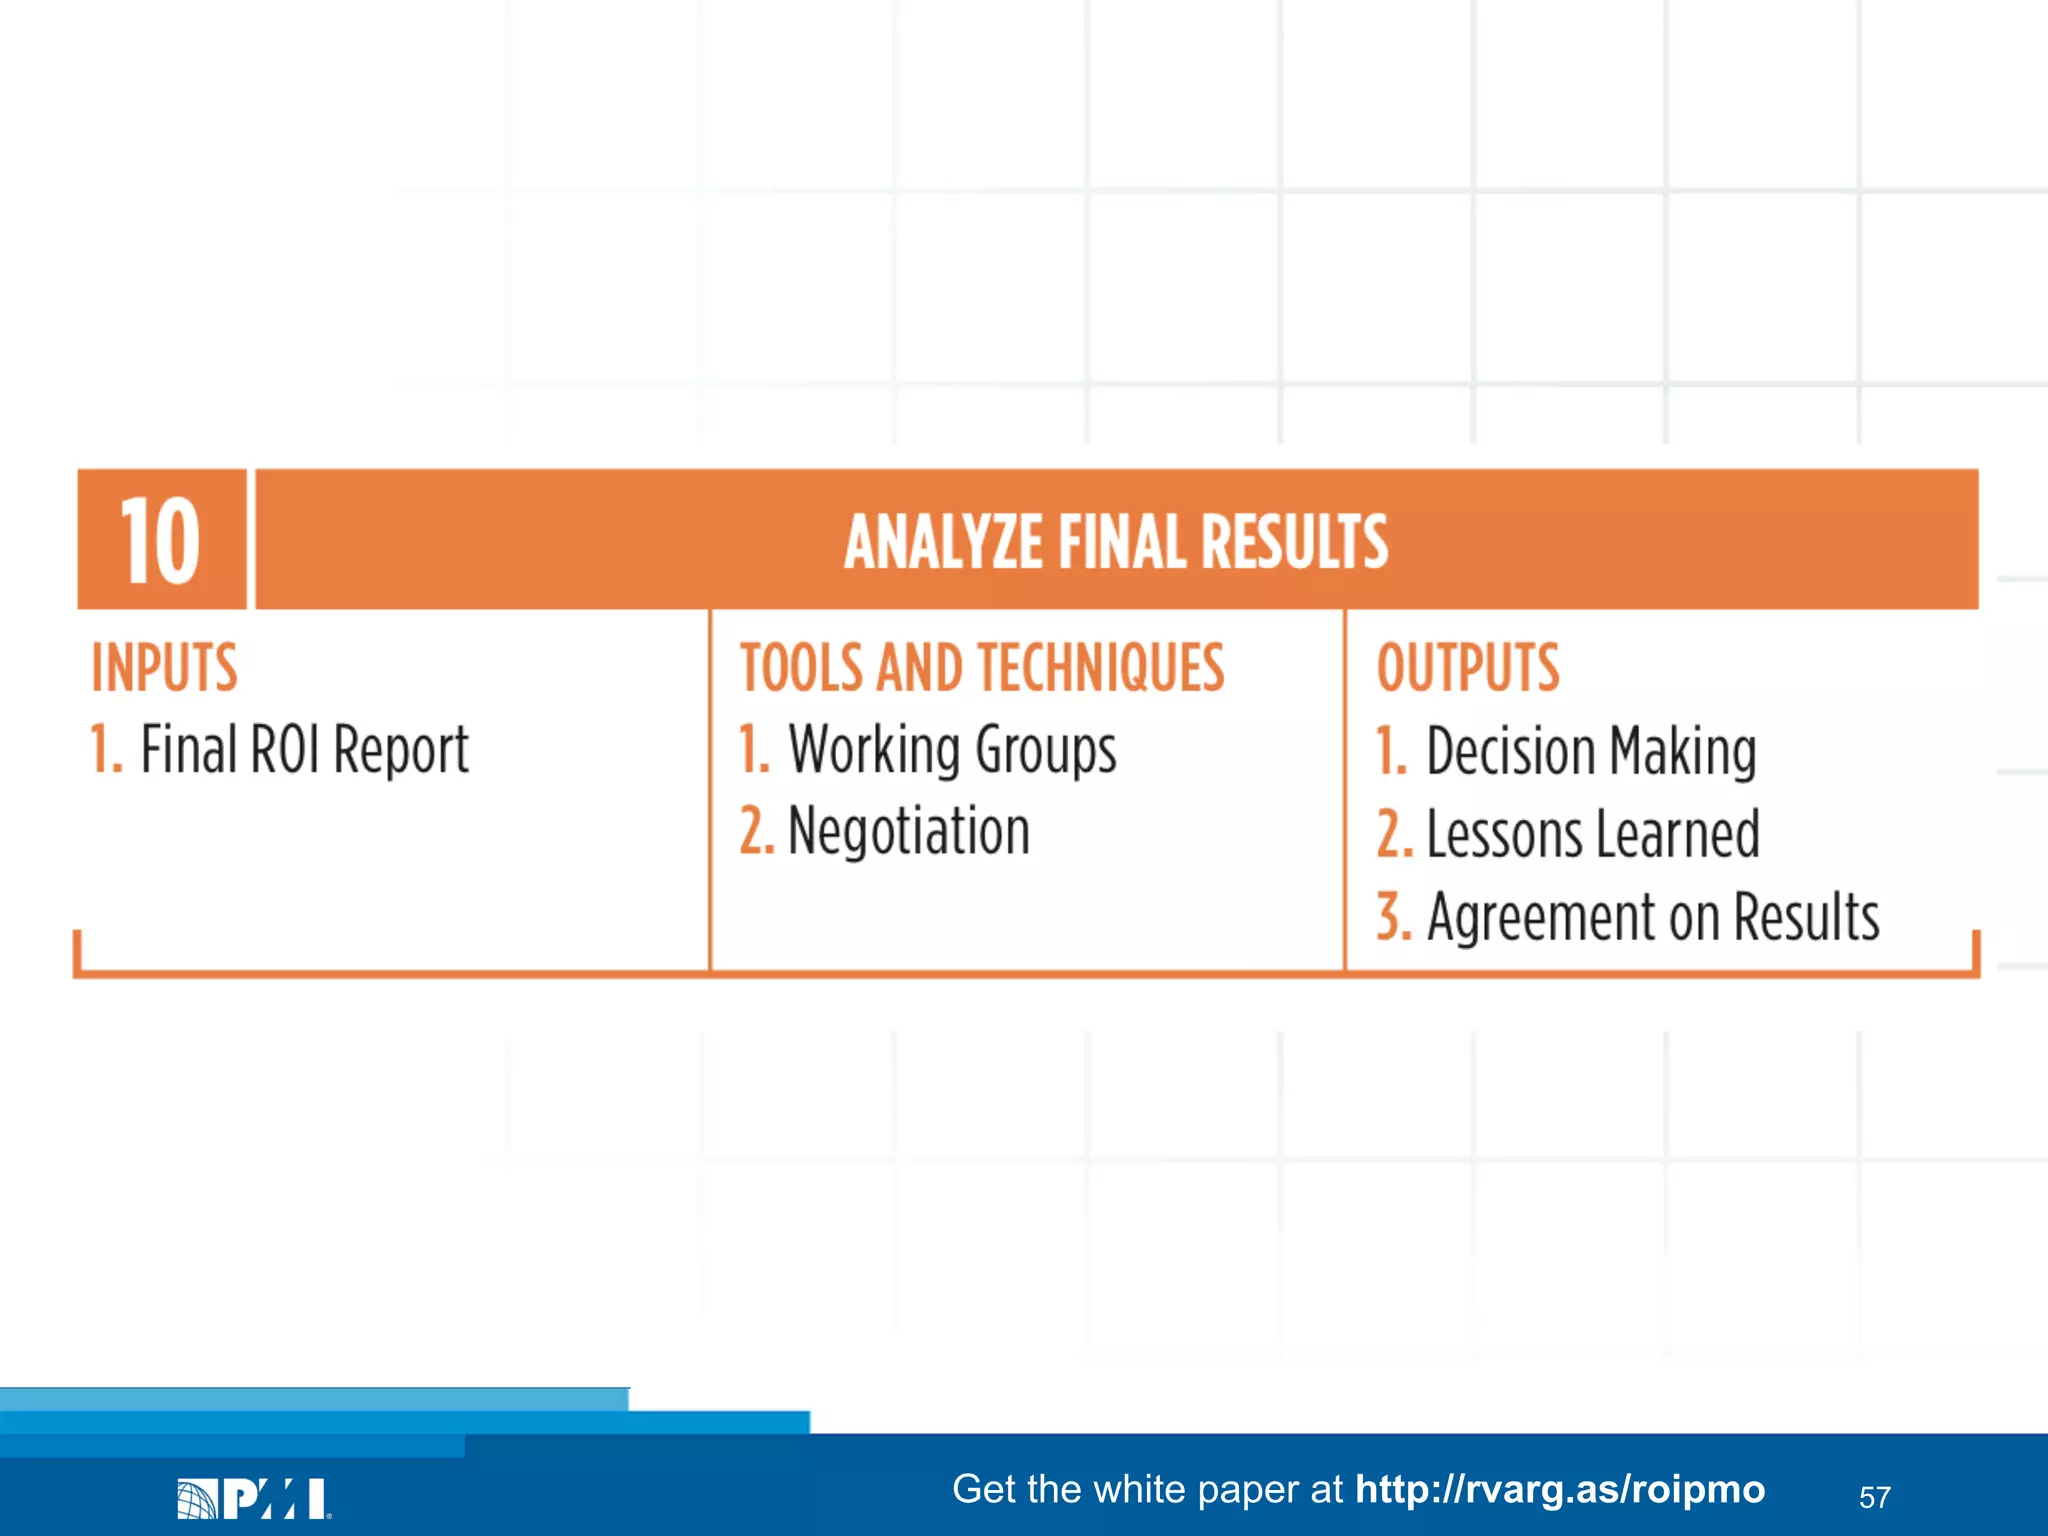
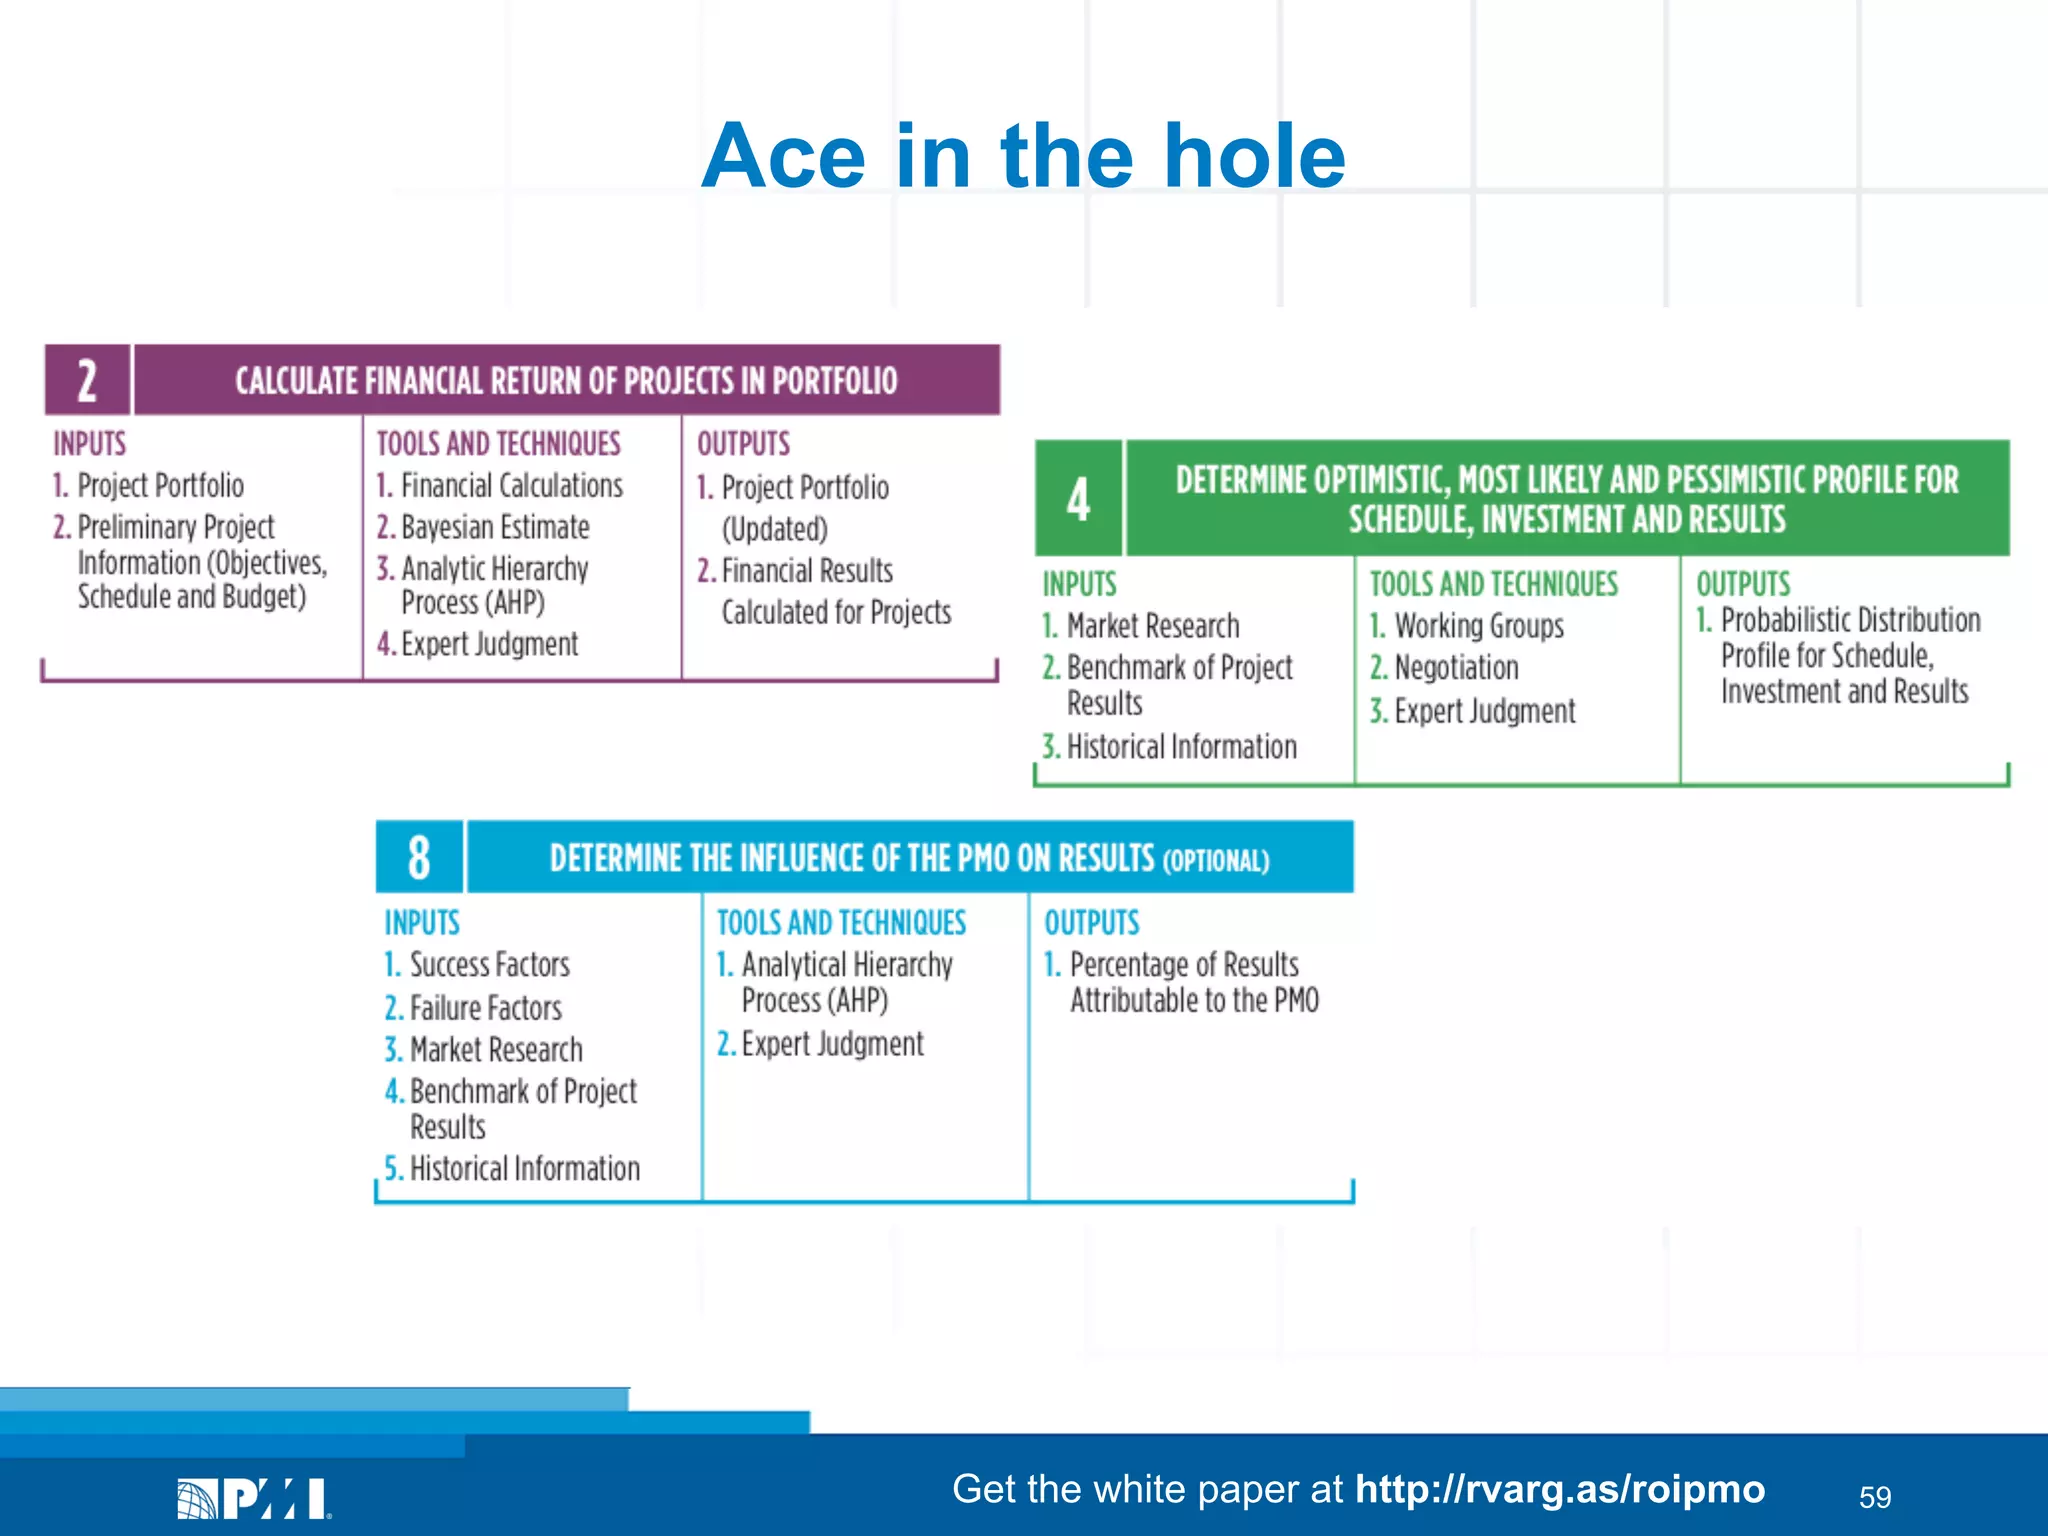
Determining the Mathematical ROI
of a Project Management Office
Implementation

Ricardo Viana Vargas
United Nations Office for Project Services (UNOPS)
“PMI” is a registered trade and service mark of the Project Management Institute, Inc.
©2013 Permission is granted to PMI for PMI® Marketplace use only.
Imagine hearing this
Our project
office estimates
a result of

With a
ROI of

$2.512.244,15

90,68%
Get the white paper at http://rvarg.as/roipmo

2
ROI Calculation Process

Get the white paper at http://rvarg.as/roipmo

3
ROI - Key benefits of a numerical calculation
•  Price is a proxy for value.
•  Makes it easier to align and integrate with financial
systems performance.
•  Supports the identification of critical sources of value.
•  Promotes communication and makes results
quantitatively tangible.

Get the white paper at http://rvarg.as/roipmo

4
What about the Challenges?
•  It is a simplification of the possible scenarios.
•  Plenty of cultural, social and moral aspects.
•  Benefits can be questionable since the perceptions of
value can be different.

Get the white paper at http://rvarg.as/roipmo

5
Process Overview
INVESTMENTS
IN PMO

PROJECT
PORTFOLIO

RESULTS

SIMULATION

DATA
DISTRIBUTION
PROFILE

INFLUENCE OF
THE PMO ON
RESULTS

Get the white paper at http://rvarg.as/roipmo

6
DATA DISTRIBUTION PROFILE

PROJECT PORTFOLIO
1

CREATE PORTFOLIO OF PROJECTS

INPUTS
1. Potential Projects

2

TOOLS AND TECHNIQUES
1. Working Groups
2. Expert Judgment

OUTPUTS
1. Project Portfolio
2. Preliminary Project
Information (Objectives,
Schedule and Budget)

4

INPUTS
1. Market Research
2. Benchmark of Project
Results
3. Historical Information

3

TOOLS AND TECHNIQUES
1. Financial Calculations
2. Bayesian Estimate
3. Analytic Hierarchy
Process (AHP)
4. Expert Judgment

OUTPUTS
1. Project Portfolio
(Updated)
2. Financial Results
Calculated for Projects

CATEGORIZE PROJECTS (OPTIONAL)

INPUTS
1. Project Portfolio

OUTPUTS
1. Probabilistic Distribution
Profile for Schedule,
Investment and Results

TOOLS AND TECHNIQUES
1. Description of the
Categories
2. Working Groups
3. Expert Judgment

OUTPUTS
1. Projects Grouped in
“Categories”

SIMULATION
5

INVESTMENT IN THE PMO
CALCULATE INVESTMENT AND OPERATIONAL COSTS OF THE PMO/PROJECT
STRUCTURE

INPUTS
1. Direct Costs
2. Indirect Costs
3. Investment in
Consultancy
4. Investment in Training
5. Procurement
6. Other Information on
Costs and Investment

TOOLS AND TECHNIQUES
1. Financial Calculations
2. Budget Structure
3. Negotiation
4. Expert Judgment

OUTPUTS
1. Structure of Investment/
Cost of the PMO

TOOLS AND TECHNIQUES
1. Monte Carlo Software
Simulation

OUTPUTS
1. Probabilistic Distribution
of Schedule Gains
2. Probabilistic Distribution
of Investment Savings
3. Probabilistic Distribution
of Improvements of
Financial Results

IDENTIFY GAINS IN SCHEDULE, INVESTMENT AND RESULTS WITH THE
IMPLEMENTATION OF THE PMO

INPUTS
1. Probabilistic Distribution
of Schedule gains
2. Probabilistic Distribution
of Investment saving
3. Probabilistic Distribution
of Improvements of
Financial Results
4. Organizational Tolerance
Level

TOOLS AND TECHNIQUES
1. Negotiation
2. Expert Judgment

OUTPUTS
1. Schedule Gains
2. Savings on Investment
3. Improvement of Financial
Results

Process Flow

RESULTS
9

INFLUENCE OF THE PMO ON RESULTS
DETERMINE THE INFLUENCE OF THE PMO ON RESULTS (OPTIONAL)

INPUTS
1. Success Factors
2. Failure Factors
3. Market Research
4. Benchmark of Project
Results
5. Historical Information

SIMULATE PORTFOLIO OF PROJECTS

INPUTS
1. Projects Grouped in
Categories
2. Project Portfolio
3. Probabilistic Distribution
Profile for Schedule,
Investment and Results

6

8

TOOLS AND TECHNIQUES
1. Working Groups
2. Negotiation
3. Expert Judgment

CALCULATE FINANCIAL RETURN OF PROJECTS IN PORTFOLIO

INPUTS
1. Project Portfolio
2. Preliminary Project
Information (Objectives,
Schedule and Budget)

7

DETERMINE OPTIMISTIC, MOST LIKELY AND PESSIMISTIC PROFILE FOR
SCHEDULE, INVESTMENT AND RESULTS

TOOLS AND TECHNIQUES
1. Analytical Hierarchy
Process (AHP)
2. Expert Judgment

OUTPUTS
1. Percentage of Results
Attributable to the PMO

CALCULATE THE RETURN ON INVESTMENT (ROI) OF THE PMO

INPUTS
1. Schedule Gains
2. Savings on Investment
3. Improvement of Financial
Results
4. Structure of Investment/
Cost of the PMO
5. Percentage of Results
Attributable to the PMO

10
INPUTS
1. Final ROI Report

TOOLS AND TECHNIQUES
1. Financial Calculations

OUTPUTS
1. Return on Investment
(ROI) of the PMO
2. Complementary
Information
3. Calculation Report
4. Final ROI Report

ANALYZE FINAL RESULTS
TOOLS AND TECHNIQUES
1. Working Groups
2. Negotiation

OUTPUTS
1. Decision Making
2. Lessons Learned
3. Agreement on Results

This flowchart is part of the article “Calculating the Return on Investment on a
Project Management Office (PMO)” developed by Ricardo Viana Vargas.
© Macrosolutions SA. All rights reserved. Reproduction prohibited.

ricardo-vargas.com

Get the white paper at http://rvarg.as/roipmo

7
Step by Step Process:
Tiger Screws Case

Get the white paper at http://rvarg.as/roipmo

8
Tiger Screws Company

S DA EMPRESA
•  Founded in 1961

•  Third largest screw
A Tiger Screws foi fundada em 1961 e é
manufacturer in the country
a terceira maior fabricante de parafusos
do país.Produces 4200 tons per month
• 
Tem capacidade para produzir 4,2 mil
•  12,000 products comprising
toneladas/mês e um portfólio de 12 mil
produtos em 280 diferentes linhas. 280 different lines
Com faturamento de R$48.000.000.00 no último ano, a Tiger Screws
•  Revenues of $48,000,000.00
tem crescido em média 21% ao ano. Outra empresa, a líder nesse
last year
segmento, tem faturamento de R$79.000.000.00 e uma média de
crescimento de 15% ao ano.
70% das vendas da Tiger Screws são feitas no mercado nacional e
30% em outros 6 países dos continentes americano at http://rvarg.as/roipmo
Get the white paper e africano.

9
IN THE COUNTRY WITH A STRONG INTERNATIONAL PRESENCE

INCREASE REVENUE
WITH THE RIGHT MIX OF
PRODUCTS

LEARNING
AND GROWTH

INTERNAL PROCESSES

MARKET

FINANCE

MAP

IMPROVE FINANCIAL
RETURNS

BE A LEADER IN THE
DOMESTIC MARKET

REDUCE PRODUCTION
COSTS

INCREASE
INTERNATIONAL
MARKET SHARE

CUSTOMER RELATIONSHIP

INTERNATIONALIZATION

IMPROVE CUSTOMER
SERVICE

DEVELOP
INTERNATIONAL
MARKETS

INCREASE PROJECTS
RESULTS

REDUCE LOST-TIME
ACCIDENTS

OPTIMIZE THE PRODUCT
MIX

REDUCE CUSTOMER
COMPLAINTS

MONITOR CUSTOMERS'
NEEDS IN OTHER
COUNTRIES

REDUCE OPERATING
LOSS

CONTROL MAINTENANCE
COSTS

REDUCE MACHINERY
PROGRAMMING
TIME

DEVELOP HUMAN
RESOURCES

OPERATIONAL EXCELLENCE

STRENGTHEN INTERNAL
COMMUNICATION
BETWEEN AREAS

DEVELOP INFORMATION
MANAGEMENT
SYSTEMS

© 2012 - Macrosolutions SA and e Symnetics Consultoria Empresarial Ltda. All rights reserved. Reproduction is prohibited.

Get the white paper at http://rvarg.as/roipmo

10
Project Portfolio

Get the white paper at http://rvarg.as/roipmo

11
Get the white paper at http://rvarg.as/roipmo

12
Medium

nology

Medium
Low

es

Medium

Modernization of the Instrumentation System

Medium
E-commerce
Tiger Screws’ Project List
Low
PROJECT
High

Corporate Office Projects

High
Review of Low Mix Low
Product
Zero
elopmentAccidents
High
High

New Markets

es Internationalization of Production Units
Very High
High
Modernization of the Instrumentation System
High
High

Import Finished Products

es E-commerce Low
Very
None
Corporate High Projects High
Office
nology
New Markets
Medium
Medium

University Tiger Screws
New Line for the Oil Industry
Opening of Capital
Social Media
ERP System
New Maintenance Policy

University Tiger Screws
New Line for the Oil Industry
Import Finished Products
Opening of Capital

Get the white paper at http://rvarg.as/roipmo

13
Example of Preliminary Information

Get the white paper at http://rvarg.as/roipmo

14
Tiger Screws Portfolio Consolidated Information

Get the white paper at http://rvarg.as/roipmo

15
Tiger Screws Portfolio Consolidated Information

Get the white paper at http://rvarg.as/roipmo

16
Tiger Screws Portfolio Consolidated Information

Get the white paper at http://rvarg.as/roipmo

17
Tiger Screws Portfolio Consolidated Information

Get the white paper at http://rvarg.as/roipmo

18
Get the white paper at http://rvarg.as/roipmo

19
Monetizing Intangibles

Get the white paper at http://rvarg.as/roipmo

20
Example: Corporate University
•  Q: Why is there interest in the implementation of the
Corporate University?
–  A: So that we can prepare new talents
•  Q: Why is there interest in preparing new talents?
–  A: To have in the future a greater allegiance in our
executive level professionals.

Get the white paper at http://rvarg.as/roipmo

21
Example: Corporate University
•  Q: Why do you want higher allegiance in the future?
–  A: To lessen the turnover that generates additional
costs
Then it can be concluded that one of the main objectives of
the Corporate University is to reduce additional costs of
hiring.
Imagine that the Tiger Screws’ cost of hiring is $8,716,704
over the next 5 years and that there is a likelihood that they
are reduced in the coming years because of the corporate
university.

Get the white paper at http://rvarg.as/roipmo

22
AHP and Bayesian Estimate: University Tiger Screws

Get the white paper at http://rvarg.as/roipmo

23
Example of Results
University Tiger Screws
•  Result: $608,110.28
•  Investment: $350,000.00
•  Benefit: 258,110.28

•  Project ROI: 74%

NOTE: Assuming the values are already brought to their present values.

Get the white paper at http://rvarg.as/roipmo

24
Tiger Screws Portfolio Consolidated Information

Get the white paper at http://rvarg.as/roipmo

25
Tiger Screws Portfolio Consolidated Information

The Total duration is used only to determine the approximate total workload in projects.
The term may be replaced by man/hour or other measures of effort.

Get the white paper at http://rvarg.as/roipmo

26
Tiger Screws Portfolio Consolidated Information

Get the white paper at http://rvarg.as/roipmo

27
Get the white paper at http://rvarg.as/roipmo

28
Get the white paper at http://rvarg.as/roipmo

29
Get the white paper at http://rvarg.as/roipmo

30
Get the white paper at http://rvarg.as/roipmo

31
Data Distribution Profile

Get the white paper at http://rvarg.as/roipmo

32
Get the white paper at http://rvarg.as/roipmo

33
Standish Group Report

Get the white paper at http://rvarg.as/roipmo

34
FEL and Investment Projects

Get the white paper at http://rvarg.as/roipmo

35
PMI Pulse Report 2012

Get the white paper at http://rvarg.as/roipmo

36
PwC Report

Get the white paper at http://rvarg.as/roipmo

37
Chosen Profile:
Tiger Screws - Conservative

Get the white paper at http://rvarg.as/roipmo

38
Simulation

Get the white paper at http://rvarg.as/roipmo

39
Get the white paper at http://rvarg.as/roipmo

40
Get the white paper at http://rvarg.as/roipmo

41
Get the white paper at http://rvarg.as/roipmo

42
Get the white paper at http://rvarg.as/roipmo

43
Get the white paper at http://rvarg.as/roipmo

44
Get the white paper at http://rvarg.as/roipmo

45
Investments in PMO

Get the white paper at http://rvarg.as/roipmo

46
Get the white paper at http://rvarg.as/roipmo

47
PMO Tiger Screws
PMO Investments

Get the white paper at http://rvarg.as/roipmo

48
Influence of the PMO on Results

Get the white paper at http://rvarg.as/roipmo

49
Get the white paper at http://rvarg.as/roipmo

50
Get the white paper at http://rvarg.as/roipmo

51
Results

Get the white paper at http://rvarg.as/roipmo

52
Get the white paper at http://rvarg.as/roipmo

53
Tiger Screws
PMO ROI Calculation

Get the white paper at http://rvarg.as/roipmo

54
Tiger Screws
PMO ROI Calculation

Get the white paper at http://rvarg.as/roipmo

55
Tiger Screws
PMO ROI Calculation

Get the white paper at http://rvarg.as/roipmo

56
Get the white paper at http://rvarg.as/roipmo

57
Key Points and Conclusions
•  The model is a "master line” of the value calculation
and can thus be customized.
•  The entire process is to be performed in teams.
•  Any mathematical model is a simplification of the real
process.
•  The result of the PMO is achieved by simulating
imagined future scenarios (a risk inherent to the
process).

Get the white paper at http://rvarg.as/roipmo

58
Ace in the hole

Get the white paper at http://rvarg.as/roipmo

59
Conclusions
•  It is impossible to determine ROI without knowing which
projects are selected and the strategy that goes behind
them.
•  If the PMO will manage projects with no calculable
benefits (mathematically intangible), it is essential that
the calculation process (step 2) is carried out with great
care and attention.
•  This is a laborious process but much more effective to
determine/prove the value of the PMO.

Get the white paper at http://rvarg.as/roipmo

60
Contact Information
Ricardo Viana Vargas
ricardov@unops.org / ricardo@ricardo-vargas.com
www.unops.org
Twitter: @rvvargas
Get the white paper at http://rvarg.as/roipmo

Get the white paper at http://rvarg.as/roipmo

61

Determining the Mathematical ROI of a Project Management Office (PMO) Implementation – Slides

  • 1.
    Determining the MathematicalROI of a Project Management Office Implementation Ricardo Viana Vargas United Nations Office for Project Services (UNOPS) “PMI” is a registered trade and service mark of the Project Management Institute, Inc. ©2013 Permission is granted to PMI for PMI® Marketplace use only.
  • 2.
    Imagine hearing this Ourproject office estimates a result of With a ROI of $2.512.244,15 90,68% Get the white paper at http://rvarg.as/roipmo 2
  • 3.
    ROI Calculation Process Getthe white paper at http://rvarg.as/roipmo 3
  • 4.
    ROI - Keybenefits of a numerical calculation •  Price is a proxy for value. •  Makes it easier to align and integrate with financial systems performance. •  Supports the identification of critical sources of value. •  Promotes communication and makes results quantitatively tangible. Get the white paper at http://rvarg.as/roipmo 4
  • 5.
    What about theChallenges? •  It is a simplification of the possible scenarios. •  Plenty of cultural, social and moral aspects. •  Benefits can be questionable since the perceptions of value can be different. Get the white paper at http://rvarg.as/roipmo 5
  • 6.
  • 7.
    DATA DISTRIBUTION PROFILE PROJECTPORTFOLIO 1 CREATE PORTFOLIO OF PROJECTS INPUTS 1. Potential Projects 2 TOOLS AND TECHNIQUES 1. Working Groups 2. Expert Judgment OUTPUTS 1. Project Portfolio 2. Preliminary Project Information (Objectives, Schedule and Budget) 4 INPUTS 1. Market Research 2. Benchmark of Project Results 3. Historical Information 3 TOOLS AND TECHNIQUES 1. Financial Calculations 2. Bayesian Estimate 3. Analytic Hierarchy Process (AHP) 4. Expert Judgment OUTPUTS 1. Project Portfolio (Updated) 2. Financial Results Calculated for Projects CATEGORIZE PROJECTS (OPTIONAL) INPUTS 1. Project Portfolio OUTPUTS 1. Probabilistic Distribution Profile for Schedule, Investment and Results TOOLS AND TECHNIQUES 1. Description of the Categories 2. Working Groups 3. Expert Judgment OUTPUTS 1. Projects Grouped in “Categories” SIMULATION 5 INVESTMENT IN THE PMO CALCULATE INVESTMENT AND OPERATIONAL COSTS OF THE PMO/PROJECT STRUCTURE INPUTS 1. Direct Costs 2. Indirect Costs 3. Investment in Consultancy 4. Investment in Training 5. Procurement 6. Other Information on Costs and Investment TOOLS AND TECHNIQUES 1. Financial Calculations 2. Budget Structure 3. Negotiation 4. Expert Judgment OUTPUTS 1. Structure of Investment/ Cost of the PMO TOOLS AND TECHNIQUES 1. Monte Carlo Software Simulation OUTPUTS 1. Probabilistic Distribution of Schedule Gains 2. Probabilistic Distribution of Investment Savings 3. Probabilistic Distribution of Improvements of Financial Results IDENTIFY GAINS IN SCHEDULE, INVESTMENT AND RESULTS WITH THE IMPLEMENTATION OF THE PMO INPUTS 1. Probabilistic Distribution of Schedule gains 2. Probabilistic Distribution of Investment saving 3. Probabilistic Distribution of Improvements of Financial Results 4. Organizational Tolerance Level TOOLS AND TECHNIQUES 1. Negotiation 2. Expert Judgment OUTPUTS 1. Schedule Gains 2. Savings on Investment 3. Improvement of Financial Results Process Flow RESULTS 9 INFLUENCE OF THE PMO ON RESULTS DETERMINE THE INFLUENCE OF THE PMO ON RESULTS (OPTIONAL) INPUTS 1. Success Factors 2. Failure Factors 3. Market Research 4. Benchmark of Project Results 5. Historical Information SIMULATE PORTFOLIO OF PROJECTS INPUTS 1. Projects Grouped in Categories 2. Project Portfolio 3. Probabilistic Distribution Profile for Schedule, Investment and Results 6 8 TOOLS AND TECHNIQUES 1. Working Groups 2. Negotiation 3. Expert Judgment CALCULATE FINANCIAL RETURN OF PROJECTS IN PORTFOLIO INPUTS 1. Project Portfolio 2. Preliminary Project Information (Objectives, Schedule and Budget) 7 DETERMINE OPTIMISTIC, MOST LIKELY AND PESSIMISTIC PROFILE FOR SCHEDULE, INVESTMENT AND RESULTS TOOLS AND TECHNIQUES 1. Analytical Hierarchy Process (AHP) 2. Expert Judgment OUTPUTS 1. Percentage of Results Attributable to the PMO CALCULATE THE RETURN ON INVESTMENT (ROI) OF THE PMO INPUTS 1. Schedule Gains 2. Savings on Investment 3. Improvement of Financial Results 4. Structure of Investment/ Cost of the PMO 5. Percentage of Results Attributable to the PMO 10 INPUTS 1. Final ROI Report TOOLS AND TECHNIQUES 1. Financial Calculations OUTPUTS 1. Return on Investment (ROI) of the PMO 2. Complementary Information 3. Calculation Report 4. Final ROI Report ANALYZE FINAL RESULTS TOOLS AND TECHNIQUES 1. Working Groups 2. Negotiation OUTPUTS 1. Decision Making 2. Lessons Learned 3. Agreement on Results This flowchart is part of the article “Calculating the Return on Investment on a Project Management Office (PMO)” developed by Ricardo Viana Vargas. © Macrosolutions SA. All rights reserved. Reproduction prohibited. ricardo-vargas.com Get the white paper at http://rvarg.as/roipmo 7
  • 8.
    Step by StepProcess: Tiger Screws Case Get the white paper at http://rvarg.as/roipmo 8
  • 9.
    Tiger Screws Company SDA EMPRESA •  Founded in 1961 •  Third largest screw A Tiger Screws foi fundada em 1961 e é manufacturer in the country a terceira maior fabricante de parafusos do país.Produces 4200 tons per month •  Tem capacidade para produzir 4,2 mil •  12,000 products comprising toneladas/mês e um portfólio de 12 mil produtos em 280 diferentes linhas. 280 different lines Com faturamento de R$48.000.000.00 no último ano, a Tiger Screws •  Revenues of $48,000,000.00 tem crescido em média 21% ao ano. Outra empresa, a líder nesse last year segmento, tem faturamento de R$79.000.000.00 e uma média de crescimento de 15% ao ano. 70% das vendas da Tiger Screws são feitas no mercado nacional e 30% em outros 6 países dos continentes americano at http://rvarg.as/roipmo Get the white paper e africano. 9
  • 10.
    IN THE COUNTRYWITH A STRONG INTERNATIONAL PRESENCE INCREASE REVENUE WITH THE RIGHT MIX OF PRODUCTS LEARNING AND GROWTH INTERNAL PROCESSES MARKET FINANCE MAP IMPROVE FINANCIAL RETURNS BE A LEADER IN THE DOMESTIC MARKET REDUCE PRODUCTION COSTS INCREASE INTERNATIONAL MARKET SHARE CUSTOMER RELATIONSHIP INTERNATIONALIZATION IMPROVE CUSTOMER SERVICE DEVELOP INTERNATIONAL MARKETS INCREASE PROJECTS RESULTS REDUCE LOST-TIME ACCIDENTS OPTIMIZE THE PRODUCT MIX REDUCE CUSTOMER COMPLAINTS MONITOR CUSTOMERS' NEEDS IN OTHER COUNTRIES REDUCE OPERATING LOSS CONTROL MAINTENANCE COSTS REDUCE MACHINERY PROGRAMMING TIME DEVELOP HUMAN RESOURCES OPERATIONAL EXCELLENCE STRENGTHEN INTERNAL COMMUNICATION BETWEEN AREAS DEVELOP INFORMATION MANAGEMENT SYSTEMS © 2012 - Macrosolutions SA and e Symnetics Consultoria Empresarial Ltda. All rights reserved. Reproduction is prohibited. Get the white paper at http://rvarg.as/roipmo 10
  • 11.
    Project Portfolio Get thewhite paper at http://rvarg.as/roipmo 11
  • 12.
    Get the whitepaper at http://rvarg.as/roipmo 12
  • 13.
    Medium nology Medium Low es Medium Modernization of theInstrumentation System Medium E-commerce Tiger Screws’ Project List Low PROJECT High Corporate Office Projects High Review of Low Mix Low Product Zero elopmentAccidents High High New Markets es Internationalization of Production Units Very High High Modernization of the Instrumentation System High High Import Finished Products es E-commerce Low Very None Corporate High Projects High Office nology New Markets Medium Medium University Tiger Screws New Line for the Oil Industry Opening of Capital Social Media ERP System New Maintenance Policy University Tiger Screws New Line for the Oil Industry Import Finished Products Opening of Capital Get the white paper at http://rvarg.as/roipmo 13
  • 14.
    Example of PreliminaryInformation Get the white paper at http://rvarg.as/roipmo 14
  • 15.
    Tiger Screws PortfolioConsolidated Information Get the white paper at http://rvarg.as/roipmo 15
  • 16.
    Tiger Screws PortfolioConsolidated Information Get the white paper at http://rvarg.as/roipmo 16
  • 17.
    Tiger Screws PortfolioConsolidated Information Get the white paper at http://rvarg.as/roipmo 17
  • 18.
    Tiger Screws PortfolioConsolidated Information Get the white paper at http://rvarg.as/roipmo 18
  • 19.
    Get the whitepaper at http://rvarg.as/roipmo 19
  • 20.
    Monetizing Intangibles Get thewhite paper at http://rvarg.as/roipmo 20
  • 21.
    Example: Corporate University • Q: Why is there interest in the implementation of the Corporate University? –  A: So that we can prepare new talents •  Q: Why is there interest in preparing new talents? –  A: To have in the future a greater allegiance in our executive level professionals. Get the white paper at http://rvarg.as/roipmo 21
  • 22.
    Example: Corporate University • Q: Why do you want higher allegiance in the future? –  A: To lessen the turnover that generates additional costs Then it can be concluded that one of the main objectives of the Corporate University is to reduce additional costs of hiring. Imagine that the Tiger Screws’ cost of hiring is $8,716,704 over the next 5 years and that there is a likelihood that they are reduced in the coming years because of the corporate university. Get the white paper at http://rvarg.as/roipmo 22
  • 23.
    AHP and BayesianEstimate: University Tiger Screws Get the white paper at http://rvarg.as/roipmo 23
  • 24.
    Example of Results UniversityTiger Screws •  Result: $608,110.28 •  Investment: $350,000.00 •  Benefit: 258,110.28 •  Project ROI: 74% NOTE: Assuming the values are already brought to their present values. Get the white paper at http://rvarg.as/roipmo 24
  • 25.
    Tiger Screws PortfolioConsolidated Information Get the white paper at http://rvarg.as/roipmo 25
  • 26.
    Tiger Screws PortfolioConsolidated Information The Total duration is used only to determine the approximate total workload in projects. The term may be replaced by man/hour or other measures of effort. Get the white paper at http://rvarg.as/roipmo 26
  • 27.
    Tiger Screws PortfolioConsolidated Information Get the white paper at http://rvarg.as/roipmo 27
  • 28.
    Get the whitepaper at http://rvarg.as/roipmo 28
  • 29.
    Get the whitepaper at http://rvarg.as/roipmo 29
  • 30.
    Get the whitepaper at http://rvarg.as/roipmo 30
  • 31.
    Get the whitepaper at http://rvarg.as/roipmo 31
  • 32.
    Data Distribution Profile Getthe white paper at http://rvarg.as/roipmo 32
  • 33.
    Get the whitepaper at http://rvarg.as/roipmo 33
  • 34.
    Standish Group Report Getthe white paper at http://rvarg.as/roipmo 34
  • 35.
    FEL and InvestmentProjects Get the white paper at http://rvarg.as/roipmo 35
  • 36.
    PMI Pulse Report2012 Get the white paper at http://rvarg.as/roipmo 36
  • 37.
    PwC Report Get thewhite paper at http://rvarg.as/roipmo 37
  • 38.
    Chosen Profile: Tiger Screws- Conservative Get the white paper at http://rvarg.as/roipmo 38
  • 39.
    Simulation Get the whitepaper at http://rvarg.as/roipmo 39
  • 40.
    Get the whitepaper at http://rvarg.as/roipmo 40
  • 41.
    Get the whitepaper at http://rvarg.as/roipmo 41
  • 42.
    Get the whitepaper at http://rvarg.as/roipmo 42
  • 43.
    Get the whitepaper at http://rvarg.as/roipmo 43
  • 44.
    Get the whitepaper at http://rvarg.as/roipmo 44
  • 45.
    Get the whitepaper at http://rvarg.as/roipmo 45
  • 46.
    Investments in PMO Getthe white paper at http://rvarg.as/roipmo 46
  • 47.
    Get the whitepaper at http://rvarg.as/roipmo 47
  • 48.
    PMO Tiger Screws PMOInvestments Get the white paper at http://rvarg.as/roipmo 48
  • 49.
    Influence of thePMO on Results Get the white paper at http://rvarg.as/roipmo 49
  • 50.
    Get the whitepaper at http://rvarg.as/roipmo 50
  • 51.
    Get the whitepaper at http://rvarg.as/roipmo 51
  • 52.
    Results Get the whitepaper at http://rvarg.as/roipmo 52
  • 53.
    Get the whitepaper at http://rvarg.as/roipmo 53
  • 54.
    Tiger Screws PMO ROICalculation Get the white paper at http://rvarg.as/roipmo 54
  • 55.
    Tiger Screws PMO ROICalculation Get the white paper at http://rvarg.as/roipmo 55
  • 56.
    Tiger Screws PMO ROICalculation Get the white paper at http://rvarg.as/roipmo 56
  • 57.
    Get the whitepaper at http://rvarg.as/roipmo 57
  • 58.
    Key Points andConclusions •  The model is a "master line” of the value calculation and can thus be customized. •  The entire process is to be performed in teams. •  Any mathematical model is a simplification of the real process. •  The result of the PMO is achieved by simulating imagined future scenarios (a risk inherent to the process). Get the white paper at http://rvarg.as/roipmo 58
  • 59.
    Ace in thehole Get the white paper at http://rvarg.as/roipmo 59
  • 60.
    Conclusions •  It isimpossible to determine ROI without knowing which projects are selected and the strategy that goes behind them. •  If the PMO will manage projects with no calculable benefits (mathematically intangible), it is essential that the calculation process (step 2) is carried out with great care and attention. •  This is a laborious process but much more effective to determine/prove the value of the PMO. Get the white paper at http://rvarg.as/roipmo 60
  • 61.
    Contact Information Ricardo VianaVargas ricardov@unops.org / ricardo@ricardo-vargas.com www.unops.org Twitter: @rvvargas Get the white paper at http://rvarg.as/roipmo Get the white paper at http://rvarg.as/roipmo 61