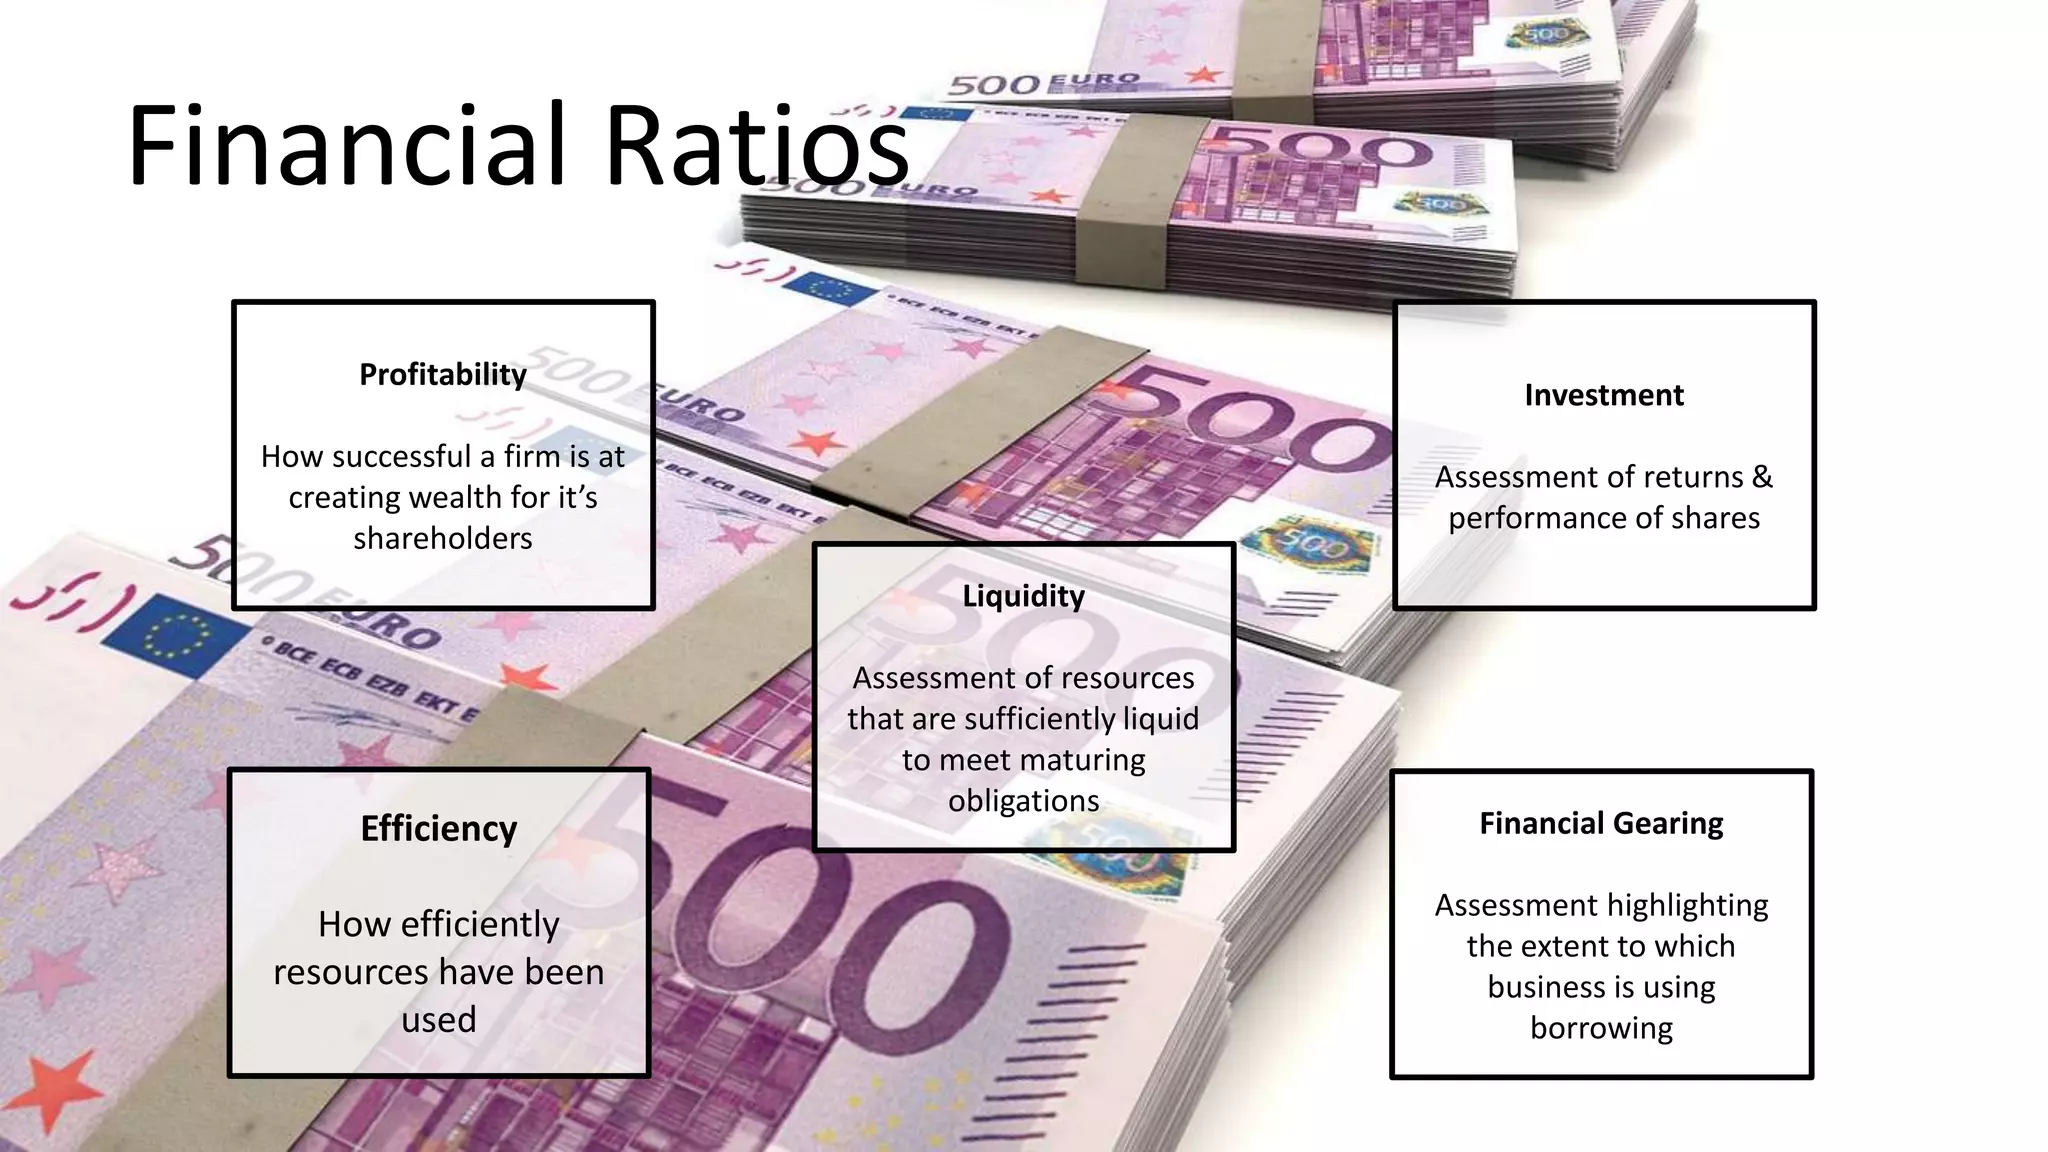
Profitability
How successful a firm is at
creating wealth for it’s
shareholders
Investment
Assessment of returns &
performance of shares
Efficiency
How efficiently
resources have been
used
Liquidity
Assessment of resources
that are sufficiently liquid
to meet maturing
obligations
Financial Gearing
Assessment highlighting
the extent to which
business is using
borrowing
Financial Ratios
• Ratios provide a quick and simple means of assessing the
financial health of a business
• Ratio relates one figure, say Net Profit, to another figure from
the financial statements, say per employee
• Ratios summarise quite complex data into a small number of key
indicators
• Ratios enable comparison of different businesses
• Ratios overcome issue of difference in scale of businesses
Example
Example, Business A profit £1m and
B profit £2m only tells us that B
made more profit whereas if relate
each profit to business size a valid
comparison could be make between
A and B
• Ratios are also used to compare current performance with past performance
to identify trends
• Calculating ratios is easy, the hard part is interpreting the ratios and using
skill, knowledge and experience to draw valid and useful conclusions
• Ratios are expressed in various forms – percentages, proportions, number of
days (debtor and creditor days) etc
• The way the ratio is expressed depends on the needs of those using the
information
• Traditionally ratios are classified into five groups:
• Profitability; Efficiency/Activity; Liquidity; Financial Gearing and Investment
ratios
Ratios can be compared with
• Past Periods
They must consider that trading conditions different in the
periods compared
• Similar businesses for the same period
may have different year ends & accounting policies
• Planned performance
Compare with target – compare planed Vs. Actual performance
Profitability Ratios
Return on ordinary shareholders’ funds (ROSF)
Profit for the year -any preference dividend
Ordinary share capital + Reserves
x 100
Profitability Ratios
Return on capital employed (ROCE)
Operating profit
Share capital + Reserves + Non-current liabilities
x 100
Q&A
Return on capital employed (ROCE)
You are the managing director of a small restaurant chain,
Petites. You are concerned about your company’s profitability and
want to compare it with that of a major competitor, Garcon. In
previous years the ratios have been broadly comparable between
the companies in spite of their different size.
You have obtained the following information.
Q&A
Return on capital employed (ROCE)
Petites Garcon
£ £
Revenue 127,966 384,898
Gross Profit 65,455 182,474
Net Profit 19,356 69,282
Equity 56,302 206,036
Bank Loan 40,000 80,000
Required:
Calculate the relevant profitability ratios and comment on the results.
What additional information would you seek given the opportunity?
Q&A
Return on capital employed (ROCE)
Petites Garcon
GP% = GP/Revenue = 51.1% 47.4%
NP% = NP/Revenue = 15.1% 18.0%
ROCE% = NP/(Shareholders Funds + Long Term Loans) = 20.1% 24.2%
Comment: Petites have the better GP% indicating either higher selling prices
or lower Cost of Sales. Petites Overheads ( Fixed Costs ) are higher than those
of Garcon ( despite a higher GP% ) and producing a significantly lower NP% -
hence management should look at this area of expense. ROCE% is significantly
lower and a result of either a lower NP%, comparatively higher capital
employed, or both.
Profitability Ratios
Operating profit margin
Operating profit
Sales revenue
x 100
Profitability Ratios
Gross profit margin
Gross profit
Sales revenue
x 100
Efficiency Ratios
Average inventories turnover period
Average inventories held
Cost of sales
x 365
Efficiency Ratios
Average settlement period for receivables
Average trade receivables
Credit sales revenue
x 365
Efficiency Ratios
Average settlement period for payables
Average trade payables
Credit purchases
x 365
Efficiency Ratios
Sales revenue to capital employed
Sales Revenue
Share capital + Reserves + Non-current liabilities
Efficiency Ratios
Earnings per share
Sales Revenue
Number of employees
x 365
Liquidity Ratios
Current Ratio
Current assets
Current liabilities
Liquidity Ratios
Acid test ratio
Current assets (excluding inventories)
Current liabilities
Gearing Ratios
Gearing ratio
Long term (non current) liabilities
Share capital + Reserves + Long term (non current) liabilities
x 100
Gearing Ratios
Interest cover ratio
Operating profit
Interest payable
x 100
Investment Ratios
Dividend payout ratio
Dividends announced for the year
Earnings for the year available for the dividends
x 100
Investment Ratios
Dividend cover ratio
Earnings for the year available for dividend
Dividends announced for the year
Investment Ratios
Dividend Yield ratio
Dividend per share / (1-t)
Market value per share
x 100
Relates cash return to market value, -t = dividend tax rate of income tax
Dividends issued net of income tax
Investment Ratios
Earnings per share
Earnings available to ordinary shareholders
Number of ordinary shares in issue
Earnings Per Share can be used to help assess the investment potential of
a business’s shares, however it is not useful to compare the EPS of one
business with another.
Investment Ratios
Price/Earnings ratio (P/E)
Market value per share
Earnings per share
This can be used as a measure of market confidence in a business for the
future. However it should be noted that differences in accounting policies
between businesses can lead to different profit and EPS figures.

Financial ratios

  • 1.
    Profitability How successful afirm is at creating wealth for it’s shareholders Investment Assessment of returns & performance of shares Efficiency How efficiently resources have been used Liquidity Assessment of resources that are sufficiently liquid to meet maturing obligations Financial Gearing Assessment highlighting the extent to which business is using borrowing Financial Ratios
  • 2.
    • Ratios providea quick and simple means of assessing the financial health of a business • Ratio relates one figure, say Net Profit, to another figure from the financial statements, say per employee • Ratios summarise quite complex data into a small number of key indicators • Ratios enable comparison of different businesses • Ratios overcome issue of difference in scale of businesses
  • 3.
    Example Example, Business Aprofit £1m and B profit £2m only tells us that B made more profit whereas if relate each profit to business size a valid comparison could be make between A and B
  • 4.
    • Ratios arealso used to compare current performance with past performance to identify trends • Calculating ratios is easy, the hard part is interpreting the ratios and using skill, knowledge and experience to draw valid and useful conclusions • Ratios are expressed in various forms – percentages, proportions, number of days (debtor and creditor days) etc • The way the ratio is expressed depends on the needs of those using the information • Traditionally ratios are classified into five groups: • Profitability; Efficiency/Activity; Liquidity; Financial Gearing and Investment ratios
  • 5.
    Ratios can becompared with • Past Periods They must consider that trading conditions different in the periods compared • Similar businesses for the same period may have different year ends & accounting policies • Planned performance Compare with target – compare planed Vs. Actual performance
  • 6.
    Profitability Ratios Return onordinary shareholders’ funds (ROSF) Profit for the year -any preference dividend Ordinary share capital + Reserves x 100
  • 7.
    Profitability Ratios Return oncapital employed (ROCE) Operating profit Share capital + Reserves + Non-current liabilities x 100
  • 8.
    Q&A Return on capitalemployed (ROCE) You are the managing director of a small restaurant chain, Petites. You are concerned about your company’s profitability and want to compare it with that of a major competitor, Garcon. In previous years the ratios have been broadly comparable between the companies in spite of their different size. You have obtained the following information.
  • 9.
    Q&A Return on capitalemployed (ROCE) Petites Garcon £ £ Revenue 127,966 384,898 Gross Profit 65,455 182,474 Net Profit 19,356 69,282 Equity 56,302 206,036 Bank Loan 40,000 80,000 Required: Calculate the relevant profitability ratios and comment on the results. What additional information would you seek given the opportunity?
  • 10.
    Q&A Return on capitalemployed (ROCE) Petites Garcon GP% = GP/Revenue = 51.1% 47.4% NP% = NP/Revenue = 15.1% 18.0% ROCE% = NP/(Shareholders Funds + Long Term Loans) = 20.1% 24.2% Comment: Petites have the better GP% indicating either higher selling prices or lower Cost of Sales. Petites Overheads ( Fixed Costs ) are higher than those of Garcon ( despite a higher GP% ) and producing a significantly lower NP% - hence management should look at this area of expense. ROCE% is significantly lower and a result of either a lower NP%, comparatively higher capital employed, or both.
  • 11.
    Profitability Ratios Operating profitmargin Operating profit Sales revenue x 100
  • 12.
    Profitability Ratios Gross profitmargin Gross profit Sales revenue x 100
  • 13.
    Efficiency Ratios Average inventoriesturnover period Average inventories held Cost of sales x 365
  • 14.
    Efficiency Ratios Average settlementperiod for receivables Average trade receivables Credit sales revenue x 365
  • 15.
    Efficiency Ratios Average settlementperiod for payables Average trade payables Credit purchases x 365
  • 16.
    Efficiency Ratios Sales revenueto capital employed Sales Revenue Share capital + Reserves + Non-current liabilities
  • 17.
    Efficiency Ratios Earnings pershare Sales Revenue Number of employees x 365
  • 18.
    Liquidity Ratios Current Ratio Currentassets Current liabilities
  • 19.
    Liquidity Ratios Acid testratio Current assets (excluding inventories) Current liabilities
  • 20.
    Gearing Ratios Gearing ratio Longterm (non current) liabilities Share capital + Reserves + Long term (non current) liabilities x 100
  • 21.
    Gearing Ratios Interest coverratio Operating profit Interest payable x 100
  • 22.
    Investment Ratios Dividend payoutratio Dividends announced for the year Earnings for the year available for the dividends x 100
  • 23.
    Investment Ratios Dividend coverratio Earnings for the year available for dividend Dividends announced for the year
  • 24.
    Investment Ratios Dividend Yieldratio Dividend per share / (1-t) Market value per share x 100 Relates cash return to market value, -t = dividend tax rate of income tax Dividends issued net of income tax
  • 25.
    Investment Ratios Earnings pershare Earnings available to ordinary shareholders Number of ordinary shares in issue Earnings Per Share can be used to help assess the investment potential of a business’s shares, however it is not useful to compare the EPS of one business with another.
  • 26.
    Investment Ratios Price/Earnings ratio(P/E) Market value per share Earnings per share This can be used as a measure of market confidence in a business for the future. However it should be noted that differences in accounting policies between businesses can lead to different profit and EPS figures.